

Abstract
Adult zebra finch songs consist of stereotyped sequences of syllables. Although some behavioral and physiological data suggest that songs are structured hierarchically, there is also evidence that they are driven by nonhierarchical, clock-like bursting in the premotor nucleus HVC (used as a proper name). In this study, we developed a semiautomated template-matching algorithm to identify repeated sequences of syllables and a modified dynamic time-warping algorithm to make fine-grained measurements of the temporal structure of song. We find that changes in song length are expressed across the song as a whole rather than resulting from an accumulation of independent variance during singing. Song length changes systematically over the course of a day and is related to the general level of bird activity as well as the presence of a female. The data also show patterns of variability that suggest distinct mechanisms underlying syllable and gap lengths: as tempo varies, syllables stretch and compress proportionally less than gaps, whereas syllable–syllable and gap–gap correlations are significantly stronger than syllable–gap correlations. There is also increased temporal variability at motif boundaries and especially strong positive correlations between the same syllables sung in different motifs. Finally, we find evidence that syllable onsets may have a special role in aligning syllables with global song structure. Generally, the timing data support a hierarchical view in which song is composed of smaller syllable-based units and provide a rich set of constraints for interpreting the results of physiological recordings.
Keywords: central pattern generator, sequence production, proportional scaling, temporal structure, birdsong, rhythm
Introduction
Most natural behaviors are arranged hierarchically, with complex actions composed of a serial combination of more basic motor gestures (Lashley, 1951; Miller et al., 1960). The learning of courtship song in birds presents an ideal model system for understanding the neural mechanisms underlying complex behavior. Birdsongs have a hierarchical structure spanning timescales from several milliseconds to several seconds, and are executed by well delineated circuitry known as the song system (Fig. 1).
Figure 1.

The song system. The premotor pathway consists of HVC to RA to brainstem nuclei RAm (retroambigualis), PAm (parambigualis), and RVL (ventrolateral nucleus of the rostral medulla), which project to respiratory motor neurons, and nXIIts (nervi hypoglossi, pars tracheosyringealis), which projects to the syrinx. RA can influence respiratory brainstem nuclei via alternative circuitry passing through the midbrain nucleus DM (dorsomedial intercollicular). DM is also involved in an ascending pathway that extends to Uva (nucleus uvaeformis), NIf (interfacial nucleus of the nidopallium), and back to HVC. HVC–RA activity is modulated by two pathways: (1) the descending anterior forebrain pathway (AFP), which consists of area X, DLM (dorsolateral nucleus of the medial thalamus), and LMAN, and (2) an ascending pathway from DMP (dorsomedialis posterior thalami) to MMAN (medial magnocellular nucleus of the anterior nidopallium).
Zebra finch songs are highly stereotyped, making them especially well suited for in-depth analysis. The acoustic structure of song is arranged in a hierarchy, with vocal units known as syllables strung together in sequences called motifs (see Fig. 2). Several lines of evidence suggest that this acoustic hierarchy is embedded within the underlying representation for song. Flashes of light cause birds to interrupt their song at syllable boundaries (Cynx, 1990; Franz and Goller, 2002), and the patterns of inspiration/expiration segment the song into syllables and acoustic gaps (Wild et al., 1998; Suthers and Margoliash, 2002; Goller and Cooper, 2004). Early electrophysiological experiments suggest that this structure is reflected in the anatomical hierarchy in the forebrain, with nucleus HVC (used as a proper name) being responsible for syllable sequence and nucleus robust nucleus of the arcopallium (RA) representing individual syllables (Vu et al., 1994; Yu and Margoliash, 1996).
Figure 2.

Zebra finch song. Spectrograms from the shortest (top) and longest (bottom) songs in the sequences recorded from bird 10. Arrowheads indicate the onset and offset of each syllable measured by an automated algorithm. The algorithm marks syllable boundaries according to reliable peaks in the amplitude derivative, so that less reliable, small amplitude parts of some syllables fall outside these boundaries (see Materials and Methods).
This hierarchical view has been challenged by recent recordings of the HVC neurons projecting to RA [HVC(RA) neurons] (Hahnloser et al., 2002). During each motif, individual HVC(RA) neurons produce a burst of spikes aligned to the acoustic output on the millisecond timescale. Although the number of recorded neurons was limited, the bursts did not appear to respect syllable versus gap distinctions. These results have led Fee et al. (2004) to propose what we term the “music box” model for song production: HVC activity serves as the clock-like drum of the music box, and the HVC–RA synaptic connections trigger bursts in RA, which get readout by brainstem motor nuclei. Under this proposal, there is no hierarchical division of motifs into syllables and gaps. With its uniform representation, the music box model predicts that changes in song tempo should be accompanied by proportional scaling of all parts of the song, with no correlation structure that would delineate articulatory units (for discussions of proportional scaling in humans, see Gentner, 1987; Heuer, 1988; de Jong, 2001; Rhodes et al., 2004).
We addressed these issues by making fine-grained measurements of syllable timing within zebra finch songs and analyzing subtle patterns of variation within and across motifs. We find that song length changes systematically over the course of a day, and these changes are expressed across the song as a whole rather than resulting from an accumulation of independent variance during singing. Our data also show patterns of variability that distinguish syllables and intersyllable gaps and thus provide strong evidence for hierarchical structure in the song output. As tempo changes, syllables stretch and compress proportionally less than gaps, a violation of the proportional scaling implied by the simplest form the music box model. [Note that our data do not bear on the sparseness of the underlying representation (Hahnloser et al. (2002).] We also find increased temporal variability at motif boundaries and especially strong positive correlations between the same syllables sung in different motifs.
Materials and Methods
Terms
Zebra finch song consists of several introductory notes followed by a series of discrete vocalizations that is repeated several times (Fig. 2). We will refer to syllables as any vocalization delineated by silence on either side, motifs as stereotyped series of syllables, and songs as an uninterrupted series of motifs produced back-to-back and separated by silence on either side. Because we truncate songs to analyze identical sequences of syllables with a fixed number of motifs, we will generally use the term “sequence” rather than song.
Bird housing and recording
Recordings
All care and housing of birds conformed to the procedures approved by the institutional animal care and use committee at the University of Maryland, College Park. Birds were maintained on a 14/10 h light/dark cycle and given food ad libitum.
This paper focuses on the analysis of temporal variability in songs produced by zebra finches in the presence of other male birds (“undirected song”) (Sossinka and Bohner, 1980). The majority of these recordings (86%) were obtained from adult birds that were acting as tutors for other developmental studies. Other recordings were made in the presence of another adult male or when the bird was alone. To minimize the effect of subtle changes in song that can occur in young adulthood, the data analyzed came from birds that were at least 400 d after hatch. We also examined temporal structure within a smaller dataset of songs recorded in the presence of a female (“directed song”). Unless explicitly specified, all statements pertain to the larger sample of undirected song.
For all recordings, birds were housed in ∼18 × 36 × 31 cm cages within small sound-isolation chambers (Industrial Acoustics, Bronx, NY). Cages were separated by ∼18 cm, and two directional microphones (Pro 45; Audio-Technica, Stow, OH) were placed in this space. Between recording sessions, birds were returned to the colony room, where they were housed in larger cages with several (at least six) adult males or were paired with a female for breeding.
Real-time signal processors (Tucker Davis, Alachua, FL) digitized the signal at 24,414.1 Hz. Data were selected using a circular buffer and a sliding window amplitude algorithm (∼10 ms of below threshold sound needed to stop data recording). “Sound clips” selected by this algorithm that were separated by <200 ms were considered part of the same “recording” (candidate song) and were “glued” back together with the correct temporal alignment by filling periods between clips with zeros. Extensive examination of song recordings indicated that relative power in the two microphones averaged over the entire song is sufficient to unambiguously determine which bird is singing in the vast majority of cases. All signal analysis was performed in Matlab (MathWorks, Natick, MA).
Sample
To minimize the effects of extraneous behavioral variables, recordings of undirected song spanned at least 100 d and included data from at least two recording sessions with different juveniles. This left us with a universe of 20 birds. Of these, one bird was omitted because the song was deemed excessively variable and noisy, and five were omitted because, as juveniles, they had learned most of their song from another adult in the sample. For each bird, we gathered an initial pseudorandom sample of 1000 candidate songs that were at least 1200 ms long and had maximum power from the side on which the target adult was stationed. We omitted two additional birds because the template-matching algorithm (described below) failed to detect >100 sequences from those samples. This left us with a sample of 12 birds.
Sequence identification
All analysis described here concerns the main sample of undirected songs. Directed analysis is detailed below. In the first stage of analysis, repeated sequences of syllables were identified within the recording samples. A syllable was defined as any regular and continuous vocalization delimited by at least 5.243 ms of silence on either side. In a few cases, syllables occasionally split into parts separated by periods of silence longer than this criterion. In these cases, the entire period was analyzed as a single syllable. Mean syllable length was 110 ± 56 ms, with a range of 37–294 ms. Recordings were analyzed using the complex amplitudes obtained from a fast-Fourier transform (FFT) using a 256-sample (10.486 ms) window advanced in 128-point steps.
Sequences were identified using a semiautomated procedure consisting of several steps: (1) a hand screening of song was done to determine the most common sequence of syllables produced by each bird; (2) a spectrotemporal template was developed for each syllable using an average of two to three syllable exemplars; (3) a modified sliding cross-correlation method was used to determine candidate matches of individual syllable templates to recorded data; (4) these candidate matches were used to select entire sequences using timing and syllable order information; and (5) selected sequences were hand screened to ensure that they matched the template sequence. The goal of the template-matching process was to obtain clean recordings from which accurate temporal measurements could be made using more sophisticated techniques. Candidate songs that did not have a good match to the template were not considered. This may have introduced an unknown amount of selection bias, although visual inspection revealed nothing obvious.
Template sequences. For 10 birds, the most common sequence had two to four motifs produced back-to-back, or ∼1300–2000 ms of continuous song; a greater number of motifs per sequence were chosen if that bird's motif was relatively brief. In two birds, sequences were more variable, and the most common sequence was determined using syllable transition probabilities that had been calculated for other research. Sequencing in these birds was more variable overall, so a higher percentage of those songs were excluded from the analysis. The average motif had five unique syllables (this factors out repeats; range of three to eight) for a total of 60 unique syllables in the sample. Across motifs, each bird's sequence comprised a mean of 12 syllables (range of 9–18; repeats counted multiple times) for a total of 146 syllables across birds.
Syllable templates. Syllable template spectrograms were based on two to three exemplars taken from a single song. The first exemplar syllable was arbitrarily used as a “proto-template,” and other exemplar spectrograms were aligned to this proto-template using the syllable template-matching algorithm described below. The template spectrogram was obtained by averaging across exemplars the amplitudes for each time–frequency bin.
Matching syllable templates and song data. For each syllable template, candidate matches were determined using a sliding window the same length as the template syllable. The spectrograms of the syllable template and each window of the song were normalized separately by first subtracting the mean from each time–frequency bin and then dividing out the root mean squared deviation. The distance between the normalized values was defined as the absolute value of the difference in each time–frequency bin, summed over all bins. The final match value was calculated as the reciprocal of this distance. This match value was observed to be significantly more accurate than a similar one using Euclidean (squared) distance, which gives more weight to larger differences. For each syllable, match values were computed across the bird's entire sample. The threshold for candidate matches was set at the 90th percentile of the distribution of match values. This criterion resulted in a higher threshold for syllables that had stronger matches to extraneous sound or other syllables. An initial set of candidate matches was then determined as above-threshold peaks in the match. Given similarities in acoustic structure between syllables, this process produces a number of false positives.
Sequence selection. The next step in the analysis was to prune candidate matches using motif and timing information. For the purposes of the timing analysis detailed below, the only sequences we considered were stereotyped renditions. The selection algorithm starts with the candidate syllable match that is most likely to belong to a target sequence and searches forward and backward to find syllable matches that are in the expected order and at approximately the expected time. The details of this algorithm are in Appendix A.
Across birds, the algorithm obtained a match to at least one motif in 56 ± 25% (SD) of sampled recordings (range of 17–95%). Most of the recordings without a match consisted of back-and-forth calling and wing flaps. The remainder of omissions was attributable to sequences of syllables that did not match the most common motif structure or failures of the template-matching process, mostly attributable to acoustic interference from other birds in the recording chamber. Within a random sample of 140 sequences, visual inspection revealed that an estimated 16% of the recordings in which the algorithm failed to find a match actually contained a target sequence that was missed. Of the four birds with the fewest matches (<30% of recordings matched), two had songs with variable sequencing, and the proportion of rejections attributable to nonstandard sequences was much higher than the rest of the sample (estimated 40 and 80% compared with 2% for the rest of the sample). In the other two birds, the template-matching process was unreliable, leading to above-average proportions of target sequences that were incorrectly rejected (estimated 50 and 70%). These two birds were excluded from our sample because the template matching yielded <100 sequences each. Finally, of the recordings that contained a match to at least one motif, a mean of 40% was omitted because they contained fewer motifs than in the target sequence for that bird.
Hand screening. All target sequences satisfying the initial template-matching procedure were screened by visual inspection of log-transformed spectrograms to determine whether they were suitable for high precision temporal analysis. Across birds, an average of 40% were omitted, the majority as a result of mild acoustic interference from the other bird in the recording chamber.
Temporal analysis
In the second stage of analysis, the timing of each syllable onset and offset was determined by a modified dynamic time-warping (DTW) algorithm applied to templates consisting of the derivative of the smoothed amplitude envelope of each syllable. Steps of this analysis were as follows: (1) segment and select a portion of the original signal surrounding each syllable match obtained from the sequence-matching procedure above; (2) calculate the smoothed amplitude envelope and take its derivative; (3) for each syllable, make a template using the averaged waveform from all examples of that syllable in the sample; (4) set onset and offset times by choosing peaks and troughs in the template waveform; (5) use DTW to identify onsets and offsets in the recorded data.
Segmentation of the original signal. The sequence-matching procedure provided the best alignment of syllable template spectrograms with the song, defined using 128-point (∼5 ms) time bins. Songs with matched sequences were spectrally reanalyzed using an FFT with a 128-sample window slid forward in four-point steps (yielding ∼0.16 ms time bins). For each template match, we partitioned the song by selecting the portion of the original signal corresponding to the time period of the template, plus a buffer on either end. The preceding buffer extended from the onset of the current template to a point 30 sample points (∼5 ms) beyond the end of the previous template match. Similarly, the subsequent buffer extended from the offset of the current template to a point 30 sample points (∼5 ms) beyond the beginning of the subsequent template match. Information within these buffers was gradually discounted at a later stage of the analysis but was included to allow the identification of syllable boundaries that fell outside the coarser template match.
Amplitude waveform definition. For each syllable partition, corresponding spectrograms were log transformed and summed across the 1.5–7.1 kHz range to yield an amplitude waveform for each selected portion. The frequency range was chosen to encompass the regions of highest power and exclude higher frequencies at which spectral features are less reliable (Chi and Margoliash, 2001). Amplitude waveforms were smoothed with a 64-point Gaussian window with a 25.6-point SD (equivalent to ∼4 ms); this reduced the length of each buffer by 64/2 = 32 points. The amplitude derivative was calculated as the difference in adjacent amplitude values divided by the four-sample time bin. Peaks and troughs of this derivative were used to define onsets and offsets. These correspond to inflection points in the amplitude and proved to be more reliable than either zero crossings in the derivative or heuristically defined threshold crossings in the original amplitude waveforms. Information in the buffers was discounted in a gradual manner by multiplying the amplitude derivative by a value that was equal to one at the edge of the original syllable template match and ramped linearly down to zero at the edge of each buffer.
Waveform templates. Amplitude derivative templates were constructed from windowed waveforms as follows: (1) an initial mean waveform across songs was computed based on the initial spectrogram template alignment, (2) waveforms were aligned to the mean using the raw cross-correlation and a max lag of half the mean length, (3) the mean was recomputed across aligned waveforms, and (4) steps 2 and 3 were repeated for the aligned waveforms. This process amounted to a rudimentary bootstrapping method for computing the mean waveform without having to manually select an exemplar as a template. Step 4 proved to make a significant difference in the resolution of syllables with fast amplitude modulations. Syllables repeated in the same sequence but in different motifs were treated independently in this part of the analysis.
Defining onset and offset times. Template onsets were manually selected among positive peaks toward the beginning of the waveform template, whereas offsets were selected among negative troughs toward the end of the syllable. Selections were based on a combination of how close peaks were to the beginnings/ends of syllables plus height and regularity across songs defined by visual inspection. Frequently, the most reliable onsets/offsets occurred after/before brief periods of low-amplitude noise in the syllable so templates were slightly shorter than the actual periods of vocalization.
Onset and offset identification. Syllable onsets and offsets were identified by mapping individual syllable waveforms to amplitude derivative templates using a modified dynamic time-warping algorithm (Rabiner and Juang, 1993; Anderson et al., 1996). Our implementation was developed to match waveform peaks to corresponding templates by finding a warping of time that maximizes the average product of the template and candidate waveforms. Because the multiplication of large values dominates the matching, the algorithm is directed toward the alignment of peaks and results in a significant improvement in temporal alignment over the traditional DTW based on minimizing Euclidean distance. Individual waveforms were noisier than templates and often had multiple candidate peaks for matching. Visual inspection of several examples confirmed that the times of “double peaks” in syllable waveforms were “averaged” in the alignment with the corresponding peak in the template. Details of the DTW algorithm are presented in Appendix B. We estimate that this algorithm introduced an upwards of ∼0.7 ms measurement error to syllable onsets and 1 ms to offsets (for our derivation of this estimate, see supplemental data, available at www.jneurosci.org as supplemental material).
Outliers and final sample
The template matching and DTW yielded a total of 3175 sequences. Those with at least one interval outside 5 SDs from its mean length were omitted. Across birds, 137 intervals were outliers and 103 sequences were omitted for this reason, ranging from 1–5% of each bird's sample. Conversely, ∼5% of all intervals in omitted sequences were outliers, suggesting a weak tendency for outlying intervals to come from the same songs. Thus, the final sample for analysis consisted of 3072 sequences (106–515 per bird) and 72,192 intervals.
Directed song analysis
Female-directed songs were gathered from a subsample of 4 of the 12 birds. Recordings spanned 2 d in which males spent the night alone. At 11:30 A.M. each day, a female was introduced into the same small cage within each recording chamber and remained there until 4:30 P.M. The male was observed periodically over the afternoon to ensure that songs were in fact directed toward the female, i.e., the male was in close proximity and facing the female while singing. Every detected song that we analyzed was at least 1200 ms long.
We analyzed these songs using a slightly abbreviated template-matching procedure. Syllable templates were defined as described above, and an initial syllable identification was assigned based on the syllable template with the highest matching score. To maximize the number of sequences that could be analyzed, a spectrogram for each recording was visually inspected, and target syllables that were incorrectly matched were manually corrected using custom software. Matched sequences were excluded if it was thought that background noise or recording quality would yield erroneous temporal analysis.
Between 79 and 161 (mean of 108) recordings per bird were gathered; of these, ∼50–70% (mean of 64%) had a target sequence that was matched. Very few songs in this sample had fewer motifs than were defined in the target sequence, and an estimated 5% of target sequences were excluded because of acoustic interference such as wing flaps. Note that a greater proportion of directed songs were retained for temporal analysis than in the sample of undirected song, most likely attributable to greater acoustic interference from juveniles than from females. A total of 266 sequences from directed songs were gathered and analyzed. Temporal analysis followed the procedure described above. As in the undirected sample, songs outside 5 SDs were omitted, yielding 259 sequences (38–87 per bird) and 5915 intervals.
Timing data analyses
Tempo change versus accumulation of variance
One question we addressed was whether variations in sequence length represent tempo changes versus simply an accumulation of variance. To quantify these possibilities, we expressed sequence length as
 |
where xi is the length of interval i, and m is the number of intervals in the sequence. We expressed variance in sequence length as
 |
where var and cov denote variance and covariance. Dividing both sides by the sum of the individual variances, we derive a normalized quantity equal to the ratio of the variance in sequence length to the sum of the individual variances. We call this ratio the “gross covariance” and denote it as g. The gross covariance is equal to 1 plus a value that depends on the summed covariance of all intervals. Values >1 indicate a net positive covariance among intervals, which is what one would expect from a change in overall tempo. Significant differences between sequence length variance and the sum of interval variances were tested using the 95% confidence interval for sequence length variance, which can be obtained from a χ2 distribution.
Elasticity calculations
To quantify how tempo changes are related to changes in the length of individual intervals, we performed linear regressions of individual interval lengths xi with overall sequence length z, i.e., we write the following:
 |
where bi is the regression coefficient, and ϵi the residual. One of our primary interests was whether zebra finch song displays proportional scaling in which changes in song length are accomplished by a proportional scaling in the lengths of each of its intervals. If proportional scaling holds, the regression coefficient bi should be equal to the ratio of the mean interval length to mean sequence length. We tested whether intervals violated proportional scaling by first calculating the SE of a regression coefficient, which is given by
 |
where n is the number of sequences, and mse is the mean squared error from the regression ([1 – n] Σ ϵ2). We then used a two-tailed t test with a null hypothesis of proportional scaling in which the regression coefficient should be equal to the ratio of the mean interval length to mean sequence length, bi = x̄i/z̄.
Note that, in the DTW algorithm used to measure syllable onsets and offsets, local path constraints were slightly biased away from a slope of 1 (see Appendix B). Thus, if there were any possible bias introduced into coefficients by our DTW, it would be in favor of syllables having larger regression coefficients.
Conceptually, bi represents the ability of an interval to stretch and compress with sequence length. Because we were most interested in whether an interval stretched proportionally more or less than the entire song, we normalized bi by dividing out the value expected for bi under the condition of proportional scaling such that
 |
We term this normalized version of the regression coefficient βi the “elasticity” of an interval. Proportional scaling implies uniform elasticity across intervals such that the normalized coefficient equals 1 for all intervals. For ease of comparison across intervals, throughout the paper, we report normalized elasticity coefficients only.
For some analyses, we were interested in whether intervals had correlations that were independent of song tempo. For these analyses, we calculated the correlation coefficients among the residual values ϵi.
Elasticity for pairs of intervals
For the purpose of determining whether syllable onsets have a special role in timing, we examined how the elasticity of each interval in a pairing of one syllable and one gap contributes to the elasticity in the sum of the two interval lengths. For two intervals xi and xj, we write the sum of the regression equation as follows:
 |
Dividing the coefficient of z by (x̄i + x̄j)/z̄, we find that the elasticity coefficient for the pair of intervals, βi+j = ciβi + cjβj, where ci = x̄i/(x̄i + x̄j) and cj = x̄j/(x̄i + x̄j). That is, the elasticity of the joint interval is the average of the component intervals, weighted by their contribution to overall length. If onsets are especially tied to global tempo, one would expect the elasticity coefficient for a pair of intervals consisting of a syllable and the subsequent gap to be tightly clustered around 1.
Statistical analysis
Interval and song length data contained >100 sequences per bird. Because visual inspection indicated normality, Pearson's correlation coefficient was used to test the relationships among lengths. However, most of our inferential statistics compared distributions of variables that violate the independence assumption in t tests, so we used more conservative nonparametric tests. Unless indicated otherwise, differences between two distributions were assessed using the two-tailed Wilcoxon's rank sum test, and determinations of whether a given distribution differed from a specific value relied on the Wilcoxon's ranked sign test. The Wilcoxon's sign test was also used when comparing pairwise differences between two dependent samples. All mean quantities are reported with SEs.
Results
The temporal structure of zebra finch song was examined by analyzing the temporal variability in the songs of 12 adult zebra finches. In the main sample, we report throughout this section that the majority of recordings (86%) were made as part of other developmental studies in which an adult male tutor and a juvenile finch were housed in two small cages within a single recording chamber. Females were not present during any of these recordings.
Zebra finch song generally consists of several short introductory notes, followed by a series of two to seven motifs, each consisting of a stereotyped sequence of syllables (periods of vocal output separated by silence) (Fig. 2). The present study focused on the temporal variability of syllable lengths and the lengths of the gaps between syllables; spectral structure was not analyzed (but see supplemental data, available at www.jneurosci.org as supplemental material). Recordings containing the most common sequence produced by each bird were identified using an automated template-matching algorithm and manually screened (see Materials and Methods). Introductory notes were not considered, and longer songs were truncated so that the data analyzed contained repeated renditions of an identical series of syllables. Because we did not analyze entire songs, we refer to each series of syllables as a sequence.
Syllable onsets and offsets were recalculated at a finer temporal resolution with a modified dynamic time-warping algorithm (see Materials and Methods). Generally, we will use the term “interval” to denote the time between adjacent syllable boundaries. We divided this into two interval types: syllables and the gaps between syllables. Hence, a sequence with n syllables had n – 1 gaps and 2n – 1 intervals. Our sample had 280 distinct intervals (146 syllables and 134 gaps); in the main undirected sample, we analyzed a total of 3072 sequences containing 72,192 intervals across birds. We also considered the intervals between the onsets of consecutive syllables; we denote these special intervals “inter-onset intervals.” Syllables having the same spectrotemporal structure (e.g., syllable “A” in the first and second motifs) are said to have the “same identity” and constitute one “unique syllable” (total of 60 unique syllables across birds). In 2 of the 12 birds analyzed, the sequence of syllables in the first and second motifs were not identical.
Descriptive statistics
Table 1 summarizes the descriptive statistics across syllables, gaps, inter-onset intervals, motifs, and sequences. Overall timing was very tight with the coefficient of variation (CV = SD/mean) for sequence length ranging from 1.1 to 1.7%. Half of all syllables and gaps deviated from their respective means by <1.5 ms, or ∼1.5–2.5% of mean length. Syllable lengths were slightly more variable than gaps, but this is attributable to the fact that syllables were significantly longer than gaps and that variability was positively correlated with interval length (r = 0.376; p < 0.0001). However, gap CV was generally ∼1.5 times greater than syllable CV.
Table 1.
Summary statistics regarding the length of song components
|
|
Mean |
SD |
n |
|---|---|---|---|
| Mean (ms) | |||
| Syllables | 94.51 | 51.18 | 146 |
| Gaps | 49.87 | 16.10 | 134 |
| Inter-onset | 142.39 | 55.93 | 134 |
| Motifs | 627.68 | 195.21 | 10 |
| Sequences | 1706.80 | 263.15 | 12 |
| SD (ms) | |||
| Syllables | 2.54 | 0.92 | 146 |
| Gaps | 2.39 | 0.98 | 134 |
| Inter-onset | 3.18 | 1.12 | 134 |
| Motifs | 10.30 | 2.78 | 10 |
| Sequences | 24.28 | 4.78 | 12 |
| CV (%) | |||
| Syllables | 3.28 | 2.05 | 146 |
| Gaps | 4.91 | 1.79 | 134 |
| Inter-onset | 2.34 | 0.87 | 134 |
| Motifs | 1.67 | 0.16 | 10 |
| Sequences |
1.42 |
0.17 |
12 |
Changes in song length reflect tempo changes
Changes in song length can be attributed to two basic sources. First, these deviations could result from small independent perturbations that accumulate during the production of an individual song. Alternatively, changes in song length may reflect song-to-song variations in a global tempo mechanism that exerts its effects throughout the song. In the music box analogy, changes in tempo would correspond to variations in the overall speed of rotation in the music box drum.
To gain an understanding of how these scenarios would affect the accumulation of timing deviance, we constructed a simple model that can generate random interval lengths. By changing a single parameter, the model generates sequences based on these two scenarios, leaving other factors constant (see Appendix C). Sequences of interval lengths were generated such that the number of sequences, the variance of overall sequence length, and the mean length of each interval were matched to experimental data from given bird. In the “independent intervals” version of the model, the length of each interval was chosen independently, whereas in the “tempo change” version, interval lengths were dominated by a global tempo factor shared by all intervals. Figure 3 shows a graphical comparison between the models and the data from bird 10. Each line depicts the accumulation of deviation from this average sequence for a given sequence. These plots indicate that global tempo has a strong influence on interval length.
Figure 3.
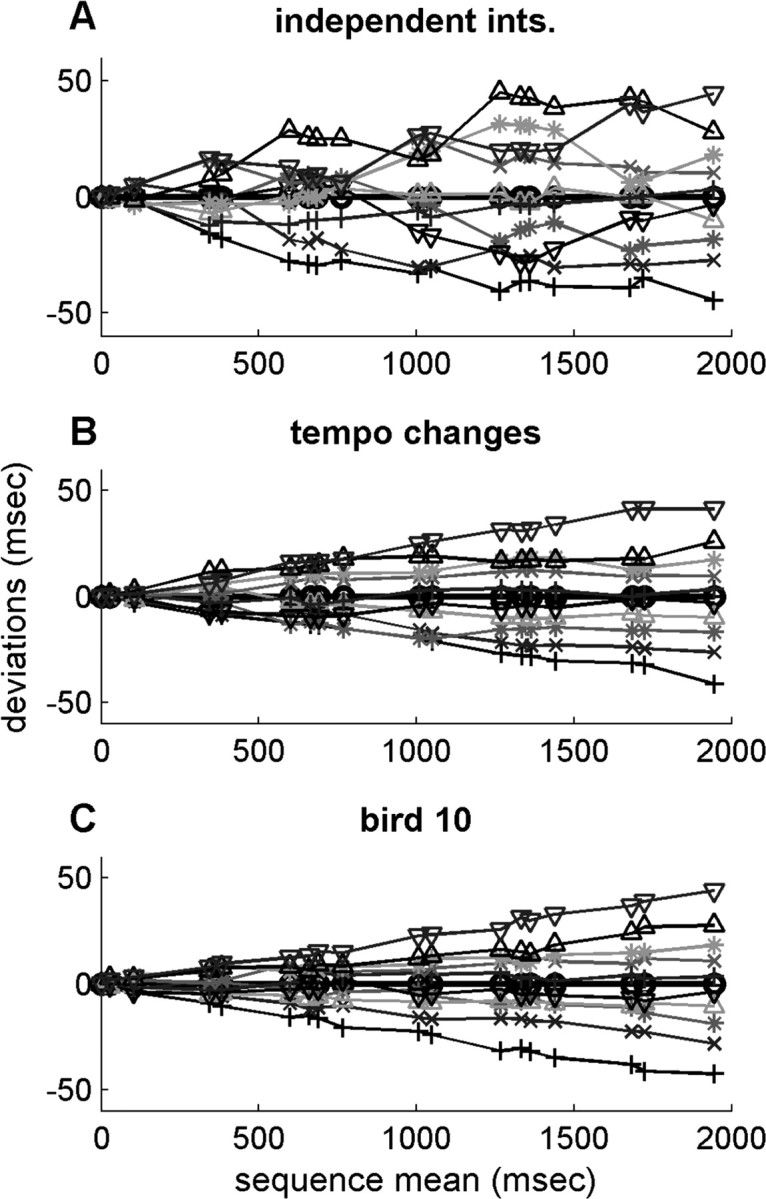
Qualitative analysis of interval length deviations. Each line indicates cumulative deviations from the mean for a single sequence. Markers indicate syllable onsets and offsets. The x-axis indicates the mean time from the beginning of the sequence for each onset and offset. The y-axis represents cumulative deviation from mean timing up to that point in the sequence. Sequences shown are at the fifth, 15,..., 85, and 95 percentiles of the distributions of sequence length (thus, individual interval deviations do not necessarily reflect percentiles because they do not perfectly correlate with sequence length).A, Simulated sequences in which interval deviations are independent. B, Simulation sequences in which deviations are positively correlated. C, Experimentally measured sequences from bird 10.
To quantify the strength of global tempo, we used a normalized measure termed gross covariance, denoted g (see Materials and Methods). The measure g is equal to the sequence length variance divided by the sum of individual interval variances. If variations in song length are determined by an accumulation of independent interval deviations, then sequence length variance is equal to the sum of interval variances, and g is equal to 1. If, however, song length is determined by some global tempo mechanism, then the positive covariance among intervals will increase the variance of the entire song, causing g to be >1. In the 12 birds in our sample, we found gross covariance ranging from 1.16 to 6.55. These values were significantly >1 in 11 of these birds (p < 0.05, χ2 test) and approached significance in the 12th. Note that measurement error in determining syllable onsets and offsets will suppress gross covariance by artificially increasing interval variances but have a minor effect on sequence variance. Overall, our data indicate that changes in sequence length are dominated by global tempo rather than an accumulation of local effects (cf. Chi and Margoliash, 2001).
Repeated motifs slow down
Our data are consistent with previous work demonstrating that motifs tend to slow down over the course of a song (Chi and Margoliash, 2001). In 9 of the 10 birds having consistent motifs, the second motif was longer by 5.9 ± 4.4 ms (range of 0.04–12.7 ms) or 0.82 ± 0.49% (range of 0.00–1.49%). In the one bird (bird 8) with a shorter second motif, the difference of –13 ms was entirely attributable to variation in the amplitude structure of the first syllable, leading to a different choice for the onset peak of this syllable in the first versus subsequent motifs. In the five birds with at least three motifs (excluding bird 8), the third motif was longer than the second (range of 1.2–3.7 ms). In four of these five birds, the difference between motifs two and three was smaller than between motifs one and two (range of 35–67% of the difference between the first two motifs); in the fifth bird, the difference between motifs two and three was actually 2.3 times greater. In all five of these birds, the gap between motifs two and three was longer than the gap between motifs one and two.
Tempo change correlates with behavioral factors
A number of studies suggest that singing behavior and song tempo may be affected by factors such as the presence of a female, hormone levels, and circadian rhythm (Ollason and Slater, 1973; Sossinka and Bohner, 1980; Zann, 1996; Deregnaucourt et al., 2005; Jansen et al., 2005). To explore these factors, we examined the relationship between sequence length, acoustic activity, and time of day. Acoustic activity was assessed as the average number of recordings per minute on that bird's side of the cage in a 30 min window centered on each sampled song. This measure is dominated by song production, but an undetermined number (∼30%) of these recordings consisted of non-song sounds such as wing flaps and repeated calls. We report time of day as hours from light onset (birds were housed on a 14/10 light/dark cycle).
Average song length was shortest at hour 4 (late morning) and gradually increased until hour 11 (late afternoon); decreases in length until hour 4 were significant for seven birds, whereas increases between hours 4 and 11 were significant for 10 birds (Pearson's correlation, p < 0.05) (Fig. 4). Acoustic activity tended to decline steadily over the day beginning at hour 5 (approximately noon) (Ollason and Slater, 1973). The decline was significant for 8 of the 12 birds (Pearson's correlation, p < 0.05) (Fig. 4). As suggested by these results, songs tended to be faster when activity rates were higher, a relationship that was statistically significant for 8 of the 12 birds (p < 0.05). Thus, it is possible that at least some of the tempo changes were attributable to general arousal state that in turn varied over the course of the day.
Figure 4.

Behavioral factors and song tempo. A, C, E, Means and SEs across birds. B, D, F, Pearson's coefficients by bird for each relationship indicated directly to the left. Pearson's marked * are significant with p < 0.05. A, Song tempo by time of day in hourly bins. B, Strength of tendency for songs to speed up in the first 4 h after lights on (white bars) and slow down between hours 5 and 11 (black bars). C, Acoustic activity by hour of day. D, Tendency for activity to decrease over the afternoon beginning at hour 6. Acoustic activity was defined as the number of recordings per min in a 30 min window centered on each song. E, F, The relationship between sequence length deviation and acoustic activity binned in integers. Song tempo changes systematically during the course of the day and may be influenced by factors correlated with overall arousal.
Scaling of syllable and gap length with tempo
In the music box model, tempo changes are most easily accomplished by simply changing the speed of the underlying clock-like mechanism. Such a model predicts that song intervals should exhibit proportional scaling, i.e., they should stretch and compress the same amount per unit time as the entire sequence (Gentner, 1987; Rhodes et al., 2004). We examined whether zebra finch songs showed proportional scaling by performing a linear regression of each interval with overall sequence length (the slope of the regression line is known as the β coefficient). We normalized the coefficients so they reflect how much interval length stretched relative to the length of the entire sequence (see Materials and Methods). From this perspective, we will refer to the normalized coefficient as the elasticity of an interval. If β > 1, then the interval stretches and compresses relatively more than the overall sequence, if β < 1, it is relatively inelastic, and if β = 0, then the interval length is unrelated to the tempo. If song length is dominated by variability in the length of a few very elastic intervals, these intervals will have β values >1, whereas all the other song segments will tend to have coefficients <1. In the two birds in which the first and second motifs had different syllable sequences (4 and 32), the intermotif gap was very elastic. This suggests that other measurements based on a presumptive global tempo may be misleading in these birds, so we restricted the rest of the elasticity analysis to the 10 remaining birds. Examination of the excluded data did not indicate significant differences from most of the other patterns presented.
Proportional scaling does not hold
Proportional scaling would imply that all intervals have the same elasticity and all β coefficients are equal to 1. Of all intervals analyzed, 60% of the corresponding coefficients differed significantly from the hypothesis of proportional scaling (two-tailed t test, p < 0.05; see Materials and Methods). Therefore, our data strongly indicate that variability in song length is expressed unevenly across the course of the song, with some intervals being more elastic than others. This contradicts the simplest versions of the music box model in which song length is governed by the speed of a single underlying clock.
Breaking down the data by interval type, we found that elasticity coefficients for syllables was significantly smaller than for gaps (p < 0.0001) (Fig. 5). (Significance tests regarding distributions of elasticity coefficients used nonparametric Wilcoxon's tests; see Materials and Methods.) Seventy percent of syllables had coefficients <1 (mean of 0.921 ± .031), whereas 75% of gaps had coefficients >1 (mean of 1.169 ± .041) (Fig. 5). β coefficients for syllables were smaller than for gaps in 7 of the 10 birds analyzed, and this reached significance in six of these birds (p < 0.025). One bird (58) actually showed syllables to be significantly more elastic than gaps (p < 0.025).
Figure 5.

Elasticity by interval type. The elasticity coefficient measures the fractional change in interval length relative to the changes in sequence length. Syllables (black) are significantly less elastic than gaps (white). This violates the proportional scaling predicted by a simple music box model of song production.
Figure 6 shows the sequences of β coefficients for all birds in the sample, shown in order of decreasing gross covariance. Birds with greater gross covariance tended to show a stronger alternating pattern of coefficients, with greater elasticity among gaps than syllables. Moreover, the data in many birds appeared to show an identifiable pattern that was preserved across motifs.
Figure 6.

Elasticity by bird. Titles indicate bird, gross covariance (g), sample size, and mean sequence length. Plots are sorted by g. Error bars show 95% confidence intervals for the sequence length regression. Coefficients are spaced along the x-axis according to mean interval lengths and onset times (syllables are demarcated with black bars).
Motif boundaries are more elastic and more variable
We also noticed that intermotif gaps and the beginning syllables of motifs (we will call them “syllable A”) tend to have especially high elasticity (Fig. 7). The coefficients for syllable A were significantly greater than those for other syllables (means are 1.122 ± 0.098 and 0.854 ± 0.020; p < 0.01), whereas the difference between intermotif gaps and other gaps was nearly significant (means are 1.381 ± 0.094 and 1.129 ± 0.045; p = 0.064). The elasticity of syllable A was not significantly different from within-motif gaps (p = 0.511).
Figure 7.

Elasticity for intervals at motif boundaries.A, Distributions of elasticity coefficients for syllables that start a song motif (syllable A; white) and other syllables (black). B, Distributions for gaps falling between motifs (white) and other gaps (black). Intervals at motif boundaries are more elastic.
In addition to being more elastic, intermotif gaps and syllable A tended to be more variable than other respective intervals of the same type. To reduce confounds based on overall interval length, we only considered intervals between 50 and 80 ms long. This range avoided consideration of very small intervals, which are likely to be dominated by measurement noise, and longer intervals that contained very few syllable As. The resulting sample contained slightly more than one-third of all syllable As (n = 11) and three-quarters of intermotif gaps (n = 13). Within this range, the distribution of CVs for syllable A was greater than for other syllables (means of 4.993 ± 0.561%, n = 11 versus 2.950 ± 0.002%; p < 0.005) and similarly for intermotif gaps versus other gaps (means of 4.947 ± 0.468%, n = 13 versus 3.588 ± 0.190%; p < 0.025).
Other determinants of elasticity were not found
We searched for other factors that might explain the differing degree of elasticity across intervals. These included interval length, interval variability, and syllable acoustic structure. No significant trends were found (supplementary data, available at www.jneurosci.org as supplemental material).
Covariance structure follows syllable/gap distinction
The fact that elasticity coefficients separate out by interval type suggests that intervals of the same type have some shared representation. However, the data cannot distinguish between two scenarios that we call the “independent” and “grouped” scenarios. In the independent scenario, song tempo is the only factor driving changes in interval lengths, whereas in the grouped scenario, there are rich representations shared by intervals of the same type. Under the grouped scenario, one expects syllable lengths to covary independently of global tempo. To focus on this independent component of variance, we examined the residual values obtained from subtracting off the linear regression with sequence length. We then computed all pairwise correlations among these residual values and sorted these pairs into three categories: gap–gap, syllable–syllable (syl–syl), and nonadjacent syllables and gaps (syl–gap). Adjacent syl–gap pairs were omitted because of possible confounds attributable to measurement error: any error in determining the boundary between adjacent intervals makes the measured length of one interval shorter and the other longer and contributes a negative correlation to adjacent intervals.
The three distributions of residual correlation coefficients are shown in Figure 8. We found positive correlations among most intervals of the same type: 75% of all syl–syl and 81% of gap–gap correlations were positive (means are 0.093 ± 0.005 and 0.111 ± 0.006). In contrast, 89% of nonadjacent syl–gap correlations were negative (mean of –0.123 ± 0.003). Within-type correlations were significantly larger than syl–gap correlations (p < 0.0001). This relationship was quite reliable, holding for all 10 birds on an individual level (p < 0.005; significance tests regarding distributions of correlation coefficients used nonparametric Wilcoxon's tests; see Materials and Methods). Thus, our data strongly indicate that syllables and gaps are grouped by properties affecting interval length in addition to the factors that determine elasticity.
Figure 8.

Pairwise correlations among and between syllables and gaps. Distributions of the correlation coefficient for all pairs containing two syllables (A), two gaps (B), or a syllable and a gap(C). To remove the effects of song tempo, correlations were calculated between the residual values of regression of interval length versus total sequence length. Directly adjacent syl–gap pairs were omitted because measurement jitter in the boundary between the pair will induce negative correlations. Stronger within-type versus between-type correlations suggest shared neural mechanisms in addition to the differential dependence on song tempo shown in Figure 5.
Local temporal structure
Our analysis thus far has focused on syllables and gaps as groups. Although there may be mechanistic representations specific to interval types as a whole, there might also be more specific temporal structure within song. We looked for three basic kinds of local structure: relationships between the syllables and gaps of the same identity across motifs, which we call “identity dependence”; between intervals as a function of separation in sequence position, or “distance dependence”; and temporal structure delineated across syllable onsets, i.e., inter-onset intervals.
Elasticity and correlation structure is identity dependent
If unique intervals have specific representations, then one might expect a similar degree of elasticity in all intervals of that identity produced across motifs (for physiological evidence that the same activity patterns underlie the production of repeated motifs, see Yu and Margoliash, 1996; Hahnloser et al., 2002; Leonardo and Fee, 2005). Indeed, we found that β coefficients were significantly closer between intervals of the same identity than between any two coefficients of the same type but different identity (p < 0.0005 for both syllables and gaps) (Fig. 9). Mean absolute differences were 0.238 ± 0.037 among same-identity syllable pairs and 0.330 ± 0.014 for syllable pairs with different identities. The corresponding values among gaps were 0.262 ± 0.025 and 0.415 ± 0.017. These differences did not reach statistical significance in any individual bird, however, probably attributable to the small number of same-identity pairs.
Figure 9.

Intervals of the same identity are linked. Distributions of pairwise differences between elasticity coefficients (A, C) and pairwise Pearson's coefficients (B, D) for syllables (A, B) and gaps (C, D). Black, Pairs containing intervals of the same identity (i.d.) (e.g., syllable D in motifs 1 and 3, gap between B and C in motifs 2 and 3). White, Pairs containing intervals of the same type (syl–syl or gap–gap) but different identity.
We also examined whether syllable and gap residuals of the same identity were more correlated than they were with other intervals of the same type (Fig. 9). In fact, lengths in same-identity syllable pairs were more strongly correlated than in differentidentity syllable pairs, with 95% of same-identity syllable pairs having positive correlation (mean for same identity was 0.239 ± .013; mean for different identity, 0.056 ± 0.005; p < 0.0001). The same-identity gap correlations were 99% positive and significantly stronger than different-identity gap pairs (same identity is 0.224 ± 0.016; different identity is 0.089 ± 0.006; p < 0.0001). Because we found no difference in the strength of this effect for syllable A and for intermotif gaps, these numbers include all intervals. The same-identity correlations were stronger than other within-type correlations in all 10 birds, but this difference did not reach statistical significance (p > 0.05) for syllables in one bird (38) and for gaps in two birds (10 and 20).
Two birds (8 and 12) sang repeated syllables. Overall, correlations between syllables of the same identity but in different motif position were significantly stronger than correlations among syllables of different identities (p < 0.0001). Although this suggests that the increased correlation between same-identity syllables was not simply attributable to being in the same location within each motif, the sample is too small to make strong conclusions (cf. Leonardo and Fee, 2005).
Identity dependence among gaps is independent of syllables
Although identity dependence was shown for both syllables and gaps, it is possible that the only direct linkage is between same-identity syllables; gap correlations could follow as a consequence. For example, a correlation between gap BC in motifs 1 and 2 could be attributable to correlated length changes in syllable B and syllable C across the same motifs. To control for such possibilities, we calculated pairwise correlations between gaps after subtracting off the influence of syllable length as well as sequence length. Specifically, we performed a multiple regression of each gap with sequence length and the length of each individual syllable in the sequence, and we calculated the correlation coefficient between the residual values for all pairs of gaps. Although one would expect the adjacent syllables to create the largest confound, all syllables were included in the regression to eliminate any contribution from syllable length. Among gaps of the same identity, 70% of these correlations were positive (mean of 0.074 ± 0.014). In contrast, 80% of correlations among gaps of different identity were negative (mean of –0.105 ± 0.006), and the two distributions were significantly different (p < 0.0001). Thus, the data do indicate that gaps of the same identity are more correlated than gaps of different identity, and this relationship is not simply a byproduct of the relationships among syllables.
Distance-dependent correlations
We also considered positional distance in the sequence as a possible factor affecting the correlation between intervals. For birds with short motifs, distance in the sequence can become confounded with syllable identity and motif position at relatively short distances; for example, in the sequence ABCABC, syllable A in motif 1 could be more correlated with syllable B in motif 2 than C in motif 1 attributable to possible transitive correlations with syllable A in motif 2. Therefore, we confined our analysis to the six birds that sang at least four syllables per motif. For each syllable that did not begin or end the sequence, we computed pairwise correlations with all other syllables in the motif that were not repeated and compared the strength of correlations one position away with two positions away. We considered shared dependence on tempo to be a viable factor behind any such effect, so we looked at both raw and residual Pearson's coefficients.
Across birds, adjacent syllables had significantly stronger raw correlations than syllables two positions away (mean difference of 0.041 ± 0.020; p < 0.05). However, there was significant interbird variability, with stronger correlations for adjacent syllables found in four of six birds, only two of which show significance (2, 8, 12, and 14; 8 and 12 significant, p < 0.05). In two birds (20 and 58), adjacent syllable correlations are actually weaker on average than the more distant correlations. There was also a trend in the correlations among residuals, but this did not reach significance (mean difference of 0.022 ± 0.019; p = 0.24). Thus, if there is distance dependence in the correlation structure, it may be related to systematic patterns of elasticity that span several intervals.
Syllable onsets are especially aligned to global tempo
We also looked for structure that might indicate something about how syllable onsets and offsets are coded. The simplest possibility is that a central tempo mechanism “triggers” syllable readout at times corresponding to syllable onsets. The syllable is then produced at a rate that is influenced by independent variability within the syllable mechanism as well as song tempo. If the production of a syllable does not influence the onset of the next syllable, any fluctuations in syllable length will come at the expense of the gap following that syllable, making the correlation between those two intervals more negative.
To look for these relationships, we started by making a direct comparison of the strength of the negative correlation expected between a syllable and gap making up an inter-onset interval and a syllable and gap making up an inter-offset interval. We made the comparison for pairs that shared the same gap, because all gaps in a sequence have both a preceding and a subsequent interval (which is not true for the first and last syllable in a sequence). The mean difference between the correlations for the inter-onset pairing and the inter-offset pairing was significantly different from 0 (p < 0.0005), with 73% of gaps showing a stronger anti-correlation in the inter-onset pairing (mean difference in Pearson's correlation, r = 0.145 ± 0.025). However, recall that measurement error is expected to make a significant negative contribution to the correlation between adjacent intervals. Thus, the above correlations may simply reflect a tendency for greater measurement error at syllable offsets than at onsets.
To circumvent this problem, we returned our focus to the elasticity calculations. Because overall sequence length is nearly unaffected by measurement error (except for the first syllable onset and last syllable offset), β coefficients should also be independent of such measurement jitter. We again looked at the tradeoff between the syllable length and gap length, but for length differences attributable to differential elasticity. One can show that the elasticity coefficient for any interval formed by combining a syllable and gap is given by βs+g = csβs + cgβg, where the subscripts s and g denote syllable and gap, and c is the ratio of the mean length of each interval to the mean sum of both interval lengths (see Materials and Methods). We looked at the tradeoff between syllable and gap length by plotting csβs versus cgβg for three different pairings of syllables and gaps: syl–gap pairs making up an inter-onset interval, syl–gap pairs making up an inter-offset interval, and gaps paired with a random syllable in the sequence (Fig. 10). If syllable and gap elasticity exactly trade off in length, then the elasticity coefficient for the pair βs+g = csβs + cgβg should be exactly equal to 1 (Fig. 10, dashed line).
Figure 10.

Tradeoffs in elasticity coefficients for different syllable–gap pairings. The summed length of a syllable (s) and a gap (g) has elasticity given by βs+g = csβs + cgβg, where cs and cg are relative lengths of each interval in the pair (see Materials and Methods). Plots show gap (cgβg) and syllable (csβs) components along x- and y-axes, respectively. A, Inter-onset pairs (gap and preceding syllable). B, Inter-offset pair (gap and after syllable). C, Gaps paired with random syllable. Tighter clustering around the βs+g = 1 line (dashed) for the inter-onset pairings suggests that elasticity in a syllable comes at the expense of the subsequent gap, i.e., syllable onsets are more closely tied to tempo than syllable offsets. The negative slope for random pairings is attributable to the fact that cs + cg = 1.
To quantify how closely the data cluster around this prediction, we computed the mean absolute deviation from βs+g = 1. The mean deviation for inter-onset pairs was 0.108 ± 0.012, which was significantly smaller than the mean deviations for the latter two groups (p < 0.005). The mean deviations for inter-offset pairings were not significantly different than for random pairings (p = 0.262; means for inter-offset pairs was 0.142 ± 0.013 and was 0.167 ± 0.015 for random pairings). Inter-onset deviations from 1 were smaller than those for inter-offset intervals in 9 of 10 birds (exception is bird 8) and smaller than those for randomly paired gaps and syllables for 8 of 10 birds (exceptions are birds 8 and 10).
Effect sizes
We have presented several factors that influence the lengths of intervals in zebra finches singing undirected song. To get a sense for the size of these influences, we performed for each interval a stepwise multiple regression with (1) sequence length alone, (2) sequence length and the sum of all intervals of the same type but different identity (“type sums”), (3) sequence length, type sums, and the sum of all intervals of the same identity, and (4) all previous factors and the sum of adjacent intervals. Intermotif gaps were excluded because there were no other intervals of the same identity in the sequences with only two motifs. Across intervals, sequence length explained 24.4 ± 1.2% of variance. Factoring in the sum of all intervals of the same type but different identity explains an additional 5.8 ± 0.4%, the sum of all intervals of the same identity explains an additional 3.5 ± 0.2%, and adjacent intervals explains an additional 17.8 ± 0.8%. This makes for a total of 51.5 ± 1.1% of interval variances explained by the factors analyzed here. (The relatively large amount of variance explained by adjacent intervals is likely attributable to the fact that the errors in measuring syllable boundaries result in correlated length changes on either side of the boundary.)
Temporal structure of female-directed songs
It has been reported previously that directed song, in which a male sings toward a female as a form of courtship, tends to be faster and shows different physiology (Sossinka and Bohner, 1980; Hessler and Doupe, 1999). To determine whether singing to a female altered the temporal structure of song, we examined directed songs from a subsample of four males (see Materials and Methods). Consistent with previous reports, we found that directed songs tended to be faster than undirected songs. In the four birds analyzed (birds 8, 10, 12, and 14), mean sequence length was shorter than undirected song by 16, 71, 7, and 48 ms respectively, or ∼0.8, 3.8, 0.4, and 3.0%. Songs were produced between 11:30 A.M. and 4:30 P.M., so it is unlikely that time of day introduced these differences (if anything, it may have muted them because undirected songs slowed down over the afternoon).
To determine whether singing to a female had a substantial effect on the fine-grained temporal structure of song, we compared grouped statistics regarding the elasticity and correlation structure of intervals broken down into syllable and gap categories. Overall, elasticity patterns were similar to what we found with undirected songs. Of the 98 intervals analyzed, 65% had β coefficients significantly different from 1, and syllables were significantly less elastic than gaps (means are 0.603 ± 0.080 and 1.600 ± 0.090; p < 0.0001). Given our small sample of birds, we did not test the motif boundary effect. We also found the same basic covariance structure among the directed songs. The correlation coefficient between residuals remaining after subtracting out the influence of tempo was positive within interval types and negative between types (syl–syl mean, 0.073 ± 0.012; gap–gap mean, 0.093 ± 0.012; nonadjacent syl–gap mean, –0.102 ± 0.009; p < 0.0001). Finally, all local structure reported for undirected songs was also found among directed songs.
We attempted an interval-by-interval comparison to determine whether directed songs are simply sped up versions of undirected songs with the same individual temporal structure. Although song spectrograms allowed for an easy identification of the same syllable in directed and undirected songs, approximately half of the scatter plots of sequence length versus interval length for directed songs fell substantially outside what would be extrapolated from the undirected data (determined by visual inspection). Closer examination revealed that many syllables showed differences in the shape of the amplitude envelope that precluded an unambiguous matching of syllable onsets and offsets in directed and undirected versions of the song. Because of these complications, determining possible pairwise differences in the fine-grained temporal structure of directed and undirected songs of individual birds will require a more extensive analysis that is beyond the scope of this study.
Discussion
We have exploited the remarkable stereotypy of zebra finch song to analyze the temporal structure of repeated syllable sequences. For practical reasons, we did not address subsyllabic temporal structure and focused exclusively on the first several motifs sung by birds housed alone or in the presence of other males. The ability to collect hundreds of songs and analyze them with high precision allows us to distinguish temporal variations on the millisecond timescale. Our results indicate that song length is highly stable under these conditions, with a majority of deviations <1.5%. Measurement of the gross covariance of song intervals indicates that changes in song length are dominated by global influences that differ from song to song rather than an accumulation of local jitter during song production. This is consistent with our demonstration that song length is correlated with the time of day, as well as with previous data showing a continuous “drift” in song production across repeated recordings (Chi and Margoliash, 2001).
We also investigated how the lengths of individual intervals correlate with these global tempo changes. We find that syllables tend to stretch and compress with tempo changes less than gaps. Additional song-to-song variability is shared by intervals of a given type, so that syllable–syllable and gap–gap correlations are stronger than syllable–gap correlations. Overall, these data suggest that (1) interval length correlations are induced by mechanisms that span the entire song, and (2) syllable and gap lengths are driven by distinct components within the song circuit.
More detailed analysis reveals additional structure at the local level. It appears that syllable length has a stronger tradeoff with the length of the subsequent rather than preceding gap, suggesting that onsets represent the preferred alignment of syllables with overall song tempo. Also, syllables of the same identity sung in different motifs show stronger correlations than other syllable pairs, consistent with physiological data showing that they are supported by similar patterns of neural activity (Yu and Margoliash, 1996; Leonardo and Fee, 2005).
Models of song production
We discuss our results in the context of three basic models for song production (Fig. 11). Although elements of all three models are likely to play a role, we discuss pure forms of each model for conceptual clarity. The first is the music box model in which song is driven by an underlying clock-like mechanism (Fee et al., 2004). The second is a “chain model” in which syllables and gaps are subserved by separate neural mechanisms and serially linked together in a chain. Song tempo is the byproduct of temporal fluctuations along the chain. Third is the “tempo and syllable model” in which syllables are integrated within a global temporal structure for song. In this scenario, gaps are simply the time left over between syllables.
Figure 11.

Functional elements possibly contributing to temporal structure. “Tempo” represents a pattern generator that drives song, either continuously across the entire song or at particular points such as syllable onsets (thicker arrows). “Syllable” and “Gap” boxes represent mechanisms that control the temporal structure of the corresponding units of song. Superscripts indicate participation of these mechanisms in three basic models of song production. MB, Music box model. A clock-like drum triggers the production of acoustic output on a fine time-scale. The song is not decomposed into syllable or gap-based units. CH, Chaining model. Temporal structure results from a chaining of syllables and gaps. Song length is a consequence of the combined action of the syllable and gap mechanisms. TS, Tempo and syllable model. A tempo mechanism determines the overall rate of song production and triggers the action of a mechanism that produces syllables as units of song. Gaps are simply the intervals left over between syllables.
The main prediction of the music box model is that changes in song tempo lead to a proportional temporal scaling of song elements. Our analysis clearly shows that proportional scaling does not hold for zebra finch song, contradicting the simplest forms of this model. Furthermore, the distinction between syllables and gaps in the correlation structure suggests the presence of neural mechanisms specifically dedicated to the production of song syllables.
The other two models both presume the existence of syllable-based units but differ in whether gaps are units of song or simply left over from the interplay between syllable length and song tempo. One piece of evidence suggesting that gaps may be left over from tempo and syllable interactions is the anticorrelation in elasticity between syllable-gap pairs making up inter-onset intervals (Fig. 10). Conversely, the relative inelasticity of syllables could be explained by the chaining model if this elasticity induces an active compensation in the subsequent gap length so that inter-onset intervals scale nearly proportionally with song length. There is actually a fundamental limitation in distinguishing these models in our analysis: song length is determined by the sum of syllable lengths and gap lengths. Given this mathematical relationship, any temporal structure can be explained by any two of syllable length, gap length and song tempo. Whatever the structure of the pattern generator for song, gaps must have some form of representation in the system because they correspond to activation of motor neurons driving inspiration (Wild et al., 1998; Suthers and Margoliash, 2002; Goller and Cooper, 2004).
Locus of hierarchical representations
Hahnloser et al. (2002) have shown that song activity is driven by regular, clock-like bursting from HVC(RA) neurons. However, our behavioral data demonstrate that syllables and gaps scale differently with changes in song tempo, and that variations in syllable and gap lengths are correlated with other intervals of the same type. How can these two sets of data be reconciled?
One possibility is that the bursting of HVC(RA) neurons does not act like the ticking of a single clock but rather as a series of bursts grouped into functional units. There are a number of candidate mechanisms within HVC that may subserve this grouping. For example, previous recordings within HVC showed modulations in firing rate that were tied to individual syllables and repeated by motif (Yu and Margoliash, 1996). Subsequent recordings suggest that this activity was most likely attributable to the spiking of inhibitory interneurons within HVC (Hahnloser et al., 2002; Fee et al., 2004). It is possible that these interneurons, via their projections onto HVC(RA) neurons (Mooney and Prather, 2005), serve to organize the HVC(RA) activity into functional groups. This proposal is supported by evidence from brain slice recordings showing that transient pulses delivered to HVC can induce inhibition-dependent rhythmic bursting whose timing approximately matches the rate of syllable production (Solis and Perkel, 2005).
Temporal grouping of activity might also be driven by afferent input to HVC. Bilateral HVC recordings show brief periods during each motif in which multiunit activity becomes synchronized across hemispheres (Schmidt, 2003). Because there are no interhemispheric connections in the avian forebrain, this synchronization must be induced by HVC afferents. Synchronization preferentially occurs at syllable onsets, consistent with our data that intervals may be grouped into inter-onset pairs. This view of HVC is consistent with data from the afferent nucleus uvaeformis of the thalamus (Williams and Vicario, 1993; Coleman and Vu, 2005).
Alternative hypotheses also exist. Bursting in HVC(RA) neurons could scale proportionally, whereas downstream mechanisms lead to the production of syllable-based units. One possibility is that output from an HVC clock encounters syllable-based representations within the premotor nucleus RA (or subsyllabic representations) (see Yu and Margoliash, 1996). Like HVC, RA has a rich network of inhibitory interneurons, and these may give RA dynamic properties distinct from its HVC input (Spiro et al., 1999; Abarbanel et al., 2004).
Syllable-based representations could also be induced by afferent input to RA from the lateral magnocellular nucleus of the anterior nidopallium (LMAN), the output nucleus of an indirect pathway connecting HVC to RA that passes through the avian basal ganglia (Fig. 1). Spike timing is highly correlated across HVC, RA, and LMAN (Kimpo et al., 2003), and a requirement for synchronous arrival of LMAN and direct HVC(RA) input could lead to inelasticity of activity within RA. Moreover, this pathway has been implicated in syllable sequencing in Bengalese finches (Kobayashi et al., 2001), consistent with the proposed role of the basal ganglia in sequential behaviors (Hikosaka et al., 2002; Aldridge et al., 2004; Fujii and Graybiel, 2005).
The departure from proportional scaling could also occur when clock-like activity in RA projection neurons interacts with the brainstem premotor nuclei for song production. These nuclei have a complex network of interconnections (Wild et al., 1997; Sturdy et al., 2003) and are responsible for the production of the discrete unlearned vocalizations known as calls (Simpson and Vicario, 1990). It may be here that song is organized into discrete motor gestures at the syllable or subsyllable level.
Finally, it is possible that proportional scaling holds as far as the motor neurons driving the syrinx and respiratory muscles but physical constraints at the periphery lead to differential scaling of syllable lengths with song tempo. There are several reasons that this is unlikely to explain our data. First, although it is easy to imagine how peripheral dynamics might constrain syllables to show smaller changes than the overall song (β < 1), a number of syllables show changes in length that are proportionally greater than changes in tempo. Second, for several syllables, β > 1 in the first motif and β < 1 in later motifs (Fig. 6). Finally, in our cursory analysis of acoustic structure, we found no obvious differences in elasticity by syllable subtype (supplemental data, available at www.jneurosci.org as supplemental material).
Evolution of vocal behavior
It has been proposed that learned song evolved as birds became able to aggregate series of unlearned calls into organized sequences (Zann, 1993). Both the ability to learn from a song model and the ability to coordinate and elaborate a series of calls is likely to have required the involvement of complex and flexible sensorimotor circuits in the forebrain (Simpson and Vicario, 1990). This hypothesis is similar to suggestions that human speech evolved as complex cortical circuits built on brainstem circuits gave rise to coordinated movements of the tongue, jaw, and diaphragm (MacNeilage, 1998). Under these hypotheses, motor representations at the level of the forebrain would then evolve under the competing constraints of constructing global representations for vocal sequences and coordinating the production of the elements that constitute these sequences. Given these constraints, it may not be surprising to find a mixture of both global and local representational schemes within the forebrain circuits for complex vocal behavior.
Appendix A: sequence template-matching algorithm
Following are the details of the template-matching algorithm we used to identify target sequences in a given recording from the undirected sample. Individual syllable–template matching is described in Materials and Methods.
The main difficulty in sequence identification was false positives from syllable-by-syllable matches, so the algorithm started with the syllable that had the least number of matches. The location of these candidate syllables were defined as “anchors” for determining candidate motifs. From each anchor, a candidate motif was determined by serially moving forward/backward and looking for the appropriate next/previous syllable with the appropriate timing. The forward-searching routine was defined as follows: given that syllable n has just been found, look for a match to syllable n + 1 starting in a time window from t1 to t2, where t1 = onset(n) + 0.6 × length(n), and t2 = onset(n + 1) + 31 ms. In this way, two syllable matches could overlap by no more than 40% of the length of the first template, and an inter-onset interval could deviate positively from the motif template by a maximum of 31 ms. This upper bound was determined in a previous analysis of syllable onset deviations using a similar template-matching algorithm. The backward-searching routine was a mirror image of the forward search. Both routines were looped until the boundaries of the sequence template were reached. If at any stage the algorithm failed to find a candidate match for the appropriate syllable, that motif was deemed not to match the template and was not included in additional analysis. In the two birds with non-identical motif structure, the entire song was treated as a single motif.
If any candidate motifs overlapped, the one with the highest average template match was chosen; this step was based on the assumption that an overlap would indicate that at least one of the matches was a false positive. If the gap between two identified motifs deviated positively by >25 ms, they were partitioned into separate sequences; otherwise, they were counted as part of the same sequence. For example, if in the same recording a bird produced a series of motifs, paused for a period of time, and produced a second series, each series was counted as a different sequence. On average, ∼1.1–1.2 separate target sequences per recording were identified; however, in one bird, this ratio was closer to 2 because most sequences were separated by a variable number of call-like notes not defined in the sequence template.
Appendix B: dynamic time-warping algorithm
Following is the DTW we developed for the fine-grained measurements of syllable onsets and offsets. Both templates and actual waveforms were truncated to include only data from the beginning of the first peak to the end of the last peak. Peak beginnings and endings were defined as inflection points in the waveform on either side of the peak. To minimize discrepancies in the lengths of templates and waveforms to be matched, endpoint peaks used in the template were the very first and last and not necessarily the ones chosen based on height and regularity to define onsets and offsets.
Details of the DTW process are as follows (Rabiner and Juang, 1993). Paths were globally constrained by a Sakoe-Chiba band defined by the midpoints of each time axis. Thus, total length change was limited to fall between 1/2 and 2. Pathways were locally confined to the following:
 |
Hence a local length change was limited to fall between 2/3 and 3/2. Path sets were weighted by [2, 3, 2], which amounts to a slight bias away from a slope of 1, so the cumulative product matrix D was computed as follows:
 |
where d was the outer product, i was the template index, and j was the syllable index.
Endpoint constraints were relaxed because the correspondence between syllable and template boundaries was itself an object of this DTW. The default region in which the path could end in time was delimited by the last 25% of the time axis for either the template or the candidate waveform. This was stretched accordingly if either length exceeded the other by >25%.
The onset and offset of each syllable was determined by finding the point on the syllable time axis corresponding to the onset and offset times originally defined on the template time axis.
Appendix C: qualitative model of tempo changes
We qualitatively analyzed the relationship between interval variances and sequence length variance using a simple model set to match the variance of overall sequence length σ2 and the mean length of the intervals in the sequence, x̄1, x̄2,..., x̄m. The model was constructed so that, by changing a single parameter, we could consider the case in which intervals are independent and the case in which the gross covariance measure g matches the experimental data, i.e., interval length changes are dominated by changes in tempo. In both versions of the model, the SD of all intervals was proportional to mean interval length. The length of each interval was given by the following:
 |
where ηi and η0 are 0-mean independent Gaussian variables with SD equal to 1 (η0 is the common variation shared by all intervals), the parameter α controls the overall variance, and γ controls the degree of independence in the different intervals. Overall sequence length variance is given by
 |
whereas gross covariance is given by
 |
To obtain independent intervals, γ and g were set equal to 1 and α was solved for, whereas for the model with tempo changes, g was set equal to the gross covariance of the bird being analyzed and both α and γ were obtained from the two equations above. The model contains a number of assumptions regarding the nature of interval length variability and so did not form the basis for any of the statistical conclusions reported.
Footnotes
The work was partially supported by National Institutes of Health Grant 5R21MH 066047-02 and a Sloan Research Fellowship (T.W.T.). We thank Joanna Pressley, Beth Goldman, and Dr. Michael Brainard for helpful comments.
Correspondence should be addressed to Christopher M. Glaze, 1147 Biology/Psychology Building, University of Maryland, College Park, MD 20742. E-mail: c_m_glaze@yahoo.com.
DOI:10.1523/JNEUROSCI.3387-05.2006
Copyright © 2006 Society for Neuroscience 0270-6474/06/260991-15$15.00/0
References
- Abarbanel HD, Gibb L, Mindlin GB, Rabinovich MI, Talathi S (2004) Spike timing and synaptic plasticity in the premotor pathway of birdsong. Biol Cybern 91: 159–167. [DOI] [PubMed] [Google Scholar]
- Aldridge JW, Berridge KC, Rosen AR (2004) Basal ganglia neural mechanisms of natural movement sequences. Can J Physiol Pharmacol 82: 732–739. [DOI] [PubMed] [Google Scholar]
- Anderson SE, Dave AS, Margoliash D (1996) Template-based automatic recognition of birdsong syllables from continuous recordings. J Acoust Soc Am 100: 1209–1219. [DOI] [PubMed] [Google Scholar]
- Chi Z, Margoliash D (2001) Temporal precision and temporal drift in brain and behavior of zebra finch song. Neuron 32: 899–910. [DOI] [PubMed] [Google Scholar]
- Coleman M, Vu E (2005) Recovery of impaired songs following unilateral but not bilateral lesions of nucleus uvaeformis of adult zebra finches. J Neurobiol 63: 70–89. [DOI] [PubMed] [Google Scholar]
- Cynx J (1990) Experimental determination of a unit of song production in the zebra finch (Taeniopygia guttata). J Comp Psychol 104: 3–10. [DOI] [PubMed] [Google Scholar]
- de Jong KJ (2001) Effects of syllable affiliation and consonant voicing on temporal adjustment in a repetitive speech-production task. J Speech Lang Hear Res 44: 826–840. [DOI] [PubMed] [Google Scholar]
- Deregnaucourt S, Mitra PP, Feher O, Pytte C, Tchernichovski O (2005) How sleep affects the developmental learning of bird song. Nature 433: 710–716. [DOI] [PubMed] [Google Scholar]
- Fee MS, Kozhevnikov AA, Hahnloser RH (2004) Neural mechanisms of vocal sequence generation in the songbird. Ann NY Acad Sci 1016: 153–170. [DOI] [PubMed] [Google Scholar]
- Franz M, Goller F (2002) Respiratory units of motor production and song imitation in the zebra finch. J Neurobiol 51: 129–141. [DOI] [PubMed] [Google Scholar]
- Fujii N, Graybiel AM (2005) Time-varying covariance of neural activities recorded in striatum and frontal cortex as monkeys perform sequential-saccade tasks. Proc Natl Acad Sci USA 102: 9032–9037. [DOI] [PMC free article] [PubMed] [Google Scholar]
- Gentner DR (1987) Timing of skilled motor performance: tests of the proportional duration model. Psychol Rev 94: 255–276. [Google Scholar]
- Goller F, Cooper BG (2004) Peripheral motor dynamics of song production in the zebra finch. Ann NY Acad Sci 1016: 130–152. [DOI] [PubMed] [Google Scholar]
- Hahnloser RH, Kozhevnikov AA, Fee MS (2002) An ultra-sparse code underlies the generation of neural sequences in a songbird. Nature 419: 65–70. [DOI] [PubMed] [Google Scholar]
- Hessler NA, Doupe AJ (1999) Social context modulates singing-related neural activity in the songbird forebrain. Nat Neurosci 2: 209–211. [DOI] [PubMed] [Google Scholar]
- Heuer H (1988) Testing the invariance of relative timing: comment on Gentner (1987). Psychol Rev 95: 552–558. [DOI] [PubMed] [Google Scholar]
- Hikosaka O, Nakamura K, Sakai K, Nakahara H (2002) Central mechanisms of motor skill learning. Curr Opin Neurobiol 12: 217–222. [DOI] [PubMed] [Google Scholar]
- Jansen R, Metzdorf R, van der Roest M, Fusani L, ter Maat A, Gahr M (2005) Melatonin affects the temporal organization of the song of the zebra finch. FASEB J 19: 848–850. [DOI] [PubMed] [Google Scholar]
- Kimpo RR, Theunissen FE, Doupe AJ (2003) Propagation of correlated activity through multiple stages of a neural circuit. J Neurosci 23: 5750–5761. [DOI] [PMC free article] [PubMed] [Google Scholar]
- Kobayashi K, Uno H, Okanoya K (2001) Partial lesions in the anterior forebrain pathway affect song production in adult bengalese finches. NeuroReport 12: 353–358. [DOI] [PubMed] [Google Scholar]
- Lashley K (1951) The problem of serial order in behavior. In: Cerebral mechanisms in behavior (Jeffress L, ed), pp 112–146. New York: Wiley.
- Leonardo A, Fee MS (2005) Ensemble coding of vocal control in birdsong. J Neurosci 25: 652–661. [DOI] [PMC free article] [PubMed] [Google Scholar]
- MacNeilage PF (1998) The frame/content theory of evolution of speech production. Behav Brain Sci 21: 499–511; discussion 511–546. [DOI] [PubMed] [Google Scholar]
- Miller G, Galanter E, Pribram KH (1960) The unit of analysis. In: Plans and the structure of behavior, pp 21–39. New York: Holt and Company.
- Mooney R, Prather JF (2005) The HVC microcircuit: the synaptic basis for interactions between song motor and vocal plasticity pathways. J Neurosci 25: 1952–1964. [DOI] [PMC free article] [PubMed] [Google Scholar]
- Ollason J, Slater PJB (1973) Changes in the behaviour of the male zebra finch during a 12-hr day. Anim Behav 21: 191–196. [DOI] [PubMed] [Google Scholar]
- Rabiner L, Juang B (1993) Time alignment and normalization. In: Fundamentals of speech recognition, Prentice Hall signal processing series, pp 200–241. Englewood Cliffs, NJ: Prentice-Hall PTR.
- Rhodes BJ, Bullock D, Verwey WB, Averbeck BB, Page MP (2004) Learning and production of movement sequences: behavioral, neurophysiological, and modeling perspectives. Hum Mov Sci 23: 699–746. [DOI] [PubMed] [Google Scholar]
- Schmidt MF (2003) Pattern of interhemispheric synchronization in hvc during singing correlates with key transitions in the song pattern. J Neurophysiol 90: 3931–3949. [DOI] [PubMed] [Google Scholar]
- Simpson HB, Vicario DS (1990) Brain pathways for learned and unlearned vocalizations differ in zebra finches. J Neurosci 10: 1541–1556. [DOI] [PMC free article] [PubMed] [Google Scholar]
- Solis MM, Perkel DJ (2005) Rhythmic activity in a forebrain vocal control nucleus in vitro J Neurosci 25: 2811–2822. [DOI] [PMC free article] [PubMed] [Google Scholar]
- Sossinka R, Bohner J (1980) Song types in the zebra finch Poephila guttata castanotis Z Tierpsychol 53: 123–132. [Google Scholar]
- Spiro JE, Dalva MB, Mooney R (1999) Long-range inhibition within the zebra finch song nucleus RA can coordinate the firing of multiple projection neurons. J Neurophysiol 81: 3007–3020. [DOI] [PubMed] [Google Scholar]
- Sturdy CB, Wild JM, Mooney R (2003) Respiratory and telencephalic modulation of vocal motor neurons in the zebra finch. J Neurosci 23: 1072–1086. [DOI] [PMC free article] [PubMed] [Google Scholar]
- Suthers RA, Margoliash D (2002) Motor control of birdsong. Curr Opin Neurobiol 12: 684–690. [DOI] [PubMed] [Google Scholar]
- Vu ET, Mazurek ME, Kuo YC (1994) Identification of a forebrain motor programming network for the learned song of zebra finches. J Neurosci 14: 6924–6934. [DOI] [PMC free article] [PubMed] [Google Scholar]
- Wild JM, Li D, Eagleton C (1997) Projections of the dorsomedial nucleus of the intercollicular complex (DM) in relation to respiratory-vocal nuclei in the brainstem of pigeon (Columba livia) and zebra finch (Taeniopygia guttata). J Comp Neurol 377: 392–413. [DOI] [PubMed] [Google Scholar]
- Wild JM, Goller F, Suthers RA (1998) Inspiratory muscle activity during bird song. J Neurobiol 36: 441–453. [DOI] [PubMed] [Google Scholar]
- Williams H, Vicario DS (1993) Temporal patterning of song production: participation of nucleus uvaeformis of the thalamus. J Neurobiol 24: 903–912. [DOI] [PubMed] [Google Scholar]
- Yu AC, Margoliash D (1996) Temporal hierarchical control of singing in birds. Science 273: 1871–1875. [DOI] [PubMed] [Google Scholar]
- Zann R (1993) Structure, sequence and evolution of song elements in wild Australian zebra finches. Auk 110: 702–715. [Google Scholar]
- Zann R (1996) The zebra finch: a synthesis of field and laboratory studies. New York: Oxford UP.