

Summary:
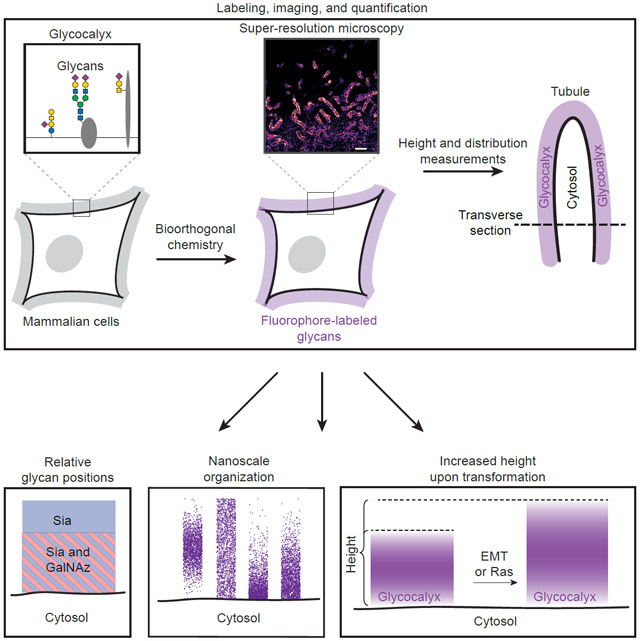
The mammalian glycocalyx is a heavily glycosylated extramembrane compartment found on nearly every cell. Despite its relevance in both health and disease, studies of the glycocalyx remain hampered by a paucity of methods to spatially classify its components. We combine metabolic labeling, bioorthogonal chemistry, and super-resolution localization microscopy to image two constituents of cell-surface glycans, N-acetylgalactosamine (GalNAc) and sialic acid, with 10-20 nm precision in 2D and 3D. This approach enables two measurements: glycocalyx height and the distribution of individual sugars distal from the membrane. These measurements show that the glycocalyx exhibits nanoscale organization, on both cell lines and primary human tumor cells. Additionally, we observe enhanced glycocalyx height in response to epithelial-to-mesenchymal transition and to oncogenic KRAS activation. In the latter case, we trace increased height to an effector gene, GALNT7. These data highlight the power of advanced imaging methods to provide molecular and functional insights into glycocalyx biology.
Keywords: Super-resolution microscopy, glycobiology, glycocalyx, bioorthogonal chemistry, metabolic labeling, membrane biophysics, ovarian cancer, pancreatic adenocarcinoma, KRAS, GALNT7
Graphical Abstract
In Brief:
Nearly every cell in the human body is encapsulated by an extramembrane glycosylated compartment – the glycocalyx – that is the cell’s first contact point with the extracellular environment. Möckl et al. combine bioorthogonal chemistry with quantitative super-resolution imaging to investigate glycocalyx nanoscale organization and its relationship to oncogenic cellular transformation.
Introduction
Over 80% of extracellular and transmembrane proteins are predicted to be glycosylated (Steentoft et al., 2013). These glycoproteins, along with glycolipids and polysaccharides, form a peripheral compartment at the cell surface termed the glycocalyx (Figure 1A, left). The glycocalyx is present in all domains of life, and is found on nearly every cell of the human body (Varki et al., 2015). It is the first component of a cell to interact with the environment, and therefore plays an important role in cell-cell and cell-matrix interactions critical to embryonic development, immune cell trafficking, cancer progression, and many other normal and pathological processes. The glycocalyx is also known to be dynamic and undergoes shifts in composition and physical properties in response to cues from the microenvironment. For example, human embryos at the blastocyst stage effect shedding of the uterine glycocalyx to implant (Constantinou et al., 2015), viruses deforest the glycocalyx to infect (Matrosovich et al., 2004), and cancer cells with glycocalyces that activate immune checkpoints are enriched during cancer progression (Hudak et al., 2014).
Figure 1. Labeling and SR imaging of the mammalian glycocalyx.

(A) Left. Central glycoconjugates found in the mammalian glycocalyx and important representatives of each are shown. Labeling schemes are shown for sialic acids (top row), GalNAz (middle row), and the lipid membrane (bottom row). GalNAz labels N-acetylgalactosamine (GalNAc) and N-acetylglucosamine (GlcNAc). Glc is glucose; Gal is galactose; Bi-ant. refers to bi-antennary. (B) Confocal imaging of SKBR3 cells with Sia, GalNAz, and lipid labeling. Contrast settings are not equal for all fluorescent micrographs, to show all areas of cellular fluorescence. Lipid labeling is typically dimmer than GalNAz labeling, which is dimmer than Sia labeling. Structure of lipid-azide is depicted on the right. (C) Flow cytometry analysis of Sia-labeled SKBR3 cells with and without prior treatment with 30 nM Vibrio cholerae (VC) sialidase for 2 h at 37 °C. Cells were labeled using the same protocol as for SR microscopy, then lifted with trypsin, fixed, and subjected to flow cytometry. VC sialidase is specific to a subset of Sia linkages. (D) SR reconstructions of SKBR3, BT-20, and MCF10A cells with Sia and GalNAz labeling. Note spiny protrusions exhibiting high signal that cover the entire membrane region (arrowheads show two examples for each condition). Reconstructions are shown as 2D histograms with 32 nm bin width. DL = Diffraction limited. Scalebars for DL images refer to the same width as the scalebars in the corresponding reconstructions.
Despite decades of observations such as these, the molecular architecture of the glycocalyx as well as its dynamics have remained difficult to elucidate. This is due to the inherent structural complexity and heterogeneity associated with the large collections of glycans that constitute the glycocalyx, and, until recently (vide infra), a limited tool kit for direct visualization of these structures using imaging methods. Conventional methods of molecular biology have also been difficult to apply, as glycosylation is a post translational modification that is not directly encoded in the genome, but rather the product of complex and interdependent metabolic pathways. Also, the axial thickness of the glycocalyx is in the range of tens to hundreds of nanometers, and is therefore too small to be resolved with conventional light microscopy, which is diffraction-limited at ~200 nm. Worse, due to the heterogeneity and physical fragility of the glycocalyx, visualization of its bulk structure, e.g. by electron microscopy (EM), is difficult (Hegermann et al., 2016). There is a need for methods that allow nanometer-scale analysis of the glycocalyx while preserving its fine structure.
Localization-based super-resolution (SR) microscopy is uniquely situated to address these challenges. This flavor of SR microscopy employs single-molecule imaging and control of emitter concentration (PALM/STORM/F-PALM) (Betzig et al., 2006; Hess et al., 2006; Rust et al., 2006). By actively choosing a control mechanism, only a sparse subset of the fluorophores decorating a structure are allowed to emit in any given camera frame. Then, each non-overlapping emitter, which appears on the camera’s detector as a spot, termed the point spread function (PSF), is localized. This localization achieves higher precision than the diffraction limit by taking the center of each PSF as the position of the emitter. The error in finding the center of the PSF defines the precision of the measurement, which with current methods can approach single-digit nanometers. This process is repeated over many frames, and the localizations are used in a point-by-point reconstruction of the imaged structure with information beyond the diffraction limit (Huang et al., 2016; Patterson et al., 2010). Here, we employ metabolic labeling and bioorthogonal chemistry to chemically modify specific sugar residues in the glycocalyx with small molecule fluorophores. Performing SR on these emitters enables visualization of single sugars in the glycocalyx at 10-20 nm precision in 2D and 3D. Previous SR studies of the glycocalyx have begun to show sub-diffraction detail (Chen et al., 2015; Jiang et al., 2015; Letschert et al., 2014). Yet, the potential for biological insights at the intersection of advanced imaging and glycocalyx biology has remained untapped.
Our quantitation of individual localizations enables two measurements which may help to fill the gap and spur further efforts: height of the glycocalyx distal from the membrane and the distribution of sugar residues within the glycocalyx. We employ these novel measurements on systems of high biological relevance, including primary human tumor cells, to show that the glycocalyx exhibits a nanoscale organization, that glycocalyx height increases when oncogenic KRAS is expressed, and that this phenotype can be linked to a single gene, GALNT7.
Results
Bioorthogonal labeling and super-resolution imaging enable visualization of the mammalian glycocalyx at 10-20 nm precision
To introduce a small-molecule fluorophore into cell surface glycans, we used two methods rooted in bioorthogonal chemistry: (i) metabolic incorporation of N-azidoacetylgalactosamine (GalNAz) (Hang et al., 2003), which introduces azide groups for subsequent probe conjugation; and (ii) periodate-mediated oxidation of sialic acids (Sia) to introduce aldehyde groups (Zeng et al., 2009) (Figure 1A, top and middle). Live cells bearing the corresponding modifications were labeled at 4 °C with alkyne- and aminooxy-functionalized fluorophores, respectively, then fixed prior to analysis. This protocol selectively targets extracellular sugars as the reagents are not membrane-permeable and endocytosis is negligible at 4 °C. We chose GalNAz and Sia as labeling targets based on the different positions they are thought to occupy within mammalian glycans. Whereas Sia are typically terminal residues positioned at the nonreducing end of a glycan chain, GalNAc residues tend to occupy core positions near the reducing ends of glycans and are more proximal to underlying polypeptide scaffolds (Varki et al., 2015). By labeling these sugars covalently with small-molecule fluorophores, we avoid the nonspecific labeling which often accompanies antibody- or lectin-based cell surface staining procedures (Whelan and Bell, 2015). To provide a third labeling position which visualizes cellular boundaries, we incorporated a lipid-azide (16:0 azidocaproyl phosphoethanolamine; see Figure 1B, right for structure) into the outer leaflet of the plasma membrane, then conjugated it with alkyne-AF647 (Figure 1A, bottom) (Nishimura et al., 2006). We chose this two-step lipid labeling method to ensure that the labeling reagents were capable of penetrating through the glycocalyx down to the plasma membrane.
Confocal microscopy of adherent breast cancer cells (SKBR3) revealed consistent and strong labeling across all cells for each labeling method (Figure 1B and Figure S1A). Note that by diffraction-limited confocal imaging, lipid-azide-derived labeling is indistinguishable in its membrane-localized pattern from GalNAz or Sia labeling. Since Sia labeling involves chemical modification of native functional groups on cell surfaces, we confirmed proper labeling via enzymatic cleavage of Sia residues, which caused a decrease in Sia-derived signal consistent with earlier reports (Ramya et al., 2012) (Figure 1C and Figures S1B-C).
With optimized labeling protocols in place (Methods; Figure S1D), we performed GalNAz, Sia, and lipid-azide one-color SR imaging on two morphologically different breast cancer cell lines, flat BT-20 cells and round SKBR3 cells, and one immortalized mammary epithelial cell line, MCF10A (Figure 1D; see Figure S1E for lipid-azide SR reconstructions). The quality of labeling was underscored by high numbers of localizations with low background and high photon counts (Figure S1F). Note that the haze from widefield epifluorescence is absent from the 2D SR reconstructions. This is due to effective sectioning arising from removal of out-of-focus emitters (discussed in Figure 3A and Figures S3A-C). Inspection of 2D SR reconstructions revealed a striking feature common to all reconstructions: spiny, apparently hollow cell surface protrusions with a high density of GalNAz- and Sia- derived signal localized to their periphery (arrowheads for examples, Figure 1D). These protrusions are membrane ruffles, microvilli, or as they will be referred to here, “tubules”, which have been reported by several other techniques, and are commonly seen in EM images of cancer cells and tissues (Cai et al., 2017; Elgqvist et al., 2010; Kolata, 1975).
Figure 3. Tubule width is a measure for glycocalyx height and can be extracted with high throughput from 2D SR reconstructions.

(A) Effect of projection of a 3D tubule into 2D. Three exemplary cylinders (i)-(iii) as proxies for membrane tubules are shown. The inner diameter corresponds to the membrane-to-membrane diameter of a tubule, and the difference between total and inner diameter corresponds to the glycocalyx height on the tubule. Black dots are sampled localizations from exemplary cylinders, turquoise dots incorporate localization precision, and red lines represent the fit. (B) Analysis routine to extract tubule widths from SR reconstructions. (C) ldlD CHO cells have a mutation in the GALE gene which leads to the absence of the key sugars UDP-Gal and UDP-GalNAc. The phenotype can be rescued by supplementation of the media with GalNAc and galactose. (D) Confocal analysis of non-rescued, partly rescued, and fully rescued Sia-labeled ldlD CHO cells. Contrast settings equal between all images. (E) Sia-determined tubule width of ldlD CHO cell rescue panel. Sugar supplementation was performed at the concentrations shown for 2 days prior to labeling and analysis. Error bars: SEM; * = p < 0.05. (F) Tubule width measurements of lipid labeled ldlD CHO cells. (G) Flow cytometry of starved and rescued ldlD CHO cells showing total AF647 fluorescence from cells labeled as in Figure 3E.
3D SR microscopy shows that glycocalyx-covered membrane tubules are an ideal target for quantitative analysis
Given the difficulty to directly measure the height of the glycocalyx (Paszek et al., 2012) and given that biophysical properties of the glycocalyx such as height are of key relevance in human pathologies (Kuo et al., 2018; Pinho and Reis, 2015), we explored the height of the glycocalyx as a quantitative parameter. The observed tubules provide a uniquely well-defined boundary between cytosol and glycocalyx, in contrast to less structured membrane regions (see Figure 1D). We reasoned that by leveraging the high spatial resolution at which we capture glycocalyx-covered membrane tubules and the high number of tubules found per cell, we could gain the statistical power required to extract meaningful quantitative information about the height of GalNAz and Sia distal from the membrane.
To characterize these tubules in detail, we used a novel light sheet approach (Figures S2A-B) (Gustavsson et al., 2018) to generate the first 3D SR reconstruction of the glycocalyx (sialic acid labeling, precision 10-30 nm, Figure 2A and Figures S2C-E). The tubules exhibited a roughly homogenous diameter, independent of their orientation (cf. left and right insets). Projections of the 3D reconstructions (Figure 2B) revealed that the apparently non-structured regions near the plasma membrane in the 2D projections likely arose from overlapping tubules in 3D and not from a true biological structure or nonspecific labeling (e.g., see intertwined tubules, Figure 2C). In addition, inspection of the boundary between the cellular cytosol and the base of the tubules confirmed that tubules were contiguous with the cell interior (Figure 2D). These measurements suggested that the observed tubules were valid targets for quantitative SR microscopy.
Figure 2. 3D SR imaging reveals cell-surface protrusions as glycocalyx-covered membrane tubules suitable for quantitation.

(A) 3D reconstruction of Sia on BT-20 cells. Tetraacylated N-azidoacetylmannosamine (ManNAz) incorporated BT-20 cells were labeled with AF647 using Cu-click and subjected to TILT3D microscopy. ManNAz was used rather than periodate to label sialic acids in order to minimize coverslip background. Left and right insets correspond to tubules that extend perpendicular to and within the xy-plane, respectively. (B) Projection of the 3D reconstruction onto the xy-plane. The z-slices had a thickness of ~250 nm. (C) Effect of the orientation of tubules on their projections. Shown is a magnification of the tubules located at the asterisk in Figure 2A. (D) Magnification of the base of a single tubule taken from a z-slice (dagger in Figure 2B). (E) Quantitation of tubule width in 3D. A traverse section of three tubules was taken, and a histogram of single molecule localizations was plotted. (F) Schematic of the tubules as glycocalyx-covered membrane protrusions along with the two key parameters to be determined. The lipid-determined tubule width corresponds to the plasma membrane-to-plasma membrane distance. The GalNAz- and Sia-determined tubule widths correspond to lipid-determined tubule width summed with the glycocalyx height on each side of tubule.
We examined the distribution of Sia localizations along transverse slices of the tubules from the 3D reconstructions. The histograms representing these distributions yielded widths of 150-300 nm, in line with previous observations by EM (Connor et al., 2015) (Figure 2E). These “tubule widths” correspond to the sum of the following: (i) tubule size, i.e. the distance from the plasma membrane on one side to the plasma membrane on the other side, and (ii) the glycocalyx height on both sides of the tubule (Figure 2F). In the following, tubule size and glycocalyx height will be independently determined by comparing tubule widths derived from glycocalyx-labeled samples to those derived from plasma membrane-labeled samples.
Glycocalyx height can be extracted with high throughput using a 2D image analysis algorithm
3D imaging revealed that tubule widths vary widely (Figure 2E). Therefore, in order to extract meaningful information about glycocalyx height, many tubules on many cells must be analyzed. Current 3D imaging methods do not reach the throughput (sampling density, imaging speed) needed for such analysis. Furthermore, 2D methods have inherently higher resolution, which is especially important at the length scales dealt with here: given that glycan trees and the proteins that bear them are on the order of tens of nm in size (Helenius and Aebi, 2001), we expected the relevant length scales to be at the limit of what is possible to unambiguously assign, even with SR microscopy. In order to address these challenges of throughput and scale, we developed a semi-automated 2D SR imaging analysis workflow.
In single-molecule localization microscopy, 2D reconstructions represent a finite sampling of a 3D structure, which is inevitably blurred with a finite localization precision, then projected into 2D. By fitting the set of projected localizations to a model function, quantitative parameters may be extracted. To account for each of these steps (sampling, localization precision, projection, fitting), we explored how they affect the analysis of simulated “ground truth” 3D cylinders, representing glycocalyx-covered membrane tubules. Such validation is prudent when the effect sizes approach the experimental localization precision.
Single slices perpendicular to the simulated cylinders were sampled (black dots), then randomly displaced to simulate localization precision (turquoise dots), both using values corresponding to experimental datasets (Figure 3A; cf. Methods for details). The resulting yz-scatters were then projected, assuming infinitely large sectioning depth, onto the y-axis (right panels). The large sectioning depth was conservative; see Figures S3A-C for quantification of experimental sectioning depth (effectively ~120 nm in z). After projection, localizations were binned into histograms with bin width corresponding to our SR reconstructions. Agreement between the projection of the sampled localizations (gray histogram), the displaced localizations (turquoise histogram), and the ground truth total width was excellent, indicating that at length scales relevant to tubules, experimental localization precision and projection depth are sufficiently small to enable measurement of tubule width.
Note that depending on the inner and total diameter, tubules can appear in projections as non-hollow (i) or hollow (iii). Given that we observed hollow and non-hollow tubules, a fitting function was required that captured tubule width independent of apparent hollowness. We verified that a sum of two Gaussians that overlap to various extents could approximate the localization distribution across a tubule regardless of its appearance. We chose the distance between the outer inflection points over the peak-to-peak distance because the former is decoupled from the width of each single Gaussian. Simulations revealed that across tested parameter space, the maximal error for width measurements performed in this way was 0.5 nm for a tubule of 67 nm width (Figures S3D-E; see also red curves in Figure 3A). Hence, the analyses above establish a strategy to extract glycocalyx height from 2D SR reconstructions.
Figure 3B outlines the analysis routine. Briefly, SR reconstructions were represented as 2D histograms of localizations (32 nm bin width, see Figure S3F for validation) and well-defined tubules were selected. A threshold was set to create a binary mask that effectively captured the morphology of the tubule and enabled its boundary to be automatically determined. The beginning and end of the tubules were defined, and 50 line profiles (LPs) oriented perpendicular to the boundary were created. Each line profile was fit to a double Gaussian, and tubule width was extracted. The average value of tubule widths derived for all line profiles in a given experimental condition was reported as the final tubule width, with accompanying standard error of the mean (conservatively taking N = number of tubules).
To benchmark the analysis routine, we chose a system where glycocalyx height could be predictably modulated. ldlD Chinese Hamster Ovary (CHO) cells are deficient in the enzyme UDP-glucose/galactose-4-epimerase (GALE), which interconverts UDP-glucose and UDP-GlcNAc to UDP-galactose and UDP-GalNAc, respectively (Figure 3C). These nucleotide sugars are donors for the glycosyltransferases that initiate and elaborate glycans, hence ldlD CHO cells display truncated glycans on their cell surface (Kingsley et al., 1986). Fully elaborated glycans can be restored by supplementing cell media with 10 μM galactose and 100 μM GalNAc. Successful Sia labeling was confirmed by confocal microscopy (Fig 3D). Using our analysis workflow, we observed that, as expected, the non-rescued cells had a shorter glycocalyx height, apparent from tubule widths of 119 ± 7 nm vs. 149 ± 6 nm for the rescued cells (SEM, p < 0.05, N = 42-78) (Figure 3E; see Figure S3G for SR reconstructions). The lipid-determined widths, at 115 ± 17 nm and 98 ± 14 nm for non-rescued and rescued cells, respectively, were not different from each other (Figure 3F, p > 0.1, N = 29; see Figure S3H for SR reconstructions), implying that the observed difference in Sia-determined widths originated from changes in glycocalyx height, not tubule size. Our direct measurements of glycocalyx height are in agreement with previous indirect measurements on single cells (Paszek et al., 2012). Further, lipid-determined tubule widths match reported values of 60-120 nm for membrane tubules, as determined by EM (Frost et al., 2008; Guerrier et al., 2009).
As is evident from the confocal images in Figure 3D, galactose- and fully-rescued ldlD CHO cells displayed higher fluorescence intensity upon Sia labeling than their GalNAc-rescued and nonrescued counterparts, presumably due to lower sialic acid elaboration on truncated glycans. The increase in labeling extent upon galactose supplementation is likely due to LacNAc (i.e., Galβ1-4GlcNAc) elaboration (see for example biantennary glycan, Figure 1A). To ensure that our findings were not dependent on the extent of cellular labeling, we performed flow cytometry for each condition investigated. Labeling intensity was not correlated with tubule widths (Figure 3G). The increase in height upon GalNAc addition may be due to importance of GalNAc for proper processing and surface presentation of mucins such as MUC1, which are important structural components of the glycocalyx (Altschuler et al., 2000).
Sialic acids reside distal to GalNAz residues in the glycocalyx
As Sia residues cap many glycan structures, they are thought to be, as a population, more peripheral than other monosaccharides (Varki and Gagneux, 2012). Peripheral localization of Sia is also consistent with their important role as ligands for viral receptors such as influenza virus hemagglutinin as well as human glycan-binding proteins such as Siglecs and selectins involved in the immune response (Varki, 2017). Any difference in height between Sia and GalNAz populations is expected to be a fraction of total glycocalyx height. It is for this reason that while a peripheral distribution of Sia residues has been speculated, direct evidence has been lacking.
We employed tubule width measurements to examine whether Sia residues are as a population spatially distinct from GalNAz residues (Figure 4A). For MCF10A cells, the difference was significant (202 ± 5 nm, N = 111, for Sia vs. 160 ± 6 nm, N = 52, for GalNAz, p < 0.0005). Measurements trended in the same direction but did not achieve significance for BT-20 cells (tubule widths of 235 ± 7 nm for Sia, N = 115, vs. 212 ± 12 nm, N = 63, for GalNAz, p = 0.09) or SKBR3 cells (203 ± 7 nm, N = 61, for Sia vs. 182 ± 8 nm, N = 80, for GalNAz, p = 0.06). In all cells, the lipid-determined width was significantly less than both the GalNAz- and the Sia-determined widths (N = 19-24). With a panel of only three cell lines, conclusions were difficult to draw. Rather than screening a large number of additional cell lines, we turned to primary human cells.
Figure 4. As a population, Sia residues likely reside distal to GalNAz residues.

(A) Periodate-mediated Sia labeling, GalNAz incorporation, and lipid-azide incorporation were performed on BT-20, MCF10A, and SKBR3 cells. Tubule width measurements were taken using the workflow presented in Figure 3B. Error bars are SEM. * = p < 0.05, ** = p < 0.005, *** = p < 0.0005 by Student’s two-tailed t-test. (B) Tissue from Patient 213 and Patient 215 were obtained from chemotherapy-naïve patients diagnosed with High-Grade Serous Cancer. Labeling and measurement were performed as in (A). (C) Representative SR reconstructions for GalNAz- and Sia-labeled Patient 213 cells. (D) Representative SR reconstructions of MCF10A cells expressing signaling deficient MUC1ΔCT on a doxycycline promoter. (E) MCF10A+MUCΔCT were labeled and measured as in (A). (F) MCF10A + MUC1ΔCT cells were sequentially Sia- and GalNAz-labeled (cf. Methods), with conjugation to AF647 or CF568 for two-color and swapped two-color reconstructions. Binary images, which maximize contrast, of six individual magnified views are shown. Note that binarization obscures the hollowness of the tubules. (G) Two models of the glycocalyx architecture that could explain the distal position of Sia relative to GalNAz. GalNAz could either reside below Sia (Model 1), or GalNAz and Sia could interpenetrate, with Sia, as a population, extending further into the extracellular space (Model 2). (H) Wall width analysis of samples generated in (A). Individual Gaussians from the double-Gaussian fit were extracted from tubules resolved as hollow. Error bars are SEM. * = p < 0.05.
Two chemotherapy-naïve patients, Patient 215 and Patient 213, underwent resective surgery for ovarian cancer (High-Grade Serous Cancer, HGSC). Primary tumor and omentum metastases were acquired, dissociated within an hour of removal, and plated (cf. Methods; see Figure S4A for bright field images). Labeling, imaging, and analysis were performed as before. Cell viability was high, as indicated by robust incorporation of GalNAz after two days of incubation (Figure S4B). Sia residues were significantly distal to GalNAz for Patient 215 (193 ± 13 nm, N = 30, for Sia vs. 138 ± 11 nm, N =29, for GalNAz, p < 0.005), Patient 213 primary tumor (235 ± 8 nm, N = 37, for Sia vs. 151 ± 10 nm, N = 34, for GalNAz, p < 0.0005), and Patient 213 omentum metastasis (186 ± 7 nm, N = 42, for Sia vs. 153 ± 8 nm, N = 25, for GalNAz, p < 0.005) (Figure 4B). As in the cell lines, all lipid-determined tubule widths were significantly smaller than GalNAz- and Sia- determined widths (Figure 4B). As seen from the SR reconstruction shown in Figure 4C, the difference in tubule width between GalNAz and Sia for Patient 213 was visually apparent. These data solidify the difference in height between Sia and GalNAz.
Due to limitations in availability of primary human cells, we returned to cell lines for two-color labeling. The approximately 20-40 nm tubule width difference between GalNAz- and Sia-determined tubule widths on BT-20, MCF10A, and SKBR3 cells would have been difficult to resolve in two-color due to lower resolution arising from requisite use of a second dye of lower quality. We therefore moved to MCF10A cells stably expressing the bulky mucin MUC1 with a C-terminus truncation to block downstream intracellular signaling (MUC1ΔCT) (Shurer et al., 2017), in the hope that a more prominent glycocalyx would result in a magnified difference between GalNAz and Sia labeling. In one-color SR imaging for GalNAz and Sia, the difference between the tubule widths was evident by visual inspection (Figure 4D). This difference in height was confirmed by quantitative analysis which yielded a difference of ~90 nm (Figure 4E, p<0.0005, N = 104 for Sia and N = 101 GalNAz). Figure 4F shows two-color binary super-resolved images of representative tubules on MCF10A MUC1ΔCT cells. Sia was distal to GalNAz across tubules. The swapped-fluorophore two-color images (Figure 4F, bottom row) confirmed that our results were not dependent on the photophysical properties of the fluorophores.
The observation that Sia extends further into the extracellular space than GalNAz can be explained by two scenarios. Sia and GalNAz could be stacked (Model 1, Figure 4G, left) or interpenetrate (Model 2, Figure 4G, right). To determine which scenario was best supported by our data, we selected tubules resolved as hollow and extracted the widths of each single Gaussian from the double Gaussian fit. These “wall widths” correspond to the height of a single glycocalyx on each side of the tubule. Note that this analysis can only be performed on samples that exhibit a large number of tubules appearing as hollow for both GalNAz and Sia labeling. Again, BT-20 and SKBR3 cells did not achieve significance, while in MCF10A cells Sia labeling gave a significantly larger wall width (p < 0.05, Figure 4H, N = 26-82). The observed wall widths had magnitudes between 60 and 80 nm. If doubled and summed with the lipid-determined tubule width, as required by Model 1, the wall widths yield tubule widths of at least 350 nm (cf. Figure 2F). As this value is larger than any observed tubule width, Sia residues as a population likely penetrate GalNAz residues and extend past them, as suggested in Model 2. Comparison of the height difference between GalNAz and Sia (~20 nm) and current estimates of glycan tree size (5-10 nm) (Kuo et al., 2018) suggests that the observed height difference is not solely due to the position of sialic acids at the reducing end of glycans. Rather, it may be that proteins which are more heavily sialylated reside as a population distally to those with less sialic acid modification.
Statistical analysis of individual localizations reveals that the glycocalyx exhibits nanoscale architecture
The average widths extracted by our algorithms cannot report on the precise distribution of sugars in the glycocalyx, nor microheterogeneity along the membrane. As individual localizations correspond directly to sugar residues in the glycocalyx, we considered the possibility that analysis of raw localizations on single walls of hollow tubules could yield further insights into sugar distributions. Figure 5A shows representative binned experimental localizations using a window size of 90 nm (perpendicular) × 30 nm (along membrane). Each of the panels represents a single window on a single tubule labeled by GalNAz (G) or Sia (S). The observed histograms arise from the true single emitter distribution in the glycocalyx as well a blur due to finite localization precision. Attempts to fit model functions directly to these histograms would report on the true positions of the emitters and the blur, which in this case are on the same length scale. To address this challenge, a statistical method which could account for finite localization precision was needed.
Figure 5. The glycocalyx exhibits a nanoscale architecture with sugar residues exhibiting a maximal density some distance away from the membrane.

(A) Nine representative localization distributions from single 90×30 nm windows along a single wall of GalNAz (G) or Sia (S)-labeled tubules. Top row depicts examples of exponential- or half-Gaussian-like distributions, middle row depicts Gaussian-like distributions, and bottom row depicts uniform-like distributions. (B) Schematic of analysis workflow for comparing possible ground truth sugar distributions with experimental localizations. (C) R2 values from QQ analysis shown binned as violin plots. Each of the twelve columns represents a comparison of two distributions (see x-axis labels). Analysis of GalNAz-labeled tubules is shown on top, and analysis of Sia-labeled tubules is shown on bottom. P-values are derived from t-tests of the means and standard deviations of the violin plots shown. Error bars: SEM; * = p < 0.05; *** = p < 0.0005. (D) Quantification of glycocalyx microheterogeneity along a single tubule wall. Values close to zero for R2ideal, exp minus R2ideal, realistic indicate good agreement between the experimental localization distribution and the simulated distribution to which it was compared. Arrowheads indicate example positions where the experimental data has a non-Gaussian sugar distribution.
Inspection of the raw localization histograms revealed considerable heterogeneity, though all exhibited unimodality (cf. Figure 5A). Three basic patterns could account for the observed unimodal distributions: localizations could be uniform across the glycocalyx, could be concentrated at the membrane and decay outward, or could exhibit a maximum some distance away from the membrane, decaying in both directions (Figure 5B). We simulated each of these scenarios using uniform, exponential or half-Gaussian, and Gaussian distributions, respectively, as approximations of possible “ground truths”, and compared them to experimentally measured localization distributions.
We considered many 90×30 nm windows on each side of several hollow tubules for GalNAz-labeled BT-20 cells and Sia-labeled BT-20 cells. Localizations were projected onto the axis perpendicular to the plasma membrane (x-axis, Figure 5A), yielding “experimental distributions”. Next, the four ground truth distributions ((a) through (d) in Figure 5B) were sampled with the same localization number as in each of the experimental windows (nexp ≈ 50, see Figure 5B, middle), yielding “ideal distributions”. To account for two inevitable factors in localization microscopy, over-counting and localization imprecision, we duplicated 30% of the simulated localizations in the ideal distributions (estimated from merging localizations with less than 20 nm distance and one off-frame) and then perturbed each simulated localization with localization precision uncertainties sampled from the experimental data. The resulting “realistic distributions” modified the ideal models to account for unavoidable physical uncertainties.
To compare the experimental distributions to the four ground truth models (a) - (d), we employed quantile-quantile (QQ) plots (Figure S5A). In this approach, the sorted x-coordinates of the two distributions are plotted against each other, and fit to a straight line, giving a correlation coefficient, R2 (Figure 5B, right). This procedure was repeated 2000 times, each with a newly simulated distribution, generating a set of R2 values (Figure 5C). We performed three comparisons, progressively adding complexity. First, we determined the agreement of simulated ideal distributions compared to themselves (Figure 5C, dark gray violin plots). This estimated the effect of statistical noise due to finite sampling. Second, we compared ideal to realistic distributions (light gray). This determined the impact of the physical uncertainties on the measurement, leading to decreased mean R2 values as expected. Finally, we compared ideal simulations to experimental data (white). The obtained sets of R2 values contain contributions from both the physical uncertainties of the measurement and the actual positions of individual labeled sugars within the glycocalyx. To compare sets of R2 values obtained by the ideal-realistic and ideal-experimental cases, we employed Student’s paired t-test. The resulting p-value reported on the agreement of the experimental data with the ground truth distribution in question. The Gaussian distribution exhibited the best agreement (insignificant p-values) for both GalNAz and Sia (Figure 5C), and the other three potential distributions were rejected. Note that our experimental axial sectioning depth of ~120 nm (Figure S3A-C) ensured the absence of projection artifacts in the QQ analysis (cf. Figures S5B-G for validation). We also note that using a realistic-experimental comparison when examining R2 does not provide a reference point with which to contextualize the resulting mean values.
Remarkably, individual windows along one wall of a single tubule featured distributions that had a range of shapes. This local heterogeneity is shown by plotting the difference between R2ideal, exp and R2ideal, realistic along a tubule wall for four tubules (Figure 5D). This analysis revealed that there were window positions along tubule walls where the deviation between R2ideal, realistic and R2ideal, exp was smaller for non-Gaussian distributions (see red arrowheads), though overall agreement was still best for the Gaussian distribution, as expected. The observation that the degree of heterogeneity is similar for both Sia and GalNAz highlights the notion that our measurements are not representative of only a single glycocalyx member, such as mucins, but rather of various contributing components. These data support the view that the glycocalyx exhibits nanoscale architecture with heterogeneity on the length scale of single-digit nanometers.
Glycocalyx height increases upon epithelial to mesenchymal transition and oncogenic Ras activation
Decades of genomic, transcriptomic, and proteomic studies have shown changes in the glycocalyx with malignancy (Pinho and Reis, 2015). More recently, transcript analyses revealed upregulation of mRNA encoding “bulky” glycoproteins in primary tumors of patients with metastatic disease relative to those with confined tumors, implying that a large glycocalyx correlates with metastatic potential (Paszek et al., 2014). Those findings led to the generation of a mouse tumor model where the glycocalyx could be artificially bulked by overexpression of signaling deficient MUC1 (MUC1ΔCT) or via surface loading of mucin-mimetic glycopolymers, which provided evidence that a bulky glycocalyx functionally promotes metastasis (Woods et al., 2017). Despite these findings, direct observation of increased glycocalyx bulk as a result of transformation has not been reported. We hypothesized that our ability to measure glycocalyx height could fill this gap and potentially uncover pro-oncogenic pathways (more general than mucin upregulation) that could affect glycocalyx height.
We began with two characteristic features of advanced human cancers: epithelial to mesenchymal transition (EMT) and oncogenic Ras activation. EMT is a vital component of the metastatic program (Kalluri and Weinberg, 2009), and Ras, which is mutated in 9-30% of all diagnosed cancers, is vital for a host of cellular processes that enable metastasis (Cox et al., 2014). Immortalized breast epithelial MCF10A cells, which we employed above, are convenient for the study of both EMT and oncogenic Ras activation. They can be reproducibly induced to EMT via treatment with the cytokine TGFβ (5 ng/mL) (Zhang et al., 2014). In addition, stable cell lines expressing the oncogene HRasG12V (called “MCF10AT” cells) are available, and can also be induced to EMT with TGFβ (Kim et al., 2014).
Changes in cell morphology (Figure 6A; see Figure S6A for confocal images) and Western blots of vimentin and E-cadherin confirmed that EMT occurred in TGFb-treated cell lines and that MCF10AT cells had increased Ras signaling (Figure 6B). MCF10A cells showed a Sia-determined tubule width of 177 ± 4 nm, which increased to 201 ± 6 nm upon EMT (p < 0.005, N = 40 and 62, respectively). MCF10AT and MCF10AT + TGFβ cells had similar Sia-determined tubule widths of 217 ± 5 and 212 ± 6 nm, respectively (Figure 6C; see Figure S6C for SR reconstructions). Lipid-determined widths once again confirmed that these differences arose from the glycocalyx and not tubule size (Figure 6D and Figure S6E).
Figure 6. Glycocalyx height increases upon transformation.

(A) Bright field images of MCF10A and MCF10AT cells with and without TGFβ treatment for > 7 days. Changes in gross morphology upon transformation are visible. (B) Western blot analysis of epithelial to mesenchymal transition (EMT) in MCF10A and HRasG12V transduced MCF10A (MCF10AT) cells. pErk signaling increases in MCF10AT cells as expected from stable expression of HRasG12V. Vimentin increases and E-Cadherin decreases in TGFβ treated MCF10A cells. Vimentin increases in TGFβ treated MCF10AT cells, with E-Cadherin below detection by blot. (C) MCF10A and MCF10AT with or without TGFβ treatment were Sia-labeled and measured as in Figure 4A. (D) Lipid-determined tubule widths for MCF10A and MCF10AT+TGFβ, the cells with the lowest and highest Sia-measured glycocalyx height, respectively. (E) Bright field images of iKras-1 and -2 cells with and without dox treatment for > 7 days. Changes in gross morphology upon transformation are visible. (F) Western blot analysis of iKras lines. Dox removal decreases oncogenic Ras signaling, as evidenced by pErk both iKras-1 and iKras-2. (G) iKras-1 and iKras-2 cells with and without dox treatment were labeled for Sia and measured as in Figure 4A. (H) Lipid-determined tubule widths for iKras-1 and iKras-2 cells with and without dox treatment.
The increase in glycocalyx height upon HRasG12V expression (compare MCF10A to MCF10AT) was the largest magnitude effect (Figure 6C, p < 0.0005) and TGFβ treatment of MCF10AT cells did not increase glycocalyx height. However, this did not necessarily imply that the effects on glycocalyx height were strictly oncogenic Ras-dependent, as MCF10A and MCF10AT are different cell lines. We therefore turned to two cell lines isolated by Ying and colleagues from a doxycycline (dox)-inducible KrasG12D pancreatic ductal adenocarcinoma (PDAC) mouse model (Ying et al., 2012). KRAS is mutated in 90% of human PDACs and has been implicated as a driver of disease progression (Lennerz and Stenzinger, 2015). Consistent with these previous reports, Ying et al.’s cell lines, called iKras-1 and iKras-2, are dependent on dox for tumorigenicity in the mouse. After dox removal, expression of the active KRASG12D transgene is extinguished, changing cell morphology (Figure 6E; see Figure S6B for confocal images), decreasing KRAS pathway activation (Figure 6F) and slowing cellular growth without impacting viability (Ying et al., 2012). Ying and colleagues performed transcriptomic analysis on iKras-1 and -2, focusing on the effects of oncogenic KRAS activation on energy metabolism. Strikingly, when we examined gene set enrichment analysis for iKras-1 and -2, we found that O-glycan and N-glycan biosynthesis gene sets are strongly downregulated upon dox removal (top third and fourth hits, respectively, when sorted by normalized enrichment score). We therefore hypothesized that removal of dox from iKras-1 and -2 cell lines might affect glycocalyx height.
We measured the Sia-determined tubule width of iKras-1 and -2 cell lines with and without dox, and found a significant decrease in both cases, 180 ± 6 nm versus 130 ± 6 and 204 ± 7 nm versus 167 ± 10, respectively (p < 0.0005 and p < 0.005, respectively, N = 26-60) (Figure 6G; see Figure S6D for SR reconstructions; see Figure 6H and Figure S6F for lipid-azide stain). This represents the first experimental evidence for a direct link between a bulk property of the glycocalyx and expression of an oncogene.
GALNT7 is upregulated in KRAS-positive human PDAC and may contribute to glycocalyx height
KRAS is a master transcriptional regulator, but is not capable of direct glycosylation activity. We were curious whether the effects of oncogenic KRAS on glycocalyx height could be ascribed to individual effector genes under KrasG12D control. We re-analyzed Ying et al.’s microarray data (Ying et al., 2012) to generate a list of genes enriched in the dox-on conditions. Since replicates were not available for iKras-1 and iKras-2 measurements, we took iKras-1 and -2 with dox as one group and iKras-1 and -2 without dox as a separate group for analysis (cf. Methods). A total of 47 genes were enriched in pathways that relate to glycosylation, including O- and N-glycan biosynthesis, glycosphingolipid biosynthesis, and O-linked glycosylation of mucins (Figure 7A and Supplemental Table 1).
Figure 7. GALNT7 is upregulated with oncogenic Ras activation and contributes to glycocalyx bulk.

(A) Genes from the KEGG- and Reactome-O-glycosylation pathways that are significantly upregulated in dox-treated iKras-1 and iKras-2 cells compared to dox-removed iKras-1 and iKras-2 cells. (B) Genes from the list shown in (A) in which high mRNA transcript levels (top vs. bottom quartiles) show a significant correlation with poor patient survival in pancreatic adenocarcinoma (PDAC). Ranks in columns 2 and 3 derive from transcriptomics data of iKras-1 and -2, while p-values in column 4 are from patient data. (C) Kaplan-Meier plots for patients with PDAC tumors that show high expression (red curves) and low expression (blue curves) of Kras (left) or GALNT7 (right) (top vs. bottom quartiles, respectively). The inset shows the overlay of the curves for high expression of Kras and GALNT7. (D) Dox-treated iKras-1 and -2 cells were subjected to siRNA-mediated knockdown (KD) of GALNT7. Control cells were transfected with a control pool of siRNA not targeting any mouse or human genes. Sia-labeling and subsequent measurement was performed as in Figure 4A. (E) Lipid-determined tubule widths for dox-treated iKras-1 and -2 cells with and without siRNA-mediated KD. (F) Upon EMT and oncogenic Ras expression, the height of the glycocalyx increases, and the resulting bulky glycocalyx contributes to tumor progression.
We correlated mRNA transcript levels of these 47 genes to survival data in human PDAC patients (Anaya, 2016). Seven of the 47 genes gave logrank p-values less than 0.05 with higher expression predicting lower survival (top vs. bottom quartiles, Figure 7B). One of these genes, GALNT7, exhibited a Kaplan-Meier curve that was strikingly similar in development to the Kaplan-Meier curve for KRAS, especially in high expressing patients (N = 43, top vs. bottom quartiles, Figure 7C and inset). This similarity suggests that GALNT7 could be relevant to the progression of KRAS positive PDAC tumors in humans.
GALNT7 encodes polypeptide GalNAc transferase-7 (ppGalNAc-T7), which is a member of a family of Golgi-resident proteins that catalyze transfer of initiating GalNAc residues to sites of O-glycosylation on proteins. Little is known about ppGalNAc-T7’s substrate specificity, other than its preference for previously O-glycosylated substrates (Bennett et al., 1999). ppGalNAc-T7 has been linked to cancer progression, though the literature is conflicting on its role as a tumor suppressor or promoter (Gaziel-Sovran et al., 2011; Peng et al., 2012). Regardless, its activity has been experimentally linked to alterations in cell surface glycosylation (Gaziel-Sovran et al., 2011). In PDAC, over-glycosylation on cell surfaces and in the extracellular matrix is a driver of disease progression through bulk mechanisms such as elevated interstitial pressure (Provenzano et al., 2012). Therapeutic strategies targeting this bulky glycosylation currently employ intravenous injection of a glycan-degrading enzyme and are undergoing Phase III clinical trials with PDAC patients (Wong et al., 2017). We hypothesized that increased GALNT7 expression might drive increased cell surface glycosylation in iKras-1 and -2 cell lines, resulting in a larger glycocalyx.
We performed siRNA-mediated knockdown (KD) of GALNT7 in iKras-1 and -2 cell lines expressing KrasG12V (dox added) (Figure S7A). Cells were labeled and analyzed as above, yielding Sia-determined tubule widths of 179 ± 6 (N = 31) for iKras-1 transfected with an untargeted siRNA pool, 160 ± 10 (N = 19) for iKras-1 GALNT7 KD, 180 ± 11 (N = 17) for iKras-2 transfected with an untargeted siRNA pool, and 138 ± 7 (N = 24) for iKRas-2 GALNT7 KD. The decrease in tubule width upon GALNT7 KD was significant for iKras-2 (p < 0.005) and trended in the same direction for iKras-1 (p = 0.09) (Figure 7D; see Figure 7E for lipid-azide stain; see Figures S7B-D for images). These data, taken together with previous observations that glycocalyx thickness contributes to tumor survival and metastasis formation (Paszek et al., 2014; Woods et al., 2017), provide a model in which tumors can actively remodel their glycocalyx in the course of disease progression (Figure 7F). In addition, the direct link between GALNT7 protein levels and bulk on the cell surface motivates further exploration of single gene effectors of extracellular bulk, and may open doors to new therapeutic interventions for PDAC. We note as well that glycocalyx components such as mucins are implicated in nearly every carcinoma subtype, including ovarian, breast, prostate, lung, brain, colorectal, and skin (Pinho and Reis, 2015).
Discussion
An historical gap has existed in the application of advanced imaging methods to the glycocalyx despite the fact that robust and well-established methods were available for specific chemical modification of sugars with small molecule handles (Lakshminarayanan et al., 2018). In our view, this gap was due in part to a longstanding notion that the glycocalyx is a largely unstructured extracellular meshwork that, though ubiquitously present on cellular surfaces, has limited function beyond general protection and adhesion. As has been argued recently, this notion persists despite several lines of evidence to the contrary (Kuo et al., 2018). For example, mucin-domain glycoproteins present on the cell surface have been shown to act as stiff scaffolds around which receptors such as EGFR can organize (Burchell et al., 2018). Multivalent proteins such as the galectin family crosslink glycocalyx components, resulting in local lattice-like formations (Rabinovich and Conejo-García, 2016). And recently, Grinstein and colleagues provided evidence for a model in which the transmembrane hyaluronan-binding receptor CD44 forms ordered transmembrane ‘pickets’ (Freeman et al., 2018). Here, we combined metabolic labeling, bioorthogonal chemistry, and SR microscopy to show that the glycocalyx is a structured cellular compartment that is actively remodeled during oncogenesis and functionally relevant for tumor progression.
Having established and validated labeling and analysis routines, we chose as our first system of study the organization of two sugar populations, GalNAz and Sia, within the glycocalyx. Our studies of cell lines pointed to distal location of Sia relative to GalNAz in a variety of cases. To corroborate and extend the implications of these measurements, we turned to dissociated tumor resections from two ovarian cancer patients. These experiments validated our hypothesis that sialic acids reside distal to GalNAz as a population relative to the plasma membrane using samples with high biological relevance given the requirement for sub-20 nm precision.
SR reconstructions are comprised of single-molecule localizations, corresponding to dense labeled sugars in the glycocalyx. We employed statistical methods to study the distributions of these labeled molecules. The key conclusion from our analyses was that sugars are distributed according to a heterogenous but non-random architecture. The current state-of-the-art in SR microscopy does not yet enable the resolution needed to characterize these non-random distributions further. In the future, better precision from improved dyes may allow additional conclusions to be extracted from the highly crowded glycocalyx.
Finally, we interfaced our novel measurements with datasets generated by orthogonal methods. A full two percent of the protein-encoding human genome is dedicated to glycan synthesis and elaboration (Gilormini et al., 2018). In the past, there have been few methods available to test hypotheses involving such glycocalyx-related hits, thus we suspect they have been often disfavored relative to hits relating to aspects of cellular biology with more readily available phenotypic readouts. We hope our observation that oncogenic KRAS remodels the glycocalyx will stimulate re-examination of omics datasets by others. In addition, we hope it will serve as an impetus for recognition of the glycocalyx as an organelle that is actively remodeled during oncogenesis and functionally relevant for tumor progression.
As a step in this direction, we correlated mRNA levels of glycosylation-related proteins from the iKras transcriptomics data with human PDAC survival data. This analysis revealed that GALNT7 transcripts are upregulated in cell lines expressing KRASG12D, and that siRNA-mediated knockdown of GALNT7 leads to a decrease in glycocalyx height. GALNT7 is therefore a potential mediator of the effect of KRAS on the glycocalyx. These data are consistent with observations that KRASG12D can decrease expression of microRNA-34a (Okada et al., 2014), a microRNA that has been reported in at least one study to decrease GALNT7 transcript levels (Li et al., 2014). Note also that the other hits from the transcriptomics analysis may be worth further exploration. For example, B3GNT3 and GCNT2 are involved in the synthesis of linear and branched poly-N-acetyllactosaminoglycans, large glycans which bind galectin family proteins (Shiraishi et al., 2001; Stowell et al., 2008). ST3GAL1 is a sialyltransferase, which is especially interesting given recent insights into the role surface sialylation plays in immune evasion (Xiao et al., 2016).
Broadly, we envision that future efforts will apply 2D and especially 3D advanced imaging techniques to the elucidation of additional nanoscopic parameters beyond glycocalyx height. The density, clustering, and contact sites of glycans and their interaction partners in the context of both health and disease are especially attractive as future avenues. Samples collected from patients with varying histories and disease progressions or from various sites in a single patient would be excellent targets for such analyses.
STAR Methods
CONTACT FOR REAGENT AND RESOURCE SHARING
Further information and requests for resources and reagents should be directed to and will be fulfilled by the Lead Contact, W.E. Moerner (wmoerner@stanford.edu).
EXPERIMENTAL MODEL AND SUBJECT DETAILS
Cell culture
All cells were grown in T75 flasks (Thermo Fisher Scientific, Waltham, MA) and maintained at 37°C and 5% CO2. BT-20 cells were cultured in DMEM supplemented with 10% FBS and 1% penicillin/streptomycin. SKBR3 cells were cultured in RPMI supplemented with 10% FBS and 1% penicillin/streptomycin. ldlD CHO cells were cultured in 1:1 DMEM/F12 with 3% FBS and 1% penicillin/streptomycin. MCF10A and MCF10AT cells were cultured in phenol red free 1:1 DMEM:F12 supplemented with 5% NZ horse serum (Thermo Fisher Scientific), 20 ng/mL epidermal growth factor (Peprotech, Rock Hill, NJ), 0.5 μg/mL hydrocortisone (Sigma, St. Louis, MO), 100 ng/mL cholera toxin (Sigma), 10 μg/mL insulin (Sigma), and 1% penicillin/streptomycin. iKras-1 and iKras-2 cell lines were cultured in phenol red free RPMI supplemented with 10% Tet System Approved FBS (Takara, Mountain View, CA), 1 μg/mL doxycycline (Applichem, Darmstadt, Hessen, Germany), and 1% penicillin/streptomycin. For EMT studies, MCF10A and MCF10AT were treated with 5 ng/mL TGFβ (Cell Signaling Technology, Danvers, MA) for 1 week, then split into new flasks with complete media lacking TGFβ. For oncogenic Ras inactivation studies, iKras-1 and iKras-2 cells were lifted with trypsin, washed three times in suspension with PBS, and then seeded into fresh plates containing complete media without doxycycline. Cells were passaged in doxycycline-free media for one week prior to use for Western blot and imaging. For imaging, cells were seeded at a density of 10,000 cells/well on Lab-Tek™ II Chambered Coverglass (Thermo Fisher Scientific) coated with 0.01% poly-Lysine (Sigma). For flow cytometry, cells were seeded in 24-well plates (Thermo Fisher Scientific).
Extraction and processing of human tissue samples
Human ovarian tumor samples were obtained from the Department of Obstetrics and Gynecology under the approved IRB protocol 13939. Informed consent from patients was obtained prior to surgery for their tissue to be used in scientific research. Samples were transported and dissected within an hour of removal. Both OC213 and OC215 were obtained from chemotherapy-naive patients diagnosed with High-Grade Serous Cancer (HGSC). The omentum-localized metastasis of Patient 213 was resected concurrently to the primary tumor and processed in parallel. Samples were washed with Dulbecco’s PBS (DPBS), and excessive connective and vascular tissue was removed. Tissues were subsequently transferred to separate 5-mL Eppendorf tubes and dissociated to single cell suspension using the Miltenyi human tumor dissociation kit (130-095-929, Miltenyi Biotech). Single cells were resuspended in Advanced DME-F12 Media (ADF) (Invitrogen), 12 mM HEPES, 1% GlutaMAX (Invitrogen), 5% FCS (Atlanta Biologicals), supplemented with 10 ng/ml human EGF (Invitrogen), 9 mM ROCK inhibitor (Y-27632, Sigma) and 1% penicillin/ streptomycin (Invitrogen), seeded in Matrigelcoated cell culture flasks and kept at 37°C, 5% CO2 in a humidified incubator. Similarly, metastatic tumor cells were collected from omental tissue and cultured as above. Epithelial cells were detached with trypsin (Gibco), centrifuged (10 min at 4 °C, 300g) and seeded in 250 μL of ADF media in pre-warmed, Matrigel-coated, 8-well Nunc Lab-Tek chamber slides (Thermo Scientific) at a density of 5,000 cells per well.
METHOD DETAILS
Labeling
Metabolic incorporation of GalNAz and Cu-click
Two hours after seeding cells, media was supplemented with Ac4GalNAz (Life Technologies, Carlsbad, CA) at a concentration of 50 μM (from a 25 mM stock solution in DMSO). Two days after seeding, cells were moved to 4°C and washed three times with cold DPBS. DPBS with Ca2+ and Mg2+ was used at all steps during the labeling protocol to avoid cell lifting. Immediately after washing, Cu-click conjugation with AlexaFluor-647-alkyne (Life Technologies) was performed. For this, the cells were incubated with 50 μM CuSO4 (Sigma), 250 μM BTTAA (Click Chemistry Tools, Scottsdale, AZ), 1 mM aminoguanidine (Sigma), 2.5 mM sodium ascorbate (Sigma), and 25 μM AlexaFluor-647-alkyne (Life Technologies) in DPBS for 5 min at 4°C in the dark as reported previously (Hong et al., 2010). Cells were then washed five times with cold DPBS, and fixed with 4% paraformaldehyde (Thermo Fisher Scientific) and 0.2% glutaraldehyde (Sigma) in DPBS for 30 min at room temperature. These stringent fixation procedures prevent membrane fluidity post fixation (Tanaka et al., 2010).
Periodate labeling of sialic acids
Sialic acids (Sia) were labeled as described previously (Zeng et al., 2009). Briefly, cells were moved to 4°C, then washed three times with cold DPBS + Ca2+ and Mg2+ followed by a 5 minute incubation with 1 mM sodium periodate (Sigma) in DPBS. Next, the periodate was quenched by 1 mM glycerol in cold DPBS, and washed three times with cold DPBS. Samples were stained with 25 μM AlexaFluor-647-hydoxylamine (Thermo Fisher Scientific) in the presence of 10 mM aniline in sterile filtered DPBS + 5% FBS pH 6.7 for 30 min at 4°C in the dark with gentle agitation. Cells were washed five times with cold DPBS, and fixed as above.
Two-color labeling of GalNAz and sialic acids
Two-color samples were treated with 50 μM Ac4GalNAz two hours after seeding, as described above. Two days later, sialic acid labeling was carried out as described above. After the incubation with AlexaFluor-647-hydroxylamine or CF568-hydroxylamine (Sigma) plus aniline, samples were washed five times with cold DPBS + Ca2+ and Mg2+, and GalNAz was labeled by Cu-catalyzed click chemistry as described above, using either CF568-alkyne (Biotium, Fremont, CA), or AlexaFluor-647-alkyne. The samples were again washed five times with cold DPBS + Ca2+ and Mg2+, then fixed as above. It is essential to add and remove wash solutions gently, to avoid cell lifting during the two-color labeling protocol.
Lipid-azide incorporation and Cu-click
Lipid-azide was incorporated into cell membranes as described previously (Nishimura et al., 2006). Briefly, a stock solution of 16:0 azidocaproyl phosphoethanolamine (Avanti Polar Lipids, Alabaster, AL) was prepared by dissolving the lipid in chloroform to a concentration of 1-4 mg/mL. For labeling a single well, 5 μL of the stock solution was dried carefully under a N2 stream. The lipid was dissolved in 20 μL ethanol, yielding a concentration of 294 μM. 4 μL of the dissolved lipid was then added to 396 μL RPMI 1640 media with 10% FBS to obtain a final lipid concentration of 2.94 μM. Cells were incubated for 15-60 minutes at room temperature. Cells were then moved to 4°C, washed three times with cold DBPS + Ca2+ and Mg2+ and copper-Cu-catalyzed click chemistry followed by fixation was performed as described above.
Super-resolution microscopy
Optical setup
The core of the setup is an inverted microscope (IX71, Olympus, Tokyo, Japan). The lasers used for illumination (200 mW 561 nm, 120 mW 647 nm, CW, Coherent, Santa Clara, CA) were spectrally filtered (561 nm: ff01-554/23-25 excitation filter, 647 nm: ff01-631/36-25 excitation filter, both Semrock, Rochester, NY) and circularly polarized (LPVISB050-MP2 polarizers, Thorlabs, Newton, NJ, 561 nm: WPQ05M-561 quarter-wave plate, Thorlabs, 647 nm: WPQ05M-633 quarter-wave plate, Thorlabs). The beams were expanded and collimated using Keplerian telescopes. Shutters were used to toggle the lasers (VS14S2T1 with VMM-D3 three-channel driver, Vincent Associates Uniblitz, Rochester, NY). To achieve wide-field illumination, the lasers were introduced into the back port of the microscope body via a Kohler lens. The sample was mounted onto a XYZ stage (PInano XYZ Piezo Stage and High Precision XY Microscope Stage, Physik Instrument, Karlsruhe, Germany).
Emitted light from fluorophores was detected by a high NA detection objective (UPLSAPO100XO, x100, NA 1.4, Olympus) and spectrally filtered (Di01-R405/488/561/635 dichroic, Semrock; for far red detection: ZET647NF notch filter, Chroma, Bellows Falls, VT, ET700/75m bandpass filter, Chroma, 3RD650LP longpass filter, Omega Optical, Austin, Texas; for red detection: ZET561NF notch filter, Chroma, et610/60 bandpass filter, Chroma, and FF01-593/40 bandpass filter, Semrock), and focused by the microscope tube lens. The emitted light then entered a 4f imaging system (f = 90 mm) where the first lens was positioned one focal length away from the intermediate image plane. For 3D imaging (see also section on 3D one-color SR microscopy), the desired phase pattern was implemented using transmissive dielectric phase masks (for the DH mask, Double-Helix Optics, LLC, Boulder, CO, and the Tetrapod phase mask was fabricated as described previously (Gustavsson et al., 2018) in the Fourier plane to modulate the phase and encode 3D information into the PSF. For 2D imaging, no phase mask was added. The light was focused onto the EMCCD camera (iXon3 897, Andor, Belfast, UK) by the second lens of the 4f imaging system. For two-color two-channel imaging, the emitted light was split by a dichroic mirror (T660lpxrxt, Chroma), reflecting wavelengths shorter than 660 nm. In both paths, the emitted light passed through a 4f imaging system as described before they were merged again using a D-shaped mirror (BBD1-E02, Thorlabs).
2D one-color SR microscopy
For single-molecule localization microscopy, the DPBS in which the fixed samples were stored at 4°C in dark was replaced by a reducing, oxygen scavenging buffer (Halpern Aaron R. et al., 2015) consisting of 20 mM cysteamine, 2 μL/mL catalase, 560 μg/mL glucose oxidase (all Sigma-Aldrich), 10% (w/v) glucose (BD Difco, Franklin Lakes, NJ), and 100 mM Tris-HCl (Life Technologies). Diffraction-limited imaging was performed at low laser intensity of a few W/cm2 at 647 nm excitation wavelength. Then, the laser intensity was increased to 5 kW/cm2 and image acquisition was started after a short delay needed to convert the majority of the fluorophores into a dark state. Exposure time was 50 ms and the calibrated EM gain was 186. SR reconstructions were reconstructed from approx. 40000 frames using the ImageJ plugin Thunderstorm (Ovesný et al., 2014). Images were filtered with a B-spline filter of order 3 and scale 2.0. Local maxima, i.e. single-molecule signals, were detected with 8-neighborhood connectivity and a threshold of three times the standard deviation of the first wavelet level. Detected local maxima were fitted with a 2D-Gaussian using least squares. Post-processing involved drift correction by cross-correlation, followed by filtering (settings: sigma of the fitted Gaussian < 200 nm; uncertainty of localization < 20 nm). Images were reconstructed as 2D histograms with a bin size of 32 nm, corresponding to a five-time magnification (camera pixel size 160 nm). Figure S5 shows representative examples for the observed background, intensity, and sigma of the single-molecule localizations. Due to high photon counts, low background, and the large number of localizations, it was possible to set a cutoff localization precision at 20 nm to restrict the measurement to high precision.
2D two-color SR microscopy
Dual-labeled samples were stained with CF568 (Biotium) and AF647 (Life Technologies). The oxygen-scavenging buffer was identical to the buffer used for one-color imaging. First, AF647 was imaged as described. Then, the excitation was switched to 561 nm and 20000 to 30000 single-molecule frames were recorded at 30 ms exposure time with a calibrated EM gain of 186, using a laser intensity of 5 kW/cm2. SR reconstructions were generated for both channels using Thunderstorm with identical settings except that CF568 molecules were detected with a threshold of twice the standard deviation of the first wavelet level. The two channels were registered by imaging a dense layer of fluorescent beads visible in both channels, followed by affine transformation using Matlab’s built-in algorithm imregtform. The found transformation matrix was then applied to the respective reconstructed image. To cross-check the transformation, the position of the beads were also super-localized using Thunderstorm, followed by approximate affine transformation and finding the nearest neighbor for each localization in one channel in the other. The control point pairs defined in this way were then used for a local weighted mean geometric transformation. The found transformation matrix was then also applied to the respective reconstructed image. No difference was observed between the two approaches.
3D one-color SR microscopy
3D SR imaging with TILT3D was performed as described earlier (Gustavsson et al., 2018). Briefly, 647 nm light-sheet illumination with ~25 kW/cm2 was used to excite AF647 molecules labeling Sia (introduced via metabolic incorporation of N-azidoacetylmannosamine (ManNAz) and Cu-click chemistry due to lower coverslip background when compared to periodate-based labeling) on the membrane of BT-20 cells in oxygen-scavenging buffer. With the double-helix dielectric phase mask in place, the 3D position of each single molecule was encoded in the recorded camera frames at 50 ms exposure time and a calibrated EM gain of 186. In total, 41000 frames were recorded. Every twentieth frame, a fiducial at the coverslip was imaged using 561 nm epi-illumination at ~10 W/cm2. The 3D position of the fiducial bead was determined with the 6 μm axial range Tetrapod phase mask and used for rough live axial drift correction and fine drift correction in post-processing. Custom scripts were employed to control the camera, stage, and shutters. Calibration and fitting of the Tetrapod fiducial images were performed using a modified version of the Easy-Pupil finder software (https://sourceforge.net/projects/easy-pupil-finder/). Calibration and fitting of double-helix PSF images was done using a modified version of the Easy-DHPSF software (https://sourceforge.net/projects/easy-dhpsf/). The obtained raw localizations were filtered to ensure a lobe distance of 6.1-8.0 pixels between the two lobes of the double-helix PSF. Spurious localizations were removed by means of filtering for large average distance to eight nearest neighbors. ~100000 localizations were used to reconstruct the final 3D SR reconstruction.
Confocal microscopy
Confocal microscopy was performed on a Nikon A1R confocal microscope equipped with a Plan Fluor 60x oil immersion 1.30–numerical aperture objective. This instrument was equipped with a 561-nm green laser and a 639-nm red laser, for CF568 and AlexaFluor-647 excitation, respectively.
Flow cytometry
One-color labeling with each sugar separately was performed on cells exactly as above, with the exception that cells were fixed in suspension after trypsinization. Fixed cells were washed three times with PBS and then analyzed using a BD Accuri C6 flow cytometer.
Western blotting
For pErk, E-Cadherin, Vimentin, and tubulin blots, cells were lysed in 50 mM Tris pH 7.5, 10 mM MgCl2, 0.5 M NaCl, and 2% Igepal (Cytoskeleton, Denver, CO) containing protease inhibitors and phosphatase inhibitors. Lysates were subjected to SDS-PAGE and transferred to nitrocellulose membranes. Primary antibodies were used according to manufacturer recommendations: Phospho-p44/42 MAPK (Erk1/2) (Thr202/Tyr204) (20G11) (Cell Signaling Technology), E-Cadherin (4A2) (Cell Signaling Technology), Vimentin (D21H3) (Cell Signaling Technology), and α-Tubulin (clone B-5-1-2) (Sigma). Secondary antibodies (LI-COR Biosciences, Lincoln, NE) were used according to manufacturer recommendations.
For GALNT7 blots, cells were lysed in Laemmli buffer. Great than 50 μg of lysate was subjected to SDS-PAGE and transferred to nitrocellulose membrane. Anti-GALNT7 antibody (ab97645) (Abcam) was used at 1:200 in PBS containing 0.1% tween after blocking in 5% milk, overnight at 4 °C. Anti-Rabbit secondary antibody (LI-COR Biosciences, Lincoln, NE) was used according to manufacturer recommendations.
siRNA-mediated knockdown of GALNT7
The following reagents were purchased from Dharmacon: SMARTpool: ON-TARGETplus Galnt7 siRNA (L-059912-01-0005), ON-TARGETplus Non-targeting Pool (D-001810-10-05), DharmaFECT 1 Transfection Reagent (T-2001-01), 5X siRNA Buffer (B-002000-UB-100). siRNA transfection was performed with 100 nM Galnt7 pool or 100 nM non-targeting pool, both with 1.5 μl of DharmaFECT 1 per well of a 48-well plate (seeding densitry of 10,000 cells/well). Cells were measured or lysed 96 h post transfection.
Software
Images were reconstructed and visualized in ImageJ using Fiji. 3D SR reconstructions were rendered in Vutara SRX. Data was analyzed using Matlab R2015b and organized as columnar text. Graphs were created in Origin 2016. Images were created in Adobe Illustrator CS6. Flow cytometry data was worked up with Flowjo 10. NIS-Elements AR software (Nikon Inc.) was used to acquire confocal images.
QUANTIFICATION AND STATISTICAL ANALYSIS
Tubule width measurement
To extract tubule width from the 2D SR reconstructions, a custom Matlab routine was used, involving three key steps for each tubule to be analyzed: (i) determination of tubule boundary; (ii) drawing of line profiles perpendicular to the tubule boundary; (iii) fitting of the obtained line profiles. After loading of the 2D SR reconstructions into Matlab, well-resolved tubules were manually selected. These defined regions of interest, each containing one tubule, were stored for individual extraction of tubule width. A two-dimensional Gaussian blur was applied to smooth the edges of the tubule. As the tubules did not exhibit rapid changes in their membrane curvature and the line profiles were drawn perpendicular to the boundary of the tubule (vide infra), this step helped to create a more accurate boundary. This was only used for determination of the boundary – the line profiles were drawn using the original SR reconstruction. The tubule to be analyzed was converted to a binary image using im2bw. The required threshold was set by the user. A broad range of thresholds captured the morphology of the tubule. To exactly trace the tubule boundaries, the function bwboundaries was used. The obtained boundary was interpolated with 10000 points using interppolygon (MathWorks). Then, the start and end point of the tubule were set by the user. Between these two points, 50 line profiles perpendicular to the boundary were drawn using improfile with bicubic interpolation. To aid later visual inspection of the line profiles, the line profiles were centered. Finally, the obtained line profiles were fitted to a double Gaussian using Matlab’s built-in fit function, using least squares regression. The parameter space was unrestricted except for the amplitudes; although the surrounding of tubules typically showed zero to few localizations, we wanted to ensure that no spurious localizations were picked up, potentially affecting the fit. The minimal amplitude of both Gaussians was therefore set to 10% of the maximum of each line profile. At all stages of the analysis, the user received visual feedback, e.g. an overlay of the found boundary and the SR reconstruction of the tubule, the centered line profiles, and the double Gaussian fit. Many tubules on many cells for a given sample were analyzed. The mean of the distribution was reported as tubule width, along with standard error. For these measurements, N represents number of tubules, not number of cells or line profiles.
Quantile-quantile analysis
To compare the experimental distributions to the four model distributions, we adapted a statistical method known as quantile-quantile (QQ) plot (Chambers, 2018). In a QQ plot, the quantiles of two data sets are plotted against each other. If the two sets have the same underlying distribution, a linear trend is observed, that is, the quantiles are maximally correlated. Thus, deviation from linearity indicates that the underlying distributions are different, hence a simple R2 value can be used for comparisons.
First, we selected 11 and 10 well-resolved tubules from Sia and GalNAz labeled BT-20 cells, respectively. The x- and y-positions of the single-molecule localizations within 90×30 nm rectangular windows (N = 400 and 283, respectively) were extracted and projected onto the axis perpendicular to the wall (the x-axis), where the first localization is taken as the origin. We call these one-dimensional localization distributions the “experimental distributions”. Next, we fitted the experimental distributions to a uniform, a Gaussian, an exponential, or a half-Gaussian distribution, respectively. Note that this step only sets the parameters for simulation. The shape of the distributions is not affected, and thus, any combination of parameters will yield a linear trend in a QQ plot as long as the two compared distributions have the same underlying shape (see Figure S15).
To generate the model distributions for comparison, we generated 2000 Gaussian, uniform, exponential, and half-Gaussian distributions that were sampled using the obtained fit parameters and identical numbers of localizations as in each of the experimental windows. Each set of localizations was sampled 2000 times to rule out statistical fluctuations. We call these distributions “ideal distributions”. From the ideal distributions, we created “realistic distributions” to account for two inevitable factors in localization microscopy— overcounting and localization imprecision. The first is counting multiple frames from the same fluorophore as two different localization events, whereas the latter describes the fundamental uncertainty σ in determining the position of the single emitter (in our case σ = 10-20 nm). Thus, we duplicated 30% of the values in the ideal distributions (estimated from merging localizations within a 20 nm radius, one off frame), and then perturbed each simulated localization with a σ value chosen from the probability distribution of σ values of the experimental data.
With this, we moved on to the QQ analysis. For each comparison, we plotted the quantiles of the two considered distributions against each other, fitted a straight line, and calculated the R2 value to determine the linearity of the plot. Finally pairs of R2 values were compared using Student’s two tailed t-test.
Transcriptomics analysis
The following two sample groups were analyzed from the GSE32277 series: GSM799693 (iKras1 +dox) and GSM799694 (iKras2 +doxycline (dox)) vs. GSM799698 (iKras1 -dox) and GSM799699 (iKras2 -dox). Affymetrix CEL files were downloaded from GEO. Background adjustment and quantile normalization followed by median polish were performed, as was the Robust Multi-array Average (RMA) algorithm for RMA expression values (RMAExpress). This was followed by gene set enrichment analysis (GSEA) using the quantile-normalized expression values from GEO for above groups with 1000 gene set permutations against canonical pathways (KEGG, Reactome, Biocarta) for the Affy Mouse430_2 chip.
DATA AND SOFTWARE AVAILABILITY
Authors will provide all raw images and analysis scripts upon reasonable request.
Supplementary Material
Supplementary Table 1, Genes Enriched in Glycosylation Pathways, related to Figure 7.
KEY RESOURCES TABLE
| REAGENT or RESOURCE | SOURCE | IDENTIFIER |
|---|---|---|
| Antibodies | ||
| Phospho-p44/42 MAPK (Erk1/2) (Thr202/Tyr204) (20G11) | Cell Signaling Technology | 4376S |
| E-Cadherin (4A2) | Cell Signaling Technology | 14472 |
| Vimentin (D21H3) | Cell Signaling Technology | 5741 |
| α-Tubulin (clone B-5-1-2) | Sigma | T6074-100UL |
| IRDye® 800CW Goat anti-Mouse IgG (H + L) | LI-COR | 926-32210 |
| IRDye® 800CW Goat anti-Rabbit IgG (H + L) | LI-COR | 926-32211 |
| Anti-GALNT7 | Abcam | ab97645 |
| Bacterial and Virus Strains | ||
| Biological Samples | ||
| Patient-derived primary tumor cells (female) | Lab of Oliver Dorigo (Stanford University) | N/A |
| Chemicals, Peptides, and Recombinant Proteins | ||
| DMEM high glucose | Thermo Fisher Scientific | 11965-092 |
| FBS | Thermo Fisher Scientific | 16000036 |
| penicillin/streptomycin 10000 U/mL | Thermo Fisher Scientific | 15140122 |
| Ham's F-12 Nutrient Mix | Thermo Fisher Scientific | 11765062 |
| NZ horse serum | Thermo Fisher Scientific | 16050130 |
| EGF | PeproTech | AF-100-15-500ug |
| hydrocortisone | Sigma | H0888-1G |
| cholera toxin | Sigma | C9903-1MG |
| insulin | Sigma | 2643-25MG |
| RPMI | Thermo Fisher Scientific | 11875085 |
| Tet System Approved FBS | Takara | 631367 |
| doxycycline | Applichem | A2951,0025 |
| TGFβ | Cell Signaling Technology | 8915LC |
| poly-Lysine | Sigma | P4707-50ML |
| Advanced DMEM/F-12 | Thermo Fisher Scientific | 12634028 |
| HEPES | Thermo Fisher Scientific | 15630080 |
| GlutaMAX | Thermo Fisher Scientific | 35050061 |
| FCS | Atlanta Biologicals | D17051 |
| EGF | Thermo Fisher Scientific | BMS320 |
| ROCK inhibitor | Sigma | Y-27632 |
| Trypsin-EDTA (0.05%) | Thermo Fisher Scientific | 25300054 |
| Ac4GalNAz | Thermo Fisher Scientific | 88905 |
| DPBS | Thermo Fisher Scientific | 14040216 |
| AlexaFluor-647-alkyne | Thermo Fisher Scientific | A10278 |
| Copper(II) sulfate | Sigma | PHR1477 |
| BTTAA | Click Chemistry Tools | 1236-100 |
| aminoguanidine | Sigma | 396494 |
| sodium ascorbate | Sigma | PHR1279 |
| paraformaldehyde | Thermo Fisher Scientific | 28906 |
| glutaraldehyde | Sigma | G5882 |
| Sodium periodate | Sigma | 311448 |
| Glycerol | Sigma | G5516 |
| AlexaFluor-647-hydoxylamine | Thermo Fisher Scientific | A30632 |
| CF568-alkyne | Biotium | 92088 |
| CF568-hydoxylamine | Biotium | 92057 |
| AF568-hydrazide | Thermo Fisher Scientific | A10437 |
| Aniline | Sigma | 242284 |
| 16:0 azidocaproylphosphoethanolamine | Avanti Polar Lipids | 870126P-25mg |
| Cysteamine | Sigma | 30070 |
| Catalase from bovine liver | Sigma | C100 |
| Glucose oxidase | Sigma | G2133-50KU |
| Glucose | BD Difco | 215530 |
| Tris-HCl | Thermo Fisher Scientific | 15567-027 |
| DharmaFECT 1 Transfection Reagent | Dharmacon | T-2001-01 |
| 5X siRNA Buffer | Dharmacon | B-002000-UB-100 |
| Ac4ManNAz | Thermo Fisher Scientific | C33366 |
| Cell Lysis Buffer | Cytoskeleton | CLB01 |
| Critical Commercial Assays | ||
| Miltenyi human tumor dissociation kit | Miltenyi Biotech | 130-095-929 |
| Deposited Data | ||
| Bioinformatic analysis of iKras-1/-2 transcriptomics datasets deposited by Ying et al. (2012), accession numbers GSM799693 (iKras1-C-on), GSM799694 (iKras2-C-on), GSM799698 (iKras1-C-off), GSM799699 (iKras2-C-off). | This paper | Supplementary Table 1 |
| Experimental Models: Cell Lines | ||
| SKBR3 (female) | ATCC | HTB-30 |
| BT-20 (female) | ATCC | HTB-19 |
| iKras-1 (sex not specified) | Lab of Ronald DePinho (MD Anderson Cancer Center) | Ying et al., 2012 |
| iKras-2 (sex not specified) | Lab of Ronald DePinho (MD Anderson Cancer Center) | Ying et al., 2012 |
| MCF10A (female) | Lab of Valerie Weaver (UCSF) | Paszek et al., 2014 |
| MCF10A MUC1ΔCT stable (female) | Lab of Valerie Weaver (UCSF) | Shurer et al., 2017 |
| ldlD CHO cells (female) | Lab of Monty Krieger (MIT) | Kingsley et al., 1986 |
| Experimental Models: Organisms/Strains | ||
| Oligonucleotides | ||
| ON-TARGETplus Galnt7 siRNA | Dharmacon | L-059912-01-0005 |
| ON-TARGETplus Non-targeting Pool | Dharmacon | D-001810-10-05 |
| Recombinant DNA | ||
| Software and Algorithms | ||
| Fiji | NIH | https://fiji.sc |
| ThunderSTORM | Ovesný et al., 2014 | https://github.com/zitmen/thunderstorm |
| Vutara SRX | Bruker | https://www.bruker.com |
| Matlab R2017b | MathWorks | https://www.mathworks.com |
| Origin 2016 | OriginLab | https://www.originlab.com |
| Adobe Illustrator CS6 | Adobe | https://www.adobe.com |
| Flowjo 10 | FlowJo | https://www.flowjo.com |
| NIS-Elements AR | Nikon | https://www.nikonmetrology.com |
| Custom script for tubule width analysis | This paper | Upon request |
| Custom script for QQ analysis | This paper | Upon request |
| Other | ||
Highlights:
Tubules resulting from membrane folding enabled quantification of glycocalyx parameters
The glycocalyx exhibits a nanoscale organization of its component glycans
Glycocalyx height increases in response to oncogenic KRAS activation
This height increase is reduced upon knockdown of a single glycan transferase
Acknowledgments:
We thank Ramesh Nair (Stanford Bioinformatics Core Facility) for performing transcriptomics analysis. We thank Dr. Carl G. Ebeling (Bruker) for the use of the Bruker SRX visualization and analysis software. We thank Valerie Weaver (UCSF) for MCF10A, MCF10A + MUC1ΔCT, and MCF10AT cell lines. We thank Haoqiang Ying (MD Anderson Cancer Center) for iKras-1 and -2 cell lines. We thank Matthew Barnes (UCSF) for helpful discussions. We thank Ryan Flynn (Stanford), Elliot Woods (Stanford), and Matthew Barnes for critical reading of the manuscript.
Funding: This work was supported in part by the National Institute of General Medical Sciences (Grant No. R35GM118067) to W.E.M., by the National Institute of Biomedical Imaging and Bioengineering (Grant No. U01EB021237) to W.E.M., by a grant from the US National Institutes of Health (R01CA227942) to C.R.B., and by a US National Institutes of Health (R37GM058867) to C.R.B. K.P. was supported by a National Science Foundation Graduate Research Fellowship, a Stanford Graduate Fellowship, and the Stanford ChEM-H Chemistry/Biology Interface Predoctoral Training Program. V.K. and O.D. acknowledge support from the Mary Lake Polan Endowment. A.-K.G. acknowledges financial support from the Swedish Research Council (Grant No. 2016-00130) and from the Foundation BLANCEFLOR Boncompagni-Ludovisi, nee Bildt. O.D. and V.K. are supported by the Mary Lake Polan Gynecologic Oncology Endowment for Gynecologic Cancer Research, Stanford School of Medicine, Stanford University.
Footnotes
Publisher's Disclaimer: This is a PDF file of an unedited manuscript that has been accepted for publication. As a service to our customers we are providing this early version of the manuscript. The manuscript will undergo copyediting, typesetting, and review of the resulting proof before it is published in its final citable form. Please note that during the production process errors may be discovered which could affect the content, and all legal disclaimers that apply to the journal pertain.
Competing interests: C.R.B. is a co-founder and Scientific Advisory Board member of Palleon Pharmaceuticals, Enable Bioscience, Redwood Biosciences (a subsidiary of Catalent) and InterVenn Biosciences, and a member of the Board of Directors of Eli Lilly & Company. O.D. has participated in advisory boards for Tesaro, Merck, and Geneos. O.D. is a speaker for Tesaro and AstraZeneca.
References
- Altschuler Y, Kinlough CL, Poland PA, Bruns JB, Apodaca G, Weisz OA, and Hughey RP (2000). Clathrin-mediated Endocytosis of MUC1 Is Modulated by Its Glycosylation State. Mol. Biol. Cell 11, 819–831. [DOI] [PMC free article] [PubMed] [Google Scholar]
- Anaya J (2016). OncoLnc: linking TCGA survival data to mRNAs, miRNAs, and lncRNAs. PeerJ Comput. Sci 2, e67. [Google Scholar]
- Bennett EP, Hassan H, Hollingsworth MA, and Clausen H (1999). A novel human UDP-N-acetyl-D-galactosamine:polypeptide N-acetylgalactosaminyltransferase, GalNAc-T7, with specificity for partial GalNAc-glycosylated acceptor substrates. FEBS Letters 460, 226–230. [DOI] [PubMed] [Google Scholar]
- Betzig E, Patterson GH, Sougrat R, Lindwasser OW, Olenych S, Bonifacino JS, Davidson MW, Lippincott-Schwartz J, and Hess HF (2006). Imaging Intracellular Fluorescent Proteins at Nanometer Resolution. Science 313, 1642–1645. [DOI] [PubMed] [Google Scholar]
- Burchell JM, Beatson R, Graham R, Taylor-Papadimitriou J, and Tajadura-Ortega V (2018). O-linked mucin-type glycosylation in breast cancer. Biochemical Society Transactions BST20170483. [DOI] [PMC free article] [PubMed] [Google Scholar]
- Cai E, Marchuk K, Beemiller P, Beppler C, Rubashkin MG, Weaver VM, Gérard A, Liu T-L, Chen B-C, Betzig E, et al. (2017). Visualizing dynamic microvillar search and stabilization during ligand detection by T cells. Science 356, eaal3118. [DOI] [PMC free article] [PubMed] [Google Scholar]
- Chambers JM (2018). Graphical Methods for Data Analysis (CRC Press; ). [Google Scholar]
- Chen J, Gao J, Wu J, Zhang M, Cai M, Xu H, Jiang J, Tian Z, and Wang H (2015). Revealing the carbohydrate pattern on a cell surface by super-resolution imaging. Nanoscale 7, 3373–3380. [DOI] [PubMed] [Google Scholar]
- Connor Y, Tekleab S, Nandakumar S, Walls C, Tekleab Y, Husain A, Gadish O, Sabbisetti V, Kaushik S, Sehrawat S, et al. (2015). Physical nanoscale conduit-mediated communication between tumour cells and the endothelium modulates endothelial phenotype. Nature Communications 6, 8671. [DOI] [PMC free article] [PubMed] [Google Scholar]
- Constantinou PE, Morgado M, and Carson DD (2015). Transmembrane Mucin Expression and Function in Embryo Implantation and Placentation In Regulation of Implantation and Establishment of Pregnancy in Mammals, Geisert RD, and Bazer FW, eds. (Springer International Publishing; ), pp. 51–68. [DOI] [PubMed] [Google Scholar]
- Cox AD, Fesik SW, Kimmelman AC, Luo J, and Der CJ (2014). Drugging the undruggable RAS: Mission Possible? Nat Rev Drug Discov 13, 828–851. [DOI] [PMC free article] [PubMed] [Google Scholar]
- Elgqvist J, Johansson BR, Partheen K, and Danielsson A (2010). Tumor Cure Probability During α-RIT of Ovarian Cancer with Different Radiation Sensitivity. Anticancer Res 30, 2545–2551. [PubMed] [Google Scholar]
- Freeman SA, Vega A, Riedl M, Collins RF, Ostrowski PP, Woods EC, Bertozzi CR, Tammi MI, Lidke DS, Johnson P, et al. (2018). Transmembrane Pickets Connect Cyto- and Pericellular Skeletons Forming Barriers to Receptor Engagement. Cell 172, 305–317.e10. [DOI] [PMC free article] [PubMed] [Google Scholar]
- Frost A, Perera R, Roux A, Spasov K, Destaing O, Egelman EH, De Camilli P, and Unger VM (2008). Structural Basis of Membrane Invagination by F-BAR Domains. Cell 132, 807–817. [DOI] [PMC free article] [PubMed] [Google Scholar]
- Gaziel-Sovran A, Segura MF, Di Micco R, Collins MK, Hanniford D, Vega-Saenz de Miera E, Rakus JF, Dankert JF, Shang S, Kerbel RS, et al. (2011). miR-30b/30d Regulation of GalNAc Transferases Enhances Invasion and Immunosuppression during Metastasis. Cancer Cell 20, 104–118. [DOI] [PMC free article] [PubMed] [Google Scholar]
- Gilormini P-A, Batt AR, Pratt MR, and Biot C (2018). Asking more from metabolic oligosaccharide engineering. Chem. Sci doi: 10.1039/c8sc02241k [DOI] [PMC free article] [PubMed] [Google Scholar]
- Guerrier S, Coutinho-Budd J, Sassa T, Gresset A, Jordan NV, Chen K, Jin W-L, Frost A, and Polleux F (2009). The F-BAR Domain of srGAP2 Induces Membrane Protrusions Required for Neuronal Migration and Morphogenesis. Cell 138, 990–1004. [DOI] [PMC free article] [PubMed] [Google Scholar]
- Gustavsson A-K, Petrov PN, Lee MY, Shechtman Y, and Moerner WE (2018). 3D single-molecule super-resolution microscopy with a tilted light sheet. Nature Communications 9, 123. [DOI] [PMC free article] [PubMed] [Google Scholar]
- Halpern Aaron R, Howard Marco D, and Vaughan Joshua C (2015). Point by Point: An Introductory Guide to Sample Preparation for Single-Molecule, Super-Resolution Fluorescence Microscopy. Current Protocols in Chemical Biology 7, 103–120. [DOI] [PubMed] [Google Scholar]
- Hang HC, Yu C, Kato DL, and Bertozzi CR (2003). A metabolic labeling approach toward proteomic analysis of mucin-type O-linked glycosylation. PNAS 100, 14846–14851. [DOI] [PMC free article] [PubMed] [Google Scholar]
- Hegermann J, Lünsdorf H, Ochs M, and Haller H (2016). Visualization of the glomerular endothelial glycocalyx by electron microscopy using cationic colloidal thorium dioxide. Histochem Cell Biol 145, 41–51. [DOI] [PubMed] [Google Scholar]
- Helenius A, and Aebi, and M. (2001). Intracellular Functions of N-Linked Glycans. Science 291, 2364–2369. [DOI] [PubMed] [Google Scholar]
- Hess ST, Girirajan TPK, and Mason MD (2006). Ultra-High Resolution Imaging by Fluorescence Photoactivation Localization Microscopy. Biophysical Journal 91, 4258–4272. [DOI] [PMC free article] [PubMed] [Google Scholar]
- Hong V, Steinmetz NF, Manchester M, and Finn MG (2010). Labeling Live Cells by Copper-Catalyzed Alkyne–Azide Click Chemistry. Bioconjugate Chem. 21, 1912–1916. [DOI] [PMC free article] [PubMed] [Google Scholar]
- Huang F, Sirinakis G, Allgeyer ES, Schroeder LK, Duim WC, Kromann EB, Phan T, Rivera-Molina FE, Myers JR, Irnov I, et al. (2016). Ultra-High Resolution 3D Imaging of Whole Cells. Cell 166, 1028–1040. [DOI] [PMC free article] [PubMed] [Google Scholar]
- Hudak JE, Canham SM, and Bertozzi CR (2014). Glycocalyx engineering reveals a Siglecbased mechanism for NK cell immunoevasion. Nat Chem Biol 10, 69–75. [DOI] [PMC free article] [PubMed] [Google Scholar]
- Jiang H, English BP, Hazan RB, Wu P, and Ovryn B (2015). Tracking Surface Glycans on Live Cancer Cells with Single-Molecule Sensitivity. Angew. Chem. Int. Ed 54, 1765–1769. [DOI] [PMC free article] [PubMed] [Google Scholar]
- Kalluri R, and Weinberg RA (2009). The basics of epithelial-mesenchymal transition. J Clin Invest 119, 1420–1428. [DOI] [PMC free article] [PubMed] [Google Scholar]
- Kim H, Choi J-A, and Kim J-H (2014). Ras Promotes Transforming Growth Factor-β (TGF-β)-induced Epithelial-Mesenchymal Transition via a Leukotriene B4 Receptor-2-linked Cascade in Mammary Epithelial Cells. J. Biol. Chem 289, 22151–22160. [DOI] [PMC free article] [PubMed] [Google Scholar]
- Kingsley DM, Kozarsky KF, Hobble L, and Krieger M (1986). Reversible defects in O-linked glycosylation and LDL receptor expression in a UDP-GalUDP-GalNAc 4-epimerase deficient mutant. Cell 44, 749–759. [DOI] [PubMed] [Google Scholar]
- Kolata GB (1975). Microvilli: A Major Difference Between Normal and Cancer Cells? Science 188, 819–820. [DOI] [PubMed] [Google Scholar]
- Kuo JC-H, Gandhi JG, Zia RN, and Paszek MJ (2018). Physical biology of the cancer cell glycocalyx. Nature Physics 14, 658–669. [DOI] [PMC free article] [PubMed] [Google Scholar]
- Lakshminarayanan A, Richard M, and Davis BG (2018). Studying glycobiology at the single-molecule level. Nature Reviews Chemistry 2, 148–159. [Google Scholar]
- Lennerz JK, and Stenzinger A (2015). Allelic Ratio of KRAS Mutations in Pancreatic Cancer. Oncologist 20, e8–e9. [DOI] [PMC free article] [PubMed] [Google Scholar]
- Letschert S, Göhler A, Franke C, Bertleff-Zieschang N, Memmel E, Doose S, Seibel J, and Sauer M (2014). Super-Resolution Imaging of Plasma Membrane Glycans. Angew. Chem 126, 11101–11104. [DOI] [PubMed] [Google Scholar]
- Li W, Ma H, and Sun J (2014). microRNA-34a/c function as tumor suppressors in Hep-2 laryngeal carcinoma cells and may reduce GALNT7 expression. Molecular Medicine Reports 9, 1293–1298. [DOI] [PubMed] [Google Scholar]
- Matrosovich MN, Matrosovich TY, Gray T, Roberts NA, and Klenk H-D (2004). Neuraminidase Is Important for the Initiation of Influenza Virus Infection in Human Airway Epithelium. J Virol 78, 12665–12667. [DOI] [PMC free article] [PubMed] [Google Scholar]
- Nishimura SY, Lord SJ, Klein LO, Willets KA, He M, Lu Z, Twieg RJ, and Moerner WE (2006). Diffusion of lipid-like single-molecule fluorophores in the cell membrane. J Phys Chem B 110, 8151–8157. [DOI] [PMC free article] [PubMed] [Google Scholar]
- Okada N, Lin C-P, Ribeiro MC, Biton A, Lai G, He X, Bu P, Vogel H, Jablons DM, Keller AC, et al. (2014). A positive feedback between p53 and miR-34 miRNAs mediates tumor suppression. Genes Dev 28, 438–450. [DOI] [PMC free article] [PubMed] [Google Scholar]
- Ovesný M, Křížek P, Borkovec J, Švindrych Z, and Hagen GM (2014). ThunderSTORM: a comprehensive ImageJ plug-in for PALM and STORM data analysis and super-resolution imaging. Bioinformatics 30, 2389–2390. [DOI] [PMC free article] [PubMed] [Google Scholar]
- Paszek MJ, DuFort CC, Rubashkin MG, Davidson MW, Thorn KS, Liphardt JT, and Weaver VM (2012). Scanning angle interference microscopy reveals cell dynamics at the nanoscale. Nature Methods 9, 825. [DOI] [PMC free article] [PubMed] [Google Scholar]
- Paszek MJ, DuFort CC, Rossier O, Bainer R, Mouw JK, Godula K, Hudak JE, Lakins JN, Wijekoon AC, Cassereau L, et al. (2014). The cancer glycocalyx mechanically primes integrin-mediated growth and survival. Nature 511, 319–325. [DOI] [PMC free article] [PubMed] [Google Scholar]
- Patterson G, Davidson M, Manley S, and Lippincott-Schwartz J (2010). Superresolution Imaging using Single-Molecule Localization. Annual Review of Physical Chemistry 61, 345–367. [DOI] [PMC free article] [PubMed] [Google Scholar]
- Peng R-Q, Wan H-Y, Li H-F, Liu M, Li X, and Tang H (2012). MicroRNA-214 Suppresses Growth and Invasiveness of Cervical Cancer Cells by Targeting UDP-N-acetyl-α-d-galactosamine:Polypeptide N-Acetylgalactosaminyltransferase 7. J. Biol. Chem 287, 14301–14309. [DOI] [PMC free article] [PubMed] [Google Scholar]
- Pinho SS, and Reis CA (2015). Glycosylation in cancer: mechanisms and clinical implications. Nat Rev Cancer 15, 540–555. [DOI] [PubMed] [Google Scholar]
- Provenzano PP, Cuevas C, Chang AE, Goel VK, Von Hoff DD, and Hingorani SR (2012). Enzymatic Targeting of the Stroma Ablates Physical Barriers to Treatment of Pancreatic Ductal Adenocarcinoma. Cancer Cell 21, 418–429. [DOI] [PMC free article] [PubMed] [Google Scholar]
- Rabinovich GA, and Conejo-García JR (2016). Shaping the Immune Landscape in Cancer by Galectin-Driven Regulatory Pathways. Journal of Molecular Biology 428, 3266–3281. [DOI] [PubMed] [Google Scholar]
- Ramya TNC, Weerapana E, Cravatt BF, Paulson JC (2013). Glycoproteomics Enabled by Tagging Sialic Acid- or Galactose-Terminated Glycans. Glycobiology 23, 211–221. [DOI] [PMC free article] [PubMed] [Google Scholar]
- Rust MJ, Bates M, and Zhuang X (2006). Stochastic optical reconstruction microscopy (STORM) provides sub-diffraction-limit image resolution. Nat Methods 3, 793–795. [DOI] [PMC free article] [PubMed] [Google Scholar]
- Shiraishi N, Natsume A, Togayachi A, Endo T, Akashima T, Yamada Y, Imai N, Nakagawa S, Koizumi S, Sekine S, et al. (2001). Identification and Characterization of Three Novel β1,3-N-Acetylglucosaminyltransferases Structurally Related to the β1,3-Galactosyltransferase Family. J. Biol. Chem 276, 3498–3507. [DOI] [PubMed] [Google Scholar]
- Shurer CR, Colville MJ, Gupta VK, Head SE, Kai F, Lakins JN, and Paszek MJ (2017). Genetically Encoded Toolbox for Glycocalyx Engineering: Tunable Control of Cell Adhesion, Survival, and Cancer Cell Behaviors. ACS Biomater. Sci. Eng [DOI] [PMC free article] [PubMed] [Google Scholar]
- Steentoft C, Vakhrushev SY, Joshi HJ, Kong Y, Vester-Christensen MB, Schjoldager KT-BG, Lavrsen K, Dabelsteen S, Pedersen NB, Marcos-Silva L, et al. (2013). Precision mapping of the human O-GalNAc glycoproteome through SimpleCell technology. The EMBO Journal 32, 1478–1488. [DOI] [PMC free article] [PubMed] [Google Scholar]
- Stowell SR, Arthur CM, Mehta P, Slanina KA, Blixt O, Leffler H, Smith DF, and Cummings RD (2008). Galectin-1, -2, and -3 Exhibit Differential Recognition of Sialylated Glycans and Blood Group Antigens. J. Biol. Chem 283, 10109–10123. [DOI] [PMC free article] [PubMed] [Google Scholar]
- Tanaka KAK, Suzuki KGN, Shirai YM, Shibutani ST, Miyahara MSH, Tsuboi H, Yahara M, Yoshimura A, Mayor S, Fujiwara TK, et al. (2010). Membrane molecules mobile even after chemical fixation. Nat Meth 7, 865–866. [DOI] [PubMed] [Google Scholar]
- Varki A (2017). Biological roles of glycans. Glycobiology 27, 3–49. [DOI] [PMC free article] [PubMed] [Google Scholar]
- Varki A, Cummings RD, Esko JD, Stanley P, Hart JW, Aebi M, Darvill AG, Kinoshita T, Packer N.mH., Prestegard JH, Schnaar RL, and Seeberger PH, ed. (2015). Essentials of Glycobiology (Cold Spring Harbor (NY): Cold Spring Harbor Laboratory Press; ). [PubMed] [Google Scholar]
- Varki A, and Gagneux P (2012). Multifarious roles of sialic acids in immunity. Annals of the New York Academy of Sciences 1253, 16–36. [DOI] [PMC free article] [PubMed] [Google Scholar]
- Whelan DR, and Bell TDM (2015). Image artifacts in Single Molecule Localization Microscopy: why optimization of sample preparation protocols matters. Scientific Reports 5, 7924. [DOI] [PMC free article] [PubMed] [Google Scholar]
- Wong KM, Horton KJ, Coveler AL, Hingorani SR, and Harris WP (2017). Targeting the Tumor Stroma: the Biology and Clinical Development of Pegylated Recombinant Human Hyaluronidase (PEGPH20). Curr Oncol Rep 19, 47. [DOI] [PubMed] [Google Scholar]
- Woods EC, Kai F, Barnes JM, Pedram K, Pickup MW, Hollander MJ, Weaver VM, and Bertozzi CR (2017). A bulky glycocalyx fosters metastasis formation by promoting G1 cell cycle progression. ELife Sciences 6, e25752. [DOI] [PMC free article] [PubMed] [Google Scholar]
- Xiao H, Woods EC, Vukojicic P, and Bertozzi CR (2016). Precision glycocalyx editing as a strategy for cancer immunotherapy. PNAS 201608069. [DOI] [PMC free article] [PubMed] [Google Scholar]
- Ying H, Kimmelman AC, Lyssiotis CA, Hua S, Chu GC, Fletcher-Sananikone E, Locasale JW, Son J, Zhang H, Coloff JL, et al. (2012). Oncogenic Kras Maintains Pancreatic Tumors through Regulation of Anabolic Glucose Metabolism. Cell 149, 656–670. [DOI] [PMC free article] [PubMed] [Google Scholar]
- Zeng Y, Ramya TNC, Dirksen A, Dawson PE, and Paulson JC (2009). High-efficiency labeling of sialylated glycoproteins on living cells. Nat Meth 6, 207–209. [DOI] [PMC free article] [PubMed] [Google Scholar]
- Zhang J, Tian X-J, Zhang H, Teng Y, Li R, Bai F, Elankumaran S, and Xing J (2014). TGF-β–induced epithelial-to-mesenchymal transition proceeds through stepwise activation of multiple feedback loops. Sci. Signal 7, ra91–ra91. [DOI] [PubMed] [Google Scholar]
Associated Data
This section collects any data citations, data availability statements, or supplementary materials included in this article.
Supplementary Materials
Supplementary Table 1, Genes Enriched in Glycosylation Pathways, related to Figure 7.
Data Availability Statement
Authors will provide all raw images and analysis scripts upon reasonable request.