

Abstract
Changes in intracellular Ca2+ concentration ([Ca2+]i) play an important role in the function and plasticity of synapses. We characterized the changes in [Ca2+]i produced by action potentials (APs) along two identified motor terminals found on separate muscle fibers in Drosophila larvae and examined factors that influence the amplitude and duration of the residual Ca2+ signal. We were able to measure Ca2+ transients produced along terminals by both single APs and AP trains using Oregon Green 488 BAPTA-1 and streaming images at 20–50 Hz. The decay of [Ca2+]i after single APs or AP trains was well fit by a single exponential. For single APs, the Ca2+ transient amplitude and decay rate were similar at boutons and bottleneck regions and much smaller at the axon. Also, the amplitude of single-AP Ca2+ transients was inversely correlated with bouton width. During AP trains, the increase in [Ca2+]i became more uniform: the difference in boutons and axons was reduced, and the increase in [Ca2+]i was not correlated with bouton width. The [Ca2+]i decay τ was directly correlated with bouton width for both single APs and AP trains. For one terminal, distal boutons had larger single-AP Ca2+ transients than proximal ones, probably attributable to greater Ca2+ influx for distal boutons. Pharmacological studies showed that Ca2+ clearance from these synaptic terminals after single APs and AP trains was primarily attributable to Ca2+ extrusion by the plasma membrane Ca2+ ATPase (PMCA). Immunostaining of larval muscle fibers showed high levels of the PMCA at the neuromuscular junction.
Keywords: Drosophila, pump, Ca2+, synapse, neuromuscular junction, axon terminal
Introduction
Ca2+ plays a particularly important role at the presynaptic terminal. Ca2+ enters through voltage-dependent channels producing a brief, localized increase in intracellular Ca2+ concentration ([Ca2+]i) at the channel mouth. At these Ca2+“domains,” relatively high [Ca2+]i triggers exocytosis of neurotransmitter (Zucker, 1996). The Ca2+ domains collapse within milliseconds and Ca2+ equilibrates in synaptic boutons. This “residual” Ca2+ serves multiple functions, one of which is the facilitation of subsequent transmitter release (Delaney et al., 1989; Kamiya and Zucker, 1994; Atluri and Regehr, 1996). Numerous studies have examined this volume-averaged residual Ca2+ because of its role in synaptic plasticity and as an indirect measurement of Ca2+ influx.
The amplitude and duration of the residual Ca2+ signal is likely to be related to synaptic terminal geometry. For single action potentials (APs), the amplitude of Ca2+ transients should be inversely related to synaptic bouton diameter if Ca2+ current density and Ca2+ buffering are uniform. This was found to be true for dentate gyrus cells (Jackson and Redman, 2003) but not for synaptic boutons in the rat neocortex (Koester and Sakmann, 2000). The rate of [Ca2+]i decay should be inversely related to bouton diameter if [Ca2+]i decay is attributable to Ca2+ extrusion and the density of Ca2+ efflux is homogenous. This was true for dentate gyrus cells in which the [Ca2+]i decay τ was positively correlated with bouton diameter (Jackson and Redman, 2003). In contrast, the increase in [Ca2+]i during AP trains might not depend on bouton size. The [Ca2+]i plateau likely occurs when the rates of Ca2+ influx and extrusion are equal, i.e., an increase in [Ca2+]i during an AP train increases the Ca2+-extrusion rate according to Michaelis–Menten kinetics until a steady state is reached (Tank et al., 1995). If the density of Ca2+ influx and efflux were uniform, then they should be scaled equally by bouton size, and the [Ca2+]i plateau would be independent of bouton size. Also, Ca2+ diffusion during prolonged AP trains could equalize [Ca2+]i at adjacent boutons.
Changes in [Ca2+]i can be measured at identified motor terminals in Drosophila larvae (Macleod et al., 2002). Ca2+ dynamics along these terminals have not been fully characterized, although a recent study proposed that distal boutons had greater Ca2+ influx than more proximal ones (Guerrero et al., 2005). In addition, it is not known what is responsible for extruding Ca2+ from these terminals. At other synaptic terminals, there is evidence for Ca2+ extrusion by the Na/Ca exchanger and/or the plasma membrane Ca2+ ATPase (PMCA) (Mulkey and Zucker, 1992; Reuter and Porzig, 1995; Morgans et al., 1998)
We examined the Ib terminals on muscle fibers 4 and 6 in Drosophila larvae and found an inverse relationship between bouton width and the increase in [Ca2+]i for single APs but not for AP trains. The [Ca2+]i decay τ after single APs and AP trains was directly correlated with bouton width. Pharmacological studies showed that the decay of [Ca2+]i after single APs and AP trains was primarily attributable to Ca2+ extrusion by the PMCA. This was supported by immunocytochemistry showing high levels of the PMCA at the neuromuscular junction (NMJ).
Materials and Methods
Loading the Ca2+ indicator.
To measure changes in [Ca2+]i, we used the single-wavelength Ca2+ indicator Oregon Green 488 BAPTA-1 (OGB-1) coupled to 10,000 molecular weight dextrans (Kd of 454 nm) (Invitrogen, Carlsbad, CA). The high quantum yield of OGB-1 allowed us to use short exposure times so that we could follow Ca2+ transients produced by single APs. We used the technique developed by Macleod et al. (2002) to load the indicator into the motor terminals of third-instar larvae. Briefly, wild-type (Canton S) larvae were dissected in Schneider's media (Sigma, St. Louis, MO), and the nerve supplying segment 3 was cut. The cut end of the nerve was immediately sucked up into a snug-fitting pipette, and then a small volume of indicator (5 mm) was introduced into the end of the pipette tip using very thin tubing. After 40 min, the nerve was removed from the pipette and the preparation was left at room temperature for another hour. The Schneider's solution was then replaced with HL3 saline (Stewart et al., 1994) containing 1 mm Ca2+ for physiological measurements.
Measurement of [Ca2+]i changes.
The terminals were imaged using an upright, fixed-stage BH2 microscope (Olympus Optical, Tokyo, Japan) equipped with epifluorescence, differential interference contrast, a water-immersion 40× Zeiss (Oberkochen, Germany) lens (numerical aperture 0.75), and a digital cooled-CCD camera (CoolSNAP HQ; Photometrics, Tucson, AZ). Excitation illumination from a 75 W xenon arc lamp was passed through a Lambda-10 Optical Filter Changer (Sutter Instruments, Novato, CA) containing a 480 + 15 nm bandpass excitation filter (Chroma Technology, Brattleboro, VT). Excitation and emission wavelengths were separated with a 500 nm dichroic mirror, and emitted light traveled through a high-pass 515 nm filter. Images were streamed using either 20 ms (image size, 50 × 350 pixels) or 50 ms (image size, 100 × 350 pixels) exposures. Metafluor 6.1 software (Molecular Devices, Palo Alto, CA) was used for image acquisition and to measure fluorescent intensity along the terminal and background fluorescence from the muscle. MetaMorph 6.1 software (Molecular Devices, Palo Alto, CA) was used to produce pseudocolor maps of the percent of ΔF/F0 and measure bouton widths.
During Ca2+ imaging, the nerve was stimulated with a suction electrode connected to an S11 stimulator (Grass Technologies, West Warwick, RI) and EPSPs were recorded from muscle fibers with sharp electrodes using an Axoclamp 2A amplifier (Molecular Devices). pClamp 9.2 software and a Digidata 1200A digitizer (Molecular Devices) were used to trigger the stimulator and acquire EPSPs. It was necessary to determine whether the terminal was an Ib (big boutons) or Is (small boutons) because they have different physiological properties (Lnenicka and Keshishian, 2000). To identify the terminal, it was imaged while recording EPSPs from an adjacent fiber that was innervated by the same axon that supplied the Is terminal. If stimulation of the terminal did not result in a synchronous EPSP in the adjacent fiber, then it was an Ib terminal.
Ca2+ clearance inhibitors.
To block Na/Ca exchange, Na+ was eliminated from the HL3 saline by replacing it with N-methyl-d-glucamine. Because this prevented the generation of APs, the terminals were directly depolarized before and after removing Na+ by delivering 3 ms positive pulses to the nerve with a suction electrode. We added 0.2 μm TTX to block APs in saline with normal Na+. To inhibit the PMCA, the pH was raised to 8.8 in HL3 saline in which HEPES was replaced with Tris (pKa 8.1). Thapsigargin (1 μm) and antimycin A1 (1 μm) were used to block Ca2+ uptake by the endoplasmic reticulum (ER) and mitochondria, respectively (Sigma).
Data analysis.
SigmaPlot 8.0 (SPSS, Plover, WI) was used for data transformation and statistical analysis. The background fluorescence was subtracted from the terminal fluorescence for each image and then percentage of ΔF/F0 was calculated by 100 × (fluorescence − initial fluorescence)/initial fluorescence. Single exponentials were fit to the percentage of ΔF/F0 decay to determine the [Ca2+]i decay time constant (τ). We only report [Ca2+]i decay τ when the fit to a single exponential gave r2 > 0.9 to eliminate noisy measurements; 95% of the single-AP and 87% of the AP train measurements met this criterion. The increase in [Ca2+]i during trains of impulses was measured after the [Ca2+]i increase plateaued by averaging the last 20 measurements of the train. Statistical analyses were performed using linear regressions and t tests.
Western blots and immunocytochemistry.
An antibody against the Drosophila PMCA was produced using the amino acid sequence predicted by the annotated Drosophila PMCA gene CG2165 (http://flybase.bio.indiana.edu). The antibody was generated against the peptide YSKERQFRGLQNRIEGEH (amino acids 151–169) in rabbits and subsequently affinity purified (Quality Controlled Biochemicals, Hopkinton, MA).
For Western blots, nervous system proteins were separated by SDS-PAGE and electroblotted to nitrocellulose membranes (Laemmli, 1970; Towbin et al., 1979). Briefly, brains were isolated from third-instar larvae and homogenized in loading buffer containing reducing agent. SDS-PAGE was performed using NuPage 10% Bis–Tris polyacrylamide gels in 3-(N-morpholino)-propanesulfonic acid buffer. After transferring proteins to nitrocellulose membranes (Invitrogen), the membrane was incubated overnight (4°C) in PMCA antibody (1:5000), followed by goat anti-rabbit IgG conjugated to HRP (Biogenesis, Kingston, NH). Antibodies were detected using enhanced chemiluminescence (GE Healthcare, Little Chalfont, UK) and Kodak BioMax XAR film (Fisher Scientific, Pittsburgh, PA)
To determine whether the PMCA was present at the motor terminals, third-instar larvae were dissected and fixed in 4% formaldehyde for 1 h. The fixed larvae were incubated overnight (4°C) in anti-PMCA (1:200), followed by Alexa Fluor 488 goat, anti-rabbit IgG (1:200; Invitrogen). Motor terminals were viewed through an Olympus Optical BHS epifluorescence microscope using a 480 + 15 nm bandpass excitation filter, a 500 nm dichroic mirror, and a high-pass 515 nm emission filter. Alternatively, the stained terminals were imaged using a Zeiss LSM 510 confocal microscope with a 488 nm laser and a high-pass 505 nm emission filter.
Results
Measurement of Ca2+ transients produced by single APs
We recorded the changes in [Ca2+]i produced by single APs and trains of APs along motor terminals in Drosophila larvae. For most of these studies, we chose the Ib terminals on muscle fiber 4 (mf4–Ib) because this terminal normally lies entirely on the dorsal surface of the fiber and it can usually be viewed in a single plane of focus. Also, the Ib and Is terminals on muscle fiber 4 normally do not overlap, and therefore it was easy to follow a single terminal. This was not the case for many of the fibers: the Is and Ib terminals on muscle fiber 6 intertwine, making it very difficult to follow a single terminal for its entire length, and these terminals often run along the edge of the muscle so that they cannot be viewed in a single focal plane.
In previous Ca2+ imaging studies, images were acquired at low rates that allowed the measurement of [Ca2+]i during AP trains but not during single APs. Single-AP Ca2+ transients were measured using techniques (such as confocal line scans) that allowed sampling at higher rates but provided little spatial information. These studies used a broad range of sampling rates, e.g., 33 Hz at the rat calyx of Held (Borst et al., 1995) to 14.5 kHz for lizard motor terminals (David et al., 1997). We were able to measure single-AP Ca2+ transients in larval motor terminals by acquiring images at 20–50 Hz (Fig. 1).
Figure 1.
Pseudocolor map of ΔF/F0 along a synaptic terminal during a single AP. Images of the mf4–Ib terminal were acquired at 50 Hz (20 ms exposure) beginning at the top and spanning 300 ms. The images show a rapid increase in ΔF/F0, followed by a slower decline. Ten APs were averaged so that each frame represents the average of 10 images. Pseudocolor calibration shows ΔF/F0.
The effect of sampling rate on the single-AP Ca2+ transients was examined by comparing 20 and 50 Hz sampling rates at the same boutons (Fig. 2, top). We found that the measurement of the peak increase in [Ca2+]i was more sensitive to the sampling rate than the rate of [Ca2+]i decay. The peak measured at 50 Hz sampling rates (19.7 + 0.9; n = 90) was significantly greater than that measured at 20 Hz sampling rates (16.6 + 0.8; n = 90; p < 0.001, paired t test). Thus, measurements performed at 20 Hz did not capture the true peak of the Ca2+ transients, and we did not combine measurements made at 20 and 50 Hz. We do not know whether 50 Hz sampling underestimates the peak; however, the conclusions in this paper were based on the relative amplitude of the Ca2+ transients, not the absolute values. The decay of [Ca2+]i after a single AP was well fit by a single exponential, and the time constant (τ) of decay was not significantly different when sampled at 50 Hz (123 + 6 ms; n = 82) and 20 Hz (130 + 8 ms; n = 82; p > 0.10, paired t test). In the remainder of this study, single-AP measurements were made at a 50 Hz acquisition rates unless it was necessary to acquire a larger image.
Figure 2.

Changes in [Ca2+]i produced by single APs and trains of APs. Top, The change in [Ca2+]i produced by a single AP measured at 20 and 50 Hz sampling rates at the same bouton. A single AP produced a rapid rise in [Ca2+]i, followed by a slower decay, which was fit by a single exponential (solid line). When images were captured at 20 Hz, the measured increase in [Ca2+]i was less than that for 50 Hz sampling, but there was no difference in the time constant (τ) of decay. Bottom, The increase in [Ca2+]i produced by a 5 s train of impulses delivered at 20 Hz. The increase in [Ca2+]i quickly reached a plateau and then rapidly decayed at the end of the train. The [Ca2+]i decay was fit by a single exponential (solid line). The correlation coefficient (r) and [Ca2+]i decay τ are given.
To measure changes in [Ca2+]i during trains of APs, we used 20 Hz sampling rates. The decay of [Ca2+]i after a 5 s train of APs delivered at 10 or 20 Hz was well fit by a single exponential (Fig. 2, bottom). This was consistent with a previous study of Drosophila larval motor terminals (Macleod et al., 2002).
The concentration of the Ca2+ indicator can influence the Ca2+ transient. For example, high concentrations of fura-2 reduce the rate of [Ca2+]i increase and decay but not the plateau levels for AP trains in crayfish motor terminals (Tank et al., 1995). In addition, a number of Ca2+ indicators applied at high concentrations were shown to reduce the amplitude and the rate of decay of single-AP Ca2+ transients in synaptic terminals of the rat brain (Borst et al., 1995; Helmchen et al., 1997; Koester and Sakmann, 2000). Our loading technique resulted in some variability in the amount of OGB-1 loaded into the terminals. For example, if we assume that resting [Ca2+]i levels were similar in different terminals and we compare the resting OGB-1 fluorescence, then there was an approximately fivefold range of OGB-1 concentration in the mf4–Ib terminals. Comparing terminals with the highest OGB-1 concentration with those with the lowest, the single-AP Ca2+ transient peak was ∼24% less and the [Ca2+]i decay τ was ∼35% greater. This will increase the variability in our data; however, it will not affect our conclusions because all boutons along a given terminal will be affected equally by the amount of OGB-1 loaded.
Comparison of Ca2+ transients in different terminal regions
For the mf4–Ib terminals, we compared the Ca2+ transients produced at boutons, bottlenecks (region between boutons), and the axon (region proximal to most proximal bouton). The Ca2+ transients produced at the axon were smaller than those seen at boutons for both single APs and trains of APs delivered at 20 Hz (Fig. 3). The pseudocolor map of the increase in [Ca2+]i showed an abrupt drop in [Ca2+]i at the transition from the bouton to the axon for both single APs and AP trains. Combined data showed that the single-AP Ca2+ transient in the axon was only 20% of that in the boutons, and this increased to 60% during 20 Hz stimulation (Fig. 4). In addition, the [Ca2+]i decay τ at the axon after single APs or at the end of a 20 Hz train of APs was two to three times that seen at the boutons.
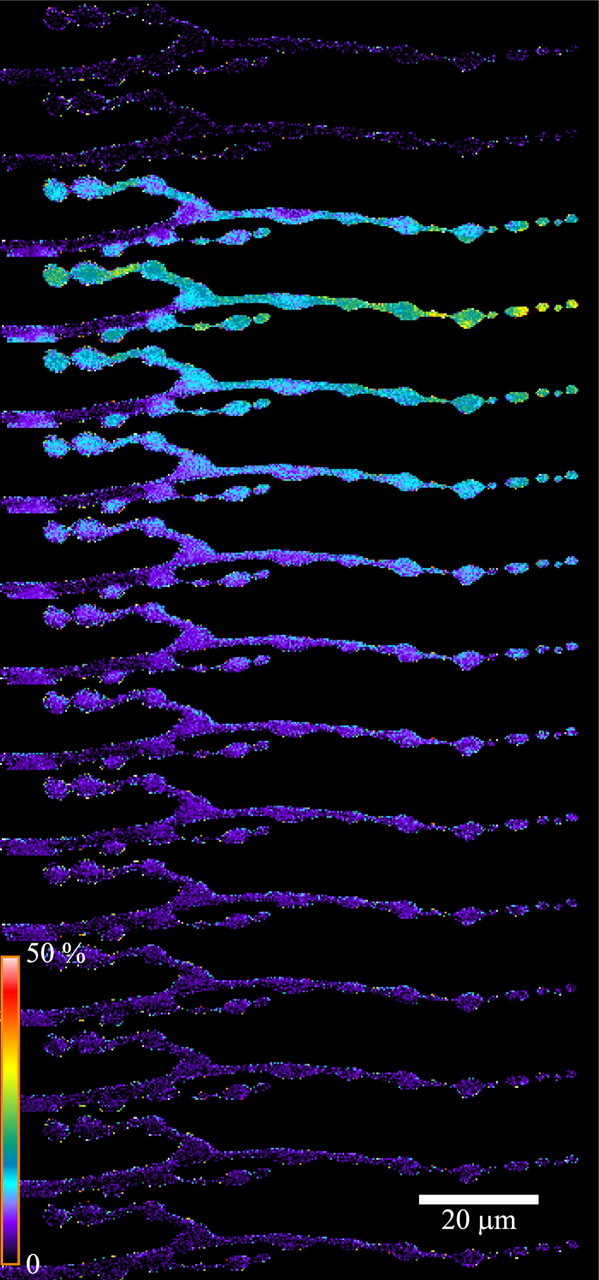
Figure 3.

Pseudocolor map of the increase in [Ca2+]i along the length of an mf4–Ib axon and terminal. The axon exits the nerve seen on the left. The peak increase in [Ca2+]i during a single AP (top) or near the end of a 5 s, 20 Hz train of APs (bottom) was mapped in pseudocolor. For a single AP, the [Ca2+]i increase at the peak of the Ca2+ transient was much greater at the boutons and bottlenecks than at the axon. For the AP train, the increase in [Ca2+]i seen at the plateau was greater for boutons and bottlenecks compared with the axon. Graphs of ΔF/F0 versus time are shown for a bouton, bottleneck, and the axon; the calibration ΔF/F0 and time are shown for each image, and measurements were performed at 20 Hz. There was an abrupt reduction in the [Ca2+]i increase at the axon–bouton border; the increase in ΔF/F0 versus distance at this border was plotted (filled circles) for the 20 Hz train (bottom). The x-axis is distance along the terminal (filled circles are directly above the corresponding position on the terminal), and the y-axis shows ΔF/F0. The pseudocolor calibration bar represents ΔF/F0 for the corresponding images.
Figure 4.
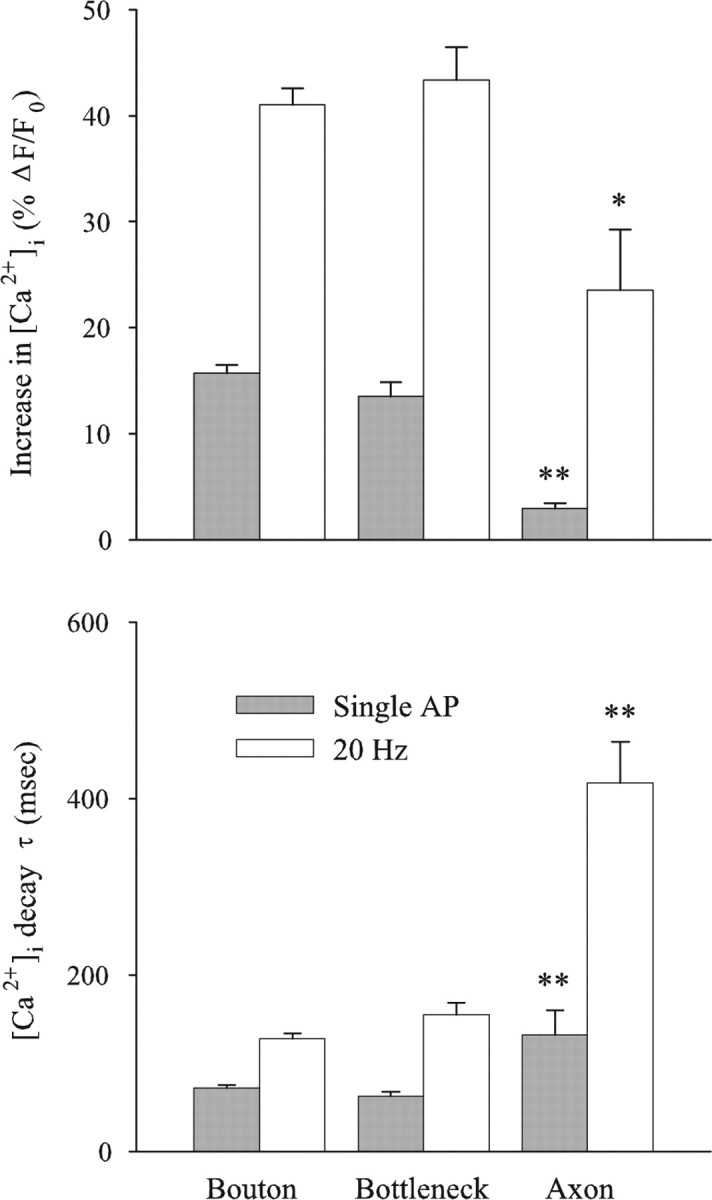
[Ca2+]i increase and decay at bouton, bottleneck, and axonal regions along mf4–Ib terminals. For both single APs and 20 Hz stimulation, the increase in [Ca2+]i was significantly greater at boutons than at axons, but there was no significant difference between boutons and bottlenecks. The [Ca2+]i decay τ was significantly greater at axons than boutons for both single APs and AP trains, but there was no significant difference between boutons and bottlenecks. The data are from four terminals, providing measurements from 67 boutons, 14 bottlenecks, and 4 axons. *p < 0.01; **p < 0.001, significantly different from bouton.
The increase in [Ca2+]i at the bottlenecks was similar to that seen at the boutons (Fig. 3). The combined data showed that the increase in [Ca2+]i produced by single APs and trains of APs as well as the [Ca2+]i decay τ were similar in boutons and bottlenecks (Fig. 4). This indicates that the density of Ca2+ channels at the bottlenecks was more similar to the boutons than the axon. This may be attributable to the presence of synapses in the bottlenecks. Serial EM reconstructions of a larval motor terminals show synapses along the thin portion of the terminal (Meinertzhagen et al., 1998), and the synaptic density was similar in boutons and bottlenecks for a crayfish motor terminal (Lnenicka et al., 1986). However, it is unclear whether Ca2+ influx is correlated with synaptic density because Ca2+ can enter the terminal through channels not associated with active zones (Wu et al., 1999). At sympathetic motor terminals of the mouse vas deferens, single APs produced an increase in [Ca2+]i at interbouton regions, but it was smaller than seen at the boutons (Brain and Bennett, 1997). For pyramidal cells in the rat neocortex, the amplitude of the Ca2+ transient dropped sharply in the first few micrometers of the interbouton region (Koester and Sakmann, 2000).
The effect of bouton size on the amplitude and decay of calcium transients
We examined the effect of bouton size on the Ca2+ transients for the mf4–Ib motor terminal. An increase in the diameter of a spherical bouton or an elliptical bouton would decrease its surface-to-volume ratio. Therefore, if the Ca2+ current density and Ca2+ buffering were similar at large and small boutons, then the Ca2+ transients produced by single APs should be larger at small boutons compared with large boutons. In general, this was the case: APs produced a greater increase in [Ca2+]i in small boutons compared with large boutons (Fig. 5). In addition, boutons and bottlenecks of like width had similar-sized Ca2+ transients. However, the size of the bouton appeared to have less effect on the amplitude of the Ca2+ transient produced by trains of impulses (Fig. 5). These observations were supported by combining mf4–Ib data from multiple preparations and examining the correlation between bouton width and the [Ca2+]i increase (Fig. 6, top). There was a significant negative correlation between bouton width (apparent diameter) and the amplitude of the [Ca2+]i increase produce by single APs; however, this correlation was not significant for the [Ca2+]i increase produced by 10 or 20 Hz stimulation.
Figure 5.
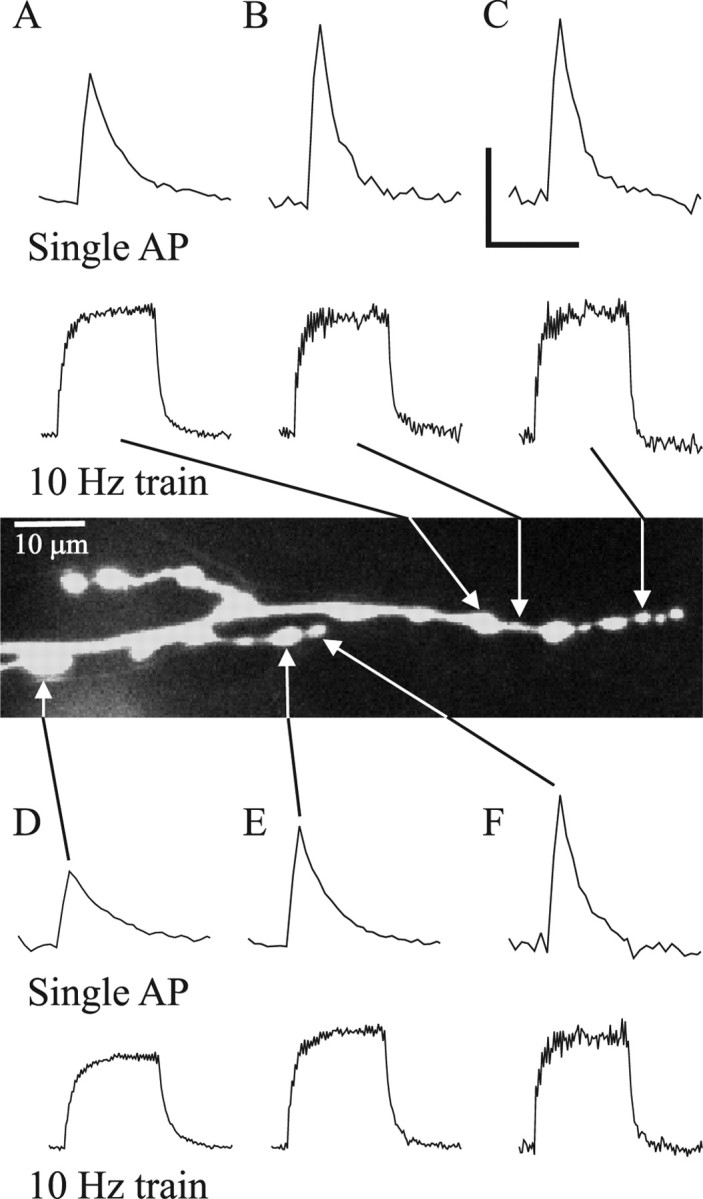
Ca2+ transients for different-sized boutons along an mf4–Ib terminal. The Ca2+ transients for single APs and trains of 10 Hz stimulation are shown for five boutons and a bottleneck. For single APs, the increase in [Ca2+]i and the rate of [Ca2+]i decay was greater for smaller boutons than larger ones. Differences in Ca2+ transient amplitude and decay were seen even for adjacent regions (e.g., A and B or E and F). In addition, bottlenecks and boutons of similar diameter show a similar Ca2+ transient amplitude (e.g., bottleneck B and bouton C). During 10 Hz trains, the increase in [Ca2+]i seen at the plateau was less dependent on bouton size: different-sized boutons show similar increases in [Ca2+]i. The measurements were performed at 50 Hz sampling rates for single APs and 20 Hz for AP trains. This is the same terminal shown in Figure 1. Calibration: single AP, 15% ΔF/F0, 0.3 s; 10 Hz, 30% ΔF/F0, 3.0 s.
Figure 6.

The relationship between bouton size and Ca2+ transients for the mf4–Ib terminal. Data were combined from multiple animals to explore the relationship between bouton width and the [Ca2+]i increase and decay τ. Top, There was a strong negative correlation between bouton width and the increase in [Ca2+]i produced by single APs, but this relationship was not significant for trains of AP delivered at 10 or 20 Hz. Bottom, There was a positive correlation between bouton width and the [Ca2+]i decay τ after single APs or trains of APs. Ca2+ measurements were performed at 50 Hz for single APs and 20 Hz for AP trains. The data were collected from eight animals for the single APs and 10 Hz trains and four animals for the 20 Hz train.
Note that the increase in [Ca2+]i during 20 Hz stimulation (44.8 ± 1.7%; n = 50) was approximately twice that seen during 10 Hz stimulation (23.2 ± 1.0%; n = 111), indicating that OGB-1 was not saturated and ΔF/F0 was linearly related to the change in [Ca2+]i (Fig. 6). A previous study also found no evidence for saturation of OGB-1 during stimulation of Drosophila larval motor terminals at 10 or 20 Hz (Macleod et al., 2002).
The rate of [Ca2+]i decay should also be related to bouton size assuming that decay was predominantly attributable to extrusion and the efflux density was similar at small and large boutons. This appeared true because larger boutons showed a slower rate of [Ca2+]i decay than small boutons (Fig. 5). This was verified by measuring the [Ca2+]i decay τ and bouton width: there was a positive correlation between bouton width and the [Ca2+]i decay τ after single APs or at the end of a train of APs (Fig. 6, bottom).
These differences in Ca2+ transient amplitude and decay were seen even when the different-sized boutons were adjacent. For example, in Figure 5, bouton E (2.9 μm width) had a smaller single-AP Ca2+ transient (17.4% ΔF/F0) and longer [Ca2+]i decay τ (99 ms) than the smaller adjacent bouton F (2.1 μm width): 22.1% ΔF/F0 Ca2+ transient amplitude and 70 ms [Ca2+]i decay τ. During 10 Hz AP train, the [Ca2+]i increase was similar for boutons E (35.7% ΔF/F0) and F (33.9% ΔF/F0), but the [Ca2+]i decay τ was still different for E (216 ms) and F (158 ms). This difference in single-AP Ca2+ transients seen for adjacent boutons was supported by combining data for a number of boutons. We selected pairs of adjacent boutons (boutons separated by no more than a couple micrometers) that had a least a 25% difference in diameter. We found that the larger boutons had a significantly smaller Ca2+ transient amplitude (20.9 ± 2.0% ΔF/F0; n = 11 bouton pairs) and longer [Ca2+]i decay τ (85 ± 1 ms) compared with the smaller boutons (24.2 ± 2.3% ΔF/F0 and 68 ± 1 ms; p < 0.01 paired t test).
To determine whether these findings could be generalized to other terminals, we also examined the Ib terminal on muscle fiber 6 (mf6–Ib). For mf6–Ib terminals, we found a relationship between bouton width and [Ca2+]i increase or decay that was similar to that seen previously for the mf4–Ib terminal (Fig. 7). There was a significant negative correlation between bouton width and the peak increase in [Ca2+]i seen for a single AP, whereas the correlation between bouton width and the increase in [Ca2+]i during a 10 Hz train of APs was not significant. There was a significant positive correlation between bouton width and the [Ca2+]i decay τ after single APs and trains of APs. Although these relationships were significant, overall the correlation was not as strong as seen for the mf4–Ib terminal, possibly attributable to the bouton position effect (below).
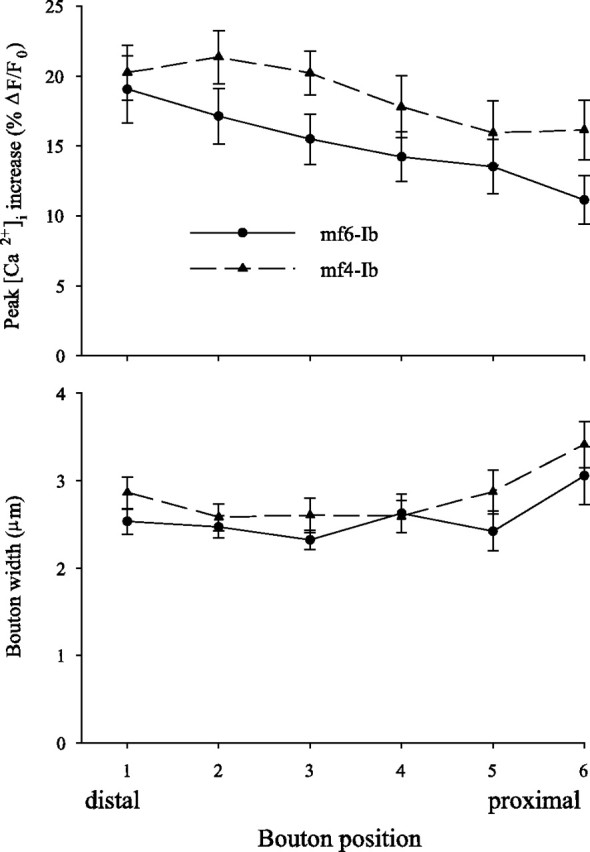
Figure 7.

The relationship between bouton size and Ca2+ transients for the mf6–Ib terminal. The results were similar to the mf4–Ib terminal: there was a significant negative correlation between bouton width and the increase in [Ca2+]i produced by single APs. Also, there was a positive correlation between bouton width and [Ca2+]i decay τ after a single AP or a train of APs delivered at 10 Hz. However, the correlations were not as strong as those seen for the mf4–Ib terminal. Ca2+ measurements were performed at 50 Hz for single APs and 20 Hz for AP trains. Single AP data are from eight animals, and AP train data are from 14 animals.
The effect of bouton position on Ca2+ influx
In a previous study, it was proposed that distal boutons had greater Ca2+ influx than more proximal boutons because they showed a greater increase in [Ca2+]i during AP trains (Guerrero et al., 2005). Because the increase in [Ca2+]i during trains can be influenced by the rate of both Ca2+ influx and efflux (Tank et al., 1995), we further examined this by comparing bouton position and the increase in [Ca2+]i produced by single APs. For the mf6–Ib terminal, the single-AP Ca2+ transient was larger for the distal boutons compared with more proximal ones (Fig. 8). To quantify the effect of bouton position, the increase in [Ca2+]i for single APs versus bouton position was determined in a number of animals. The boutons were numbered from distal to proximal, and only branches with three or more boutons were included in the analysis. The mf6–Ib terminal showed a clear distal-to-proximal gradient (Fig. 9). The effect of bouton position was seen even when only comparing the two most distal boutons: the increase in [Ca2+]i for bouton 1 (19.0 ± 2.4%) was significantly greater than for bouton 2 (17.1 ± 2.0%; n = 21; p = 0.01, paired t test). These differences likely reflect a difference in Ca2+ influx because the width was similar for boutons 1 (2.5 ± 0.1 μm) and 2 (2.5 ± 0.1 μm; n = 21). The Ca2+ transients continue to decline proximally so that the value for bouton 6 was 42% less than bouton 1. However, there was also some increase in bouton width, so the decrease in Ca2+ influx was likely less than the decrease in the Ca2+ transient amplitude.
Figure 8.

Pseudocolor map of a branch of the mf6–Ib terminal showing the relationship between bouton position and the peak increase in [Ca2+]i produced by single APs. The more distal boutons showed a greater increase in [Ca2+]i. A plot of ΔF/F0 versus time is shown for three of the boutons. The pseudocolor calibration represents ΔF/F0.
Figure 9.
The effect of bouton position on the increase in [Ca2+]i produced by a single AP for the mf6–Ib and mf4–Ib terminals. Top, The increase in [Ca2+]i was measured for boutons at different positions along the terminal. The boutons were ordered from distal to proximal, with the most distal bouton along a branch assigned number 1. Bottom, The relationship between bouton position and bouton width. For terminal mf6–Ib, there was a clear distal to proximal decrease in the amplitude of the Ca2+ transient. This was not attributable to differences in bouton size because bouton width was constant at least for the first five boutons. For mf4–Ib terminal, the effect of position was not as great as that seen for the mf6–Ib terminal. Although the most proximal boutons have a smaller increase in [Ca2+]i than the distal ones, this may be attributable to differences in bouton size. The data were taken from 21 branches for mf6–Ib and 15 branches for mf4–Ib.
To determine whether this was a general property of the terminals, we also examined the effect of bouton position for the mf4–Ib terminal (Fig. 9). Here, an effect of bouton position was less apparent. The Ca2+ transients seen at boutons 1 (20.2 ± 1.9%) and 2 (21.3 ± 1.9%; n = 15; p > 0.10, paired t test) were not significantly different. The most proximal boutons appear to show some decline in the Ca2+ transients, e.g., the Ca2+ transient for bouton 6 was 20% less than bouton 1. However, the most proximal boutons were also wider than the distal ones, so this does not represent a clear difference in Ca2+ influx.
The plasma membrane Ca2+ATPase was the major mechanism for Ca2+ clearance after single APs and trains of APs
Ca2+ can be cleared by sequestration into mitochondria or the ER and extrusion by the PMCA or the Na/Ca exchanger. We examined the mechanisms responsible for Ca2+ clearance after single APs and trains of APs using inhibitors of the various known Ca2+ removal mechanisms (Fig. 10).
Figure 10.
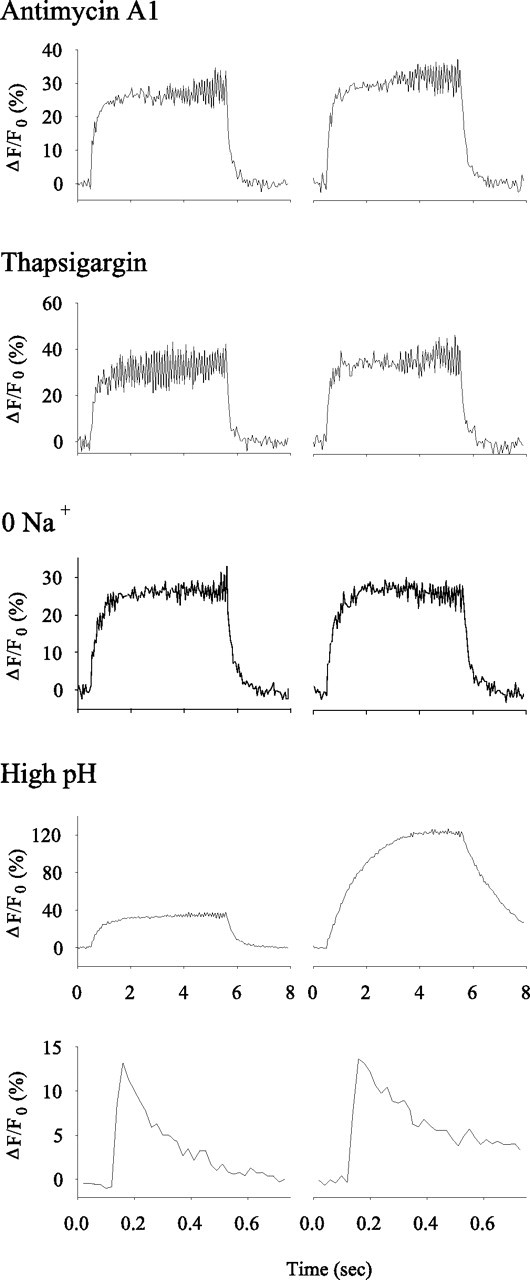
The effect of inhibitors of Ca2+-clearance mechanisms on Ca2+ transients measured from synaptic boutons. The effect of the inhibitor on Ca2+ clearance was examined by comparing the Ca2+ transient in normal saline (left) with that seen after inhibition (right). We inhibited Ca2+ clearance by mitochondria (antimycin A1), ER (thapsigargin), Na/Ca exchange (0 Na+), and the PMCA (high pH). In all cases, the effects of the inhibitors on Ca2+ transients produced by 5 s, 10 Hz trains are shown. For the PMCA, we also show single-AP Ca2+ transients. Inhibiting the PMCA had the greatest effect on Ca2+ clearance.
The role of sequestration in Ca2+ clearance was examined by blocking mitochondrial Ca2+ uptake with antimycin A1 (1 μm) or inhibiting the ER Ca2+ ATPase with thapsigargin (1 μm). Inhibiting mitochondria had no significant effect on the peak increase in [Ca2+]i or the decay of [Ca2+]i (Table 1). Thus, mitochondria do not appear to have a direct effect on Ca2+ clearance at these stimulation parameters. Blocking the ER Ca2+ ATPase had a small but significant effect on Ca2+ clearance (Fig. 10). Although thapsigargin did not affect the increase in [Ca2+]i, it produced a 36 and 52% increase in the [Ca2+]i decay τ for single APs and trains of APs, respectively (Table 1).
Table 1.
The effect of Ca2+-clearance inhibitors on the increase in [Ca2+]i and [Ca2+]i decay for single APs and 10 Hz trains of APs (5 s duration)
| Single AP [Ca2+]i increase (% ΔF/F0) |
Single AP [Ca2+]i decay (ms) |
10 Hz train [Ca2+]i increase (% ΔF/F0) |
10 Hz train [Ca2+]i decay (ms) |
|||||
|---|---|---|---|---|---|---|---|---|
| Inhibitor | Pre | Post | Pre | Post | Pre | Post | Pre | Post |
| Antimycin A1 | 24.4 ± 1.4 | 24.6 ± 1.5 | 67 ± 7 | 79 ± 8 | 40.8 ± 4.2 | 41.0 ± 4.5 | 169 ± 18 | 196 ± 24 |
| n = 17 | n = 19 | |||||||
| Thapsigargin | 23.9 ± 1.2 | 21.3 ± 1.6 | 90 ± 7 | 122 ± 9** | 36.5 ± 2.7 | 29.5 ± 2.1 | 157 ± 11 | 239 ± 19** |
| n = 41 | n = 42 | |||||||
| 0 Na | 29.9 ± 2.0 | 26.1 ± 1.3 | 141 ± 7 | 178 ± 18* | ||||
| n = 31 | ||||||||
| High pH | 15.8 ± 1.5 | 16.5 ± 2.0 | 102 ± 6 | 195 ± 23* | 40.5 ± 2.3 | 94.5 ± 5.8** | 160 ± 12 | 831 ± 120** |
| n = 38 | n = 30 | |||||||
The peak increase in [Ca2+]i and rate of [Ca2+]i decay was measured at the same boutons before and after applying the inhibitors. The values for [Ca2+]i decay represent τ, except for high pH. Here the time to half-decay was measured because the decay was not well fit by a single exponential. The n values represent number of boutons, and each inhibitor was tested on two to four animals. For 0 Na+, no single AP data were presented because the Ca2+ transients were produced by direct depolarization rather than APs. The post-inhibitor mean values were compared with pre-inhibitor means using a paired t test.
*p < 0.01;
**p < 0.001.
The Na/Ca exchanger was blocked by eliminating Na+ from the saline (Fig. 10). Because APs could not be generated in 0 Na+ saline, the terminals were directly depolarized by applying 3 ms positive pulses to the nerve (see Materials and Methods). The amplitude of the pulse was adjusted to give an EPSP amplitude similar to that produced by APs. During 10 Hz stimulation, there was no effect on the increase in [Ca2+]i; however, at the end of stimulation, there was a small (26%) but significant increase in the [Ca2+]i decay τ (Table 1). We also stimulated at frequencies up to 40 Hz and observed results similar to that seen at 10 Hz.
The PMCA was blocked by increasing the pH of the saline to 8.8. Studies of erythrocytes have shown that the PMCA exchanges extracellular proton(s) for intracellular Ca2+ (Niggli et al., 1982; Smallwood et al., 1983; Xu and Roufogalis, 1988), and it can be inhibited by raising the external pH (Kratje et al., 1985; Xu et al., 2000). High pH (8.8) has been used to inhibit the PMCA in squid axons (Dipolo and Beauge, 1982), rat sensory neurons (Benham et al., 1992), and mouse pancreatic β-cells (Chen et al., 2003). The high pH saline had a dramatic effect on the clearance of Ca2+ from the terminal (Fig. 10). For single APs, there was no effect of high pH on the increase in [Ca2+]i, but the time to [Ca2+]i half-decay was increased by 92% (Table 1). For 10 Hz trains, there was a substantial increase in both the [Ca2+]i increase (133%) and the time to [Ca2+]i half-decay (419%). These results clearly show that blocking the PMCA has the greatest effect on Ca2+ clearance.
Anti-PMCA Western blots and immunocytochemistry
To verify that the PMCA was found at the motor terminals, we performed immunocytochemistry on larval neuromuscular preparations. An antibody was produced against the annotated Drosophila PMCA gene CG2165. CG2165 has five predicted protein products with molecular weights ranging from 116 to 131 kDa. We produced a polyclonal antibody against an amino acid sequence (18 residues) that was common to all five proteins. In Western blots, this antibody recognizes two protein bands in larval brain extracts at the expected molecular weight for the PMCA protein (Fig. 11A). At this point, we do not know whether the doublet represents two separate isoforms, a single protein with two phosphorylation states, or a degradation product.
Figure 11.
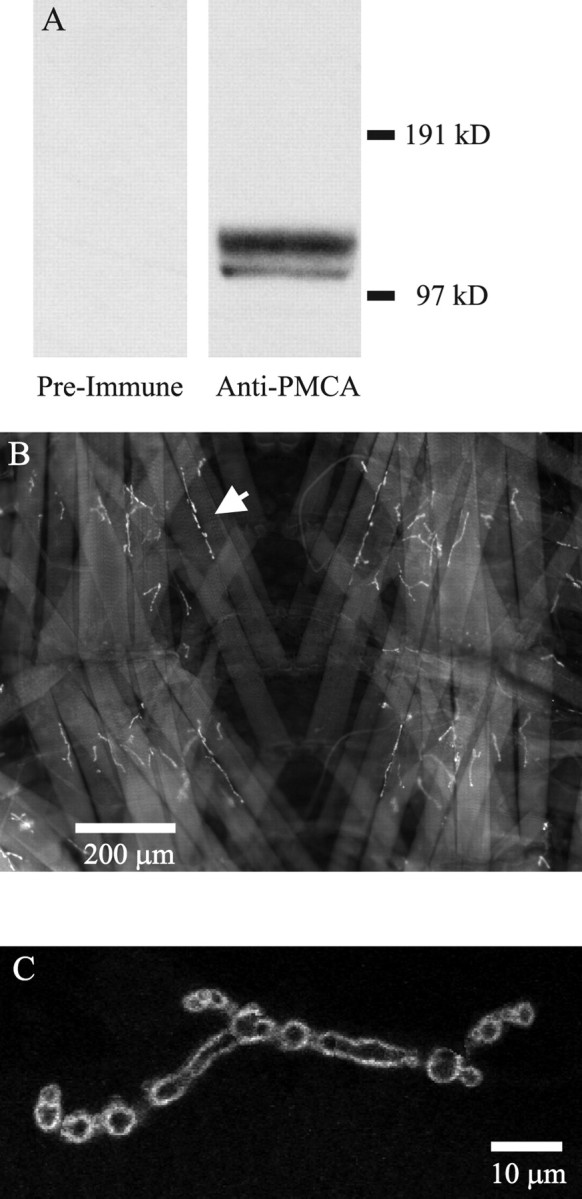
Anti-PMCA Western blot and immunocytochemistry. A, Western blots of Drosophila larval brains probed with preimmune rabbit serum and serum obtained after immunization with an 18 amino acid peptide from the predicted Drosophila PMCA protein. The polyclonal anti-PMCA recognized two bands at the appropriate molecular weight for the PMCA protein. The preimmune serum did not recognize these proteins. Each lane contained protein extracted from five brains. B, Immunostaining of larval body-wall muscle using anti-PMCA. This is a low-magnification view of a portion of the body-wall muscle fibers in segments 3 and 4 after processing the tissue with the anti-PMCA primary antibody and Alexa Fluor 488-labeled secondary antibody. The neuromuscular junctions were brightly stained against much weaker staining of the muscle fibers (an arrow points to 1 neuromuscular junction). The image is centered on the ventral midline of the larval body wall, and the anterior end is at the top of the image. C, A single neuromuscular junction immunostained with anti-PMCA and imaged with confocal microscopy. This image is a montage of optical sections (slice width, ∼0.5 μm) through the center of an mf4–Ib terminal in segment 3. Regions of optical sections that passed through the center of the terminal were pieced together from a stack of 18 optical sections. The staining was confined to the periphery of the motor terminal.
Immunocytochemistry of the larval muscle fibers showed that anti-PMCA staining was localized to the terminal region (Fig. 11B). When the individual motor terminals were viewed, it was apparent that the staining was concentrated in the terminal region and dropped off sharply in the adjacent muscle fiber membrane (Fig. 11C). Also, the staining was confined to the periphery of the terminals as expected for a plasma membrane protein. Finally the staining for the PMCA drops dramatically in the preterminal axon region (data not shown), which was consistent with the slower rate of Ca2+ clearance seen in the axon. We observed similar motor terminal staining when using a monoclonal antibody prepared against the human erythrocyte PMCA (Borke et al., 1989). This staining pattern indicates that the PMCA protein is concentrated in the presynaptic terminals; however, we cannot rule out that PMCA concentrated in the postsynaptic membrane contributes to the observed staining pattern.
Discussion
Comparison of Ca2+ transients in boutons, bottlenecks, and axons
The Ca2+ transient amplitude was smaller in the axon than the boutons; the difference was greater for single APs than for AP trains. Also, there was a sharp decrease in [Ca2+]i at the terminal–axon border, indicating that Ca2+ entering at the terminal was not making a significant contribution to the [Ca2+]i in the axon. This was consistent with modeling studies that predicted that the length constant (λC) for the spread of Ca2+ along cylindrical structures should be relatively short. Longitudinal [Ca2+]i gradients can be predicted using a model analogous to one-dimensional cable theory used for the passive propagation of electrical signals (Zador and Koch, 1994). For a sustained influx of Ca2+ at a localized site, the steady-state λC for [Ca2+]i gradients along an infinite cable is influenced by the radius, Ca2+ diffusion constant, Ca2+ buffer properties, and rate of extrusion. Using standard values for the various parameters, λC was predicted to be 0.9 μm for a cylinder with a 0.5 μm radius and 2.7 μm for a 5.0 μm radius cylinder (Zador and Koch, 1994). This study used an effective diffusion constant of 1.9 μm2/ms, and some studies have estimated the effective diffusion constant as 10 μm2/ms (Tank et al., 1995); using this latter value would approximately double the predicted λC. In either case, the λC would be consistent with the sharp decline in [Ca2+]i that we see at the terminal–axon border.
There appears to be Ca2+ influx at the axon, although it was considerably less that at the terminals. Similar conclusions were reported for the rat calyx of Held in which single APs produced Ca2+ transients in the preterminal axon that were much smaller than in the terminal, and there was a sharp [Ca2+]i gradient at the axon–terminal border (Borst et al., 1995). For the larval axons, the relatively large increase in [Ca2+]i seen during AP trains was likely attributable to a slower rate of Ca2+ extrusion at the axon. At lizard motor terminals, no Ca2+ transient was seen in the axon for single APs; however, there was an increase in [Ca2+]i during trains of APs (David et al., 1997). Here it was proposed that the increase in axonal [Ca2+]i during AP trains was attributable to diffusion from the terminals. Our results suggest that regional differences in Ca2+ influx are matched by differences in Ca2+ clearance; the preterminal axon appears to have both less Ca2+ influx and slower Ca2+ clearance than the synaptic boutons.
The relationship between bouton size and the amplitude and decay of Ca2+ transients
For both the mf4–Ib and mf6–Ib terminals, there was a negative correlation between bouton width and the amplitude of the single-AP Ca2+ transient. This would be expected if the Ca2+ buffering and Ca2+ current density were similar at all of the boutons. In addition, there was a positive correlation between bouton width and the [Ca2+]i decay τ for both single AP and AP trains. This would be expected if the Ca2+ buffering and Ca2+ extrusion (pump) density were similar at all of the boutons. These differences in Ca2+ regulation were seen even if the different-sized boutons were adjacent. For single APs, diameter was negatively correlated with the Ca2+ transient amplitude and positively correlated with its decay τ for both presynaptic boutons formed by dentate gyrus cells (Jackson and Redman, 2003) and dendrites in the primary visual cortex (Holthoff et al., 2002).
Unlike single APs, we found that the increase in [Ca2+]i during AP trains was not significantly correlated with bouton width. This could be attributable to the establishment of the [Ca2+]i plateau by the Ca2+ influx–efflux steady state and similar scaling of Ca2+ influx and efflux by changes in bouton size. Alternatively, this could result from Ca2+ diffusion along the terminal during a prolonged AP train. The former seems more likely given the short λC for the spread of Ca2+ (discussed above).
Bouton size could influence short-term synaptic plasticity because there appears to be a linear relationship between residual [Ca2+]i and the amplitude of F2 facilitation, augmentation, or posttetanic potentiation (for review, see Zucker and Regehr, 2002). For example, large boutons would be expected to show a slower decay of these synaptic enhancements than smaller boutons. In addition, F2 facilitation produced by single APs might show a greater amplitude at small boutons compared with large ones; however, the amount of augmentation and posttetanic potentiation produced during trains of impulses would be similar at large and small boutons.
Distal boutons have greater Ca2+ influx than proximal ones at the mf6–Ib terminal
A previous study showed that, for the mf6–Ib terminals, the distal boutons released more transmitter than proximal ones (Guerrero et al., 2005). It was proposed that this was attributable to greater Ca2+ influx because the increase in [Ca2+]i produced by trains of impulse was greater for boutons at the end of the terminal compared with the second or third bouton from the end. Our measurements of Ca2+ transients produced by single APs support these findings. For the mf6–Ib terminals, there was a distal to proximal decrease in the amplitude of the single-AP Ca2+ transient that could not be accounted for by changes in bouton size. This likely reflects a difference in Ca2+ influx because it is doubtful that there were proximal–distal differences in Ca2+ buffering proteins. It is not clear why this motor terminal should have a distal–proximal gradient in Ca2+ influx and transmitter release. For the mf4–Ib, an effect of bouton position on Ca2+ transients was not apparent. In the rat neocortex, there was no correlation between the amplitude of single-AP Ca2+ transients and bouton position for pyramidal cell synaptic terminals (Koester and Sakmann, 2000).
The PMCA plays a major role in Ca2+ clearance after single APs and trains of APs
To examine the mechanisms responsible for Ca2+ clearance for the stimulation parameters used in this study, we used pharmacological inhibitors for mitochondria, ER, Na/Ca exchange, and the PMCA. We found that blocking the ER Ca2+ ATPase with thapsigargin produced a significant increase in the [Ca2+]i decay τ for single APs and trains of APs. We did not see any effect of thapsigargin on the amplitude of the Ca2+ transients, but a previous study reported that thapsigargin enhanced the increase in [Ca2+]i seen during AP trains (Kuromi and Kidokoro, 2002). However, in that study, much greater stimulation was applied (30 Hz for 5 min) and the change in [Ca2+]i was measured using rhod-2, which can report [Ca2+] changes in mitochondria in larval motor terminals (Guo et al., 2005). Inhibiting mitochondrial Ca2+ uptake had no effect on the Ca2+ transients produced by single APs or 5 s AP trains. This was consistent with a previous study of dmiro mutants that have no mitochondria in the larval motor terminals. They saw no effect of the mutation on the Ca2+ transients produced by 5 s trains; however, the increase in [Ca2+]i was greater during 30 s trains (Guo et al., 2005).
Blocking Na/Ca exchange during stimulation trains did not affect the amplitude of the Ca2+ transient and only produced a small increase in the [Ca2+]i decay τ. Na/Ca exchange activity has been reported for a number of synaptic terminals in other organisms (Fontana et al., 1995; Reuter and Porzig, 1995; Zhong et al., 2001). However, the Drosophila Na/Ca exchanger (CalX) is unusual because it is inhibited by cytoplasmic Ca2+ (Hryshko et al., 1996), whereas all other known Na/Ca exchangers are stimulated by cytoplasmic Ca2+ (Blaustein and Lederer, 1999). CalX is important for the survival and function of photoreceptor cells, but its role at other cells is not known (Wang et al., 2005).
Clearly the largest effect on Ca2+ clearance was produced by inhibiting the PMCA with high pH. After inhibiting the PMCA, the [Ca2+]i decay τ for single APs was approximately doubled, and, for AP trains, it was increased fivefold. The importance of Ca2+ extrusion by the PMCA in Ca2+ clearance was consistent with the dependence of the [Ca2+]i decay τ on bouton size (see above). Also, the increase in [Ca2+]i during AP trains was doubled, showing that the PMCA was important for establishing the plateau during AP trains. As expected, high pH had no effect on the increase in [Ca2+]i produced by single APs. The extrusion of Ca2+ from ribbon synapses produced by vertebrate photoreceptors was predominantly attributable to the PMCA (Morgans et al., 1998). Immunostaining for the PMCA in the chick ciliary ganglion showed that the PMCA was concentrated in the synaptic regions of presynaptic terminals (Juhaszova et al., 2000). We generated an antibody to the Drosophila PMCA, and immunocytochemistry showed strong PMCA staining of the larval NMJ. Presumably this reflects high levels of PMCA at the Drosophila motor terminals.
Footnotes
This work was supported by National Science Foundation Grant IOB 0543835 (G.A.L.). We thank Gregory Macleod and Harold Atwood for showing us how to load OGB-1 into motor terminals and Vimla Singh for technical support.
References
- Atluri PP, Regehr WG. Determinants of the time course of facilitation at the granule cell to Purkinje cell synapse. J Neurosci. 1996;16:5661–5671. doi: 10.1523/JNEUROSCI.16-18-05661.1996. [DOI] [PMC free article] [PubMed] [Google Scholar]
- Benham CD, Evans ML, McBain CJ. Ca2+ efflux mechanisms following depolarization evoked calcium transients in cultured rat sensory neurones. J Physiol (Lond) 1992;455:567–583. doi: 10.1113/jphysiol.1992.sp019316. [DOI] [PMC free article] [PubMed] [Google Scholar]
- Blaustein MP, Lederer WJ. Sodium/calcium exchange: its physiological implications. Physiol Rev. 1999;79:763–854. doi: 10.1152/physrev.1999.79.3.763. [DOI] [PubMed] [Google Scholar]
- Borke JL, Caride A, Verma AK, Penniston JT, Kumar R. Plasma membrane calcium pump and 28-kDa calcium binding protein in cells of rat kidney distal tubules. Am J Physiol. 1989;257:F842–F849. doi: 10.1152/ajprenal.1989.257.5.F842. [DOI] [PubMed] [Google Scholar]
- Borst JG, Helmchen F, Sakmann B. Pre- and postsynaptic whole-cell recordings in the medial nucleus of the trapezoid body of the rat. J Physiol (Lond) 1995;489:825–840. doi: 10.1113/jphysiol.1995.sp021095. [DOI] [PMC free article] [PubMed] [Google Scholar]
- Brain KL, Bennett MR. Calcium in sympathetic varicosities of mouse vas deferens during facilitation, augmentation and autoinhibition. J Physiol (Lond) 1997;502:521–536. doi: 10.1111/j.1469-7793.1997.521bj.x. [DOI] [PMC free article] [PubMed] [Google Scholar]
- Chen L, Koh DS, Hille B. Dynamics of calcium clearance in mouse pancreatic beta-cells. Diabetes. 2003;52:1723–1731. doi: 10.2337/diabetes.52.7.1723. [DOI] [PubMed] [Google Scholar]
- David G, Barrett JN, Barrett EF. Stimulation-induced changes in [Ca2+] in lizard motor nerve terminals. J Physiol (Lond) 1997;504:83–96. doi: 10.1111/j.1469-7793.1997.083bf.x. [DOI] [PMC free article] [PubMed] [Google Scholar]
- Delaney KR, Zucker RS, Tank DW. Calcium in motor nerve terminals associated with posttetanic potentiation. J Neurosci. 1989;9:3558–3567. doi: 10.1523/JNEUROSCI.09-10-03558.1989. [DOI] [PMC free article] [PubMed] [Google Scholar]
- Dipolo R, Beauge L. The effect of pH on Ca2+ extrusion mechanisms in dialyzed squid axons. Biochim Biophys Acta. 1982;688:237–245. doi: 10.1016/0005-2736(82)90599-5. [DOI] [PubMed] [Google Scholar]
- Fontana G, Rogowski RS, Blaustein MP. Kinetic properties of the sodium-calcium exchanger in rat brain synaptosomes. J Physiol (Lond) 1995;485:349–364. doi: 10.1113/jphysiol.1995.sp020734. [DOI] [PMC free article] [PubMed] [Google Scholar]
- Guerrero G, Reiff DF, Agarwal G, Ball RW, Borst A, Goodman CS, Isacoff EY. Heterogeneity in synaptic transmission along a Drosophila larval motor axon. Nat Neurosci. 2005;8:1188–1196. doi: 10.1038/nn1526. [DOI] [PMC free article] [PubMed] [Google Scholar]
- Guo X, Macleod GT, Wellington A, Hu F, Panchumarthi S, Schoenfield M, Marin L, Charlton MP, Atwood HL, Zinsmaier KE. The GTPase dMiro is required for axonal transport of mitochondria to Drosophila synapses. Neuron. 2005;47:379–393. doi: 10.1016/j.neuron.2005.06.027. [DOI] [PubMed] [Google Scholar]
- Helmchen F, Borst JG, Sakmann B. Calcium dynamics associated with a single action potential in a CNS presynaptic terminal. Biophys J. 1997;72:1458–1471. doi: 10.1016/S0006-3495(97)78792-7. [DOI] [PMC free article] [PubMed] [Google Scholar]
- Holthoff K, Tsay D, Yuste R. Calcium dynamics of spines depend on their dendritic location. Neuron. 2002;33:425–437. doi: 10.1016/s0896-6273(02)00576-7. [DOI] [PubMed] [Google Scholar]
- Hryshko LV, Matsuoka S, Nicoll DA, Weiss JN, Schwarz EM, Benzer S, Philipson KD. Anomalous regulation of the Drosophila Na+-Ca2+ exchanger by Ca2+ J Gen Physiol. 1996;108:67–74. doi: 10.1085/jgp.108.1.67. [DOI] [PMC free article] [PubMed] [Google Scholar]
- Jackson MB, Redman SJ. Calcium dynamics, buffering, and buffer saturation in the boutons of dentate granule-cell axons in the hilus. J Neurosci. 2003;23:1612–1621. doi: 10.1523/JNEUROSCI.23-05-01612.2003. [DOI] [PMC free article] [PubMed] [Google Scholar]
- Juhaszova M, Church P, Blaustein MP, Stanley EF. Location of calcium transporters at presynaptic terminals. Eur J Neurosci. 2000;12:839–846. doi: 10.1046/j.1460-9568.2000.00974.x. [DOI] [PubMed] [Google Scholar]
- Kamiya H, Zucker RS. Residual Ca2+ and short-term synaptic plasticity. Nature. 1994;371:603–606. doi: 10.1038/371603a0. [DOI] [PubMed] [Google Scholar]
- Koester HJ, Sakmann B. Calcium dynamics associated with action potentials in single nerve terminals of pyramidal cells in layer 2/3 of the young rat neocortex. J Physiol (Lond) 2000;529:625–646. doi: 10.1111/j.1469-7793.2000.00625.x. [DOI] [PMC free article] [PubMed] [Google Scholar]
- Kratje RB, Garrahan PJ, Rega AF. Two modes of inhibition of the Ca2+ pump in red cells by Ca2+ Biochim Biophys Acta. 1985;816:365–378. doi: 10.1016/0005-2736(85)90504-8. [DOI] [PubMed] [Google Scholar]
- Kuromi H, Kidokoro Y. Selective replenishment of two vesicle pools depends on the source of Ca2+ at the Drosophila synapse. Neuron. 2002;35:333–343. doi: 10.1016/s0896-6273(02)00777-8. [DOI] [PubMed] [Google Scholar]
- Laemmli UK. Cleavage of structural proteins during the assembly of the head of bacteriophage T4. Nature. 1970;227:680–685. doi: 10.1038/227680a0. [DOI] [PubMed] [Google Scholar]
- Lnenicka GA, Keshishian H. Identified motor terminals in Drosophila larvae show distinct differences in morphology and physiology. J Neurobiol. 2000;43:186–197. [PubMed] [Google Scholar]
- Lnenicka GA, Atwood HL, Marin L. Morphological transformation of synaptic terminals of a phasic motoneuron by long-term tonic stimulation. J Neurosci. 1986;6:2252–2258. doi: 10.1523/JNEUROSCI.06-08-02252.1986. [DOI] [PMC free article] [PubMed] [Google Scholar]
- Macleod GT, Hegstrom-Wojtowicz M, Charlton MP, Atwood HL. Fast calcium signals in Drosophila motor neuron terminals. J Neurophysiol. 2002;88:2659–2663. doi: 10.1152/jn.00515.2002. [DOI] [PubMed] [Google Scholar]
- Meinertzhagen IA, Govind CK, Stewart BA, Carter JM, Atwood HL. Regulated spacing of synapses and presynaptic active zones at larval neuromuscular junctions in different genotypes of flies Drosophila and Sarcophaga. J Comp Neurol. 1998;393:482–492. doi: 10.1002/(sici)1096-9861(19980420)393:4<482::aid-cne7>3.0.co;2-x. [DOI] [PubMed] [Google Scholar]
- Morgans CW, El Far O, Berntson A, Wassle H, Taylor WR. Calcium extrusion from mammalian photoreceptor terminals. J Neurosci. 1998;8:2467–2474. doi: 10.1523/JNEUROSCI.18-07-02467.1998. [DOI] [PMC free article] [PubMed] [Google Scholar]
- Mulkey RM, Zucker RS. Posttetanic potentiation at the crayfish neuromuscular junction is dependent on both intracellular calcium and sodium ion accumulation. J Neurosci. 1992;12:4327–4336. doi: 10.1523/JNEUROSCI.12-11-04327.1992. [DOI] [PMC free article] [PubMed] [Google Scholar]
- Niggli V, Sigel E, Carafoli E. The purified Ca2+ pump of human erythrocyte membranes catalyzes an electroneutral Ca2+-H+ exchange in reconstituted liposomal systems. J Biol Chem. 1982;257:2350–2356. [PubMed] [Google Scholar]
- Reuter H, Porzig H. Localization and functional significance of the Na+/Ca2+ exchanger in presynaptic boutons of hippocampal cells in culture. Neuron. 1995;15:1077–1084. doi: 10.1016/0896-6273(95)90096-9. [DOI] [PubMed] [Google Scholar]
- Smallwood JI, Waisman DM, Lafreniere D, Rasmussen H. Evidence that the erythrocyte calcium pump catalyzes a Ca2+:nH+ exchange. J Biol Chem. 1983;258:11092–11097. [PubMed] [Google Scholar]
- Stewart BA, Atwood HL, Renger JJ, Wang J, Wu CF. Improved stability of Drosophila larval neuromuscular preparations in haemolymph-like physiological solutions. J Comp Physiol A Neuroethol Sens Neural Behav Physiol. 1994;175:179–191. doi: 10.1007/BF00215114. [DOI] [PubMed] [Google Scholar]
- Tank DW, Regehr WG, Delaney KR. A quantitative analysis of presynaptic calcium dynamics that contribute to short-term enhancement. J Neurosci. 1995;15:7940–7952. doi: 10.1523/JNEUROSCI.15-12-07940.1995. [DOI] [PMC free article] [PubMed] [Google Scholar]
- Towbin H, Staehelin T, Gordon J. Electrophoretic transfer of proteins from polyacrylamide gels to nitrocellulose sheets: procedure and some applications. Proc Natl Acad Sci USA. 1979;76:4350–4354. doi: 10.1073/pnas.76.9.4350. [DOI] [PMC free article] [PubMed] [Google Scholar]
- Wang T, Xu H, Oberwinkler J, Gu Y, Hardie RC, Montell C. Light activation, adaptation, and cell survival functions of the Na+/Ca2+ exchanger CalX. Neuron. 2005;45:367–378. doi: 10.1016/j.neuron.2004.12.046. [DOI] [PubMed] [Google Scholar]
- Wu LG, Westenbroek RE, Borst JG, Catterall WA, Sakmann B. Calcium channel types with a distinct presynaptic localization couple differentially to transmitter release in single calcyx-type synapses. J Neurosci. 1999;19:726–736. doi: 10.1523/JNEUROSCI.19-02-00726.1999. [DOI] [PMC free article] [PubMed] [Google Scholar]
- Xu W, Wilson BJ, Huang L, Parkinson EL, Hill BJ, Milanick MA. Probing the extracellular release site of the plasma membrane calcium pump. Am J Physiol Cell Physiol. 2000;278:C965–C972. doi: 10.1152/ajpcell.2000.278.5.C965. [DOI] [PubMed] [Google Scholar]
- Xu YH, Roufogalis BD. Asymmetric effects of divalent cations and protons on active Ca2+ efflux and Ca2+-ATPase in intact red blood cells. J Membr Biol. 1988;105:155–164. doi: 10.1007/BF02009168. [DOI] [PubMed] [Google Scholar]
- Zador A, Koch C. Linearized models of calcium dynamics: formal equivalence to the cable equation. J Neurosci. 1994;4:4705–4715. doi: 10.1523/JNEUROSCI.14-08-04705.1994. [DOI] [PMC free article] [PubMed] [Google Scholar]
- Zhong N, Beaumont V, Zucker RS. Roles for mitochondrial and reverse mode Na+/Ca2+ exchange and the plasmalemma Ca2+ ATPase in post-tetanic potentiation at crayfish neuromuscular junctions. J Neurosci. 2001;21:9598–9607. doi: 10.1523/JNEUROSCI.21-24-09598.2001. [DOI] [PMC free article] [PubMed] [Google Scholar]
- Zucker RS. Exocytosis: a molecular and physiological perspective Neuron. 1996;17:1049–1055. doi: 10.1016/s0896-6273(00)80238-x. [DOI] [PubMed] [Google Scholar]
- Zucker RS, Regehr WG. Short-term synaptic plasticity. Annu Rev Physiol. 2002;64:355–405. doi: 10.1146/annurev.physiol.64.092501.114547. [DOI] [PubMed] [Google Scholar]