

Abstract
How localized synaptic input regulates dendritic branch structure is not well understood. For these experiments, we used single-cell electroporation, live cell imaging, in vitro deafferentation, pharmacology, and electrophysiological stimulation to study how local alterations in synaptic input affect dendritic branch structure in nucleus laminaris (NL). We found that interrupting or modulating synaptic input to distinct sets of NL dendrites can regulate their structure on a very short timescale. Specifically, eliminating synaptic input by deafferenting only one set of the bitufted NL dendrites caused a selective reduction in the total dendritic branch length of the deafferented dendrites but relatively few changes in the normally innervated dendrites on the same cell. An analysis of individual dendritic branch changes demonstrated that both control and deafferented NL dendrites exhibit branch extension and retraction. However, the presence of intact synaptic inputs balanced these changes, maintaining the total dendritic branch length of control dendrites. When glutamate receptor signaling was blocked (DNQX and AP-5), NL neurons exhibited significant dendrite retraction, demonstrating that NL dendrite maintenance depends in part on presynaptic glutamatergic input. Electrophysiological experiments further confirmed that modulating the level of synaptic input regulates NL dendrite structure. Differential stimulation of the two sets of dendrites resulted in a selective reduction in the total dendritic branch length of the unstimulated dendrites and a selective increase in the total dendritic branch length of the stimulated dorsal dendrites. These results suggest that balanced activation of the two sets of NL dendrites is required to maintain the relative amount of dendritic surface area allotted to each input.
Keywords: synaptic input, deafferentation, activity dependent, time lapse, development, maintenance
Introduction
Dendritic structure is critical for determining the functional properties of a neuronal system. Both development and maintenance of dendrite structure are regulated by synaptic input in a variety of brain structures (Cline, 2001; Wong and Ghosh, 2002; Van Aelst and Cline, 2004). Although the effect of locally manipulating synaptic input on dendritic spines has been examined (Yuste and Bonhoeffer, 2001), how localized synaptic input affects dendritic branch structure is still relatively unknown.
The third-order nucleus in the chick auditory system, nucleus laminaris (NL), provides an ideal model system in which to investigate this question. The development and function of NL have been well characterized (Parks and Rubel, 1975, 1978; Rubel and Parks, 1975; Smith and Rubel, 1979; Smith, 1981; Carr and Boudreau, 1996; Cramer et al., 2000; Kubke et al., 2002; Parameshwaran-Iyer et al., 2003; Tang and Carr, 2004). Moreover, its structure and circuitry allow the effects of manipulating afferent input to be readily determined. Specifically, NL neurons have a very unique morphology. In chickens and most other avian species, each NL neuron contains two sets of relatively symmetrical, aspiny dendrites, a dorsal set and a ventral set (supplemental Fig. 1A, available at www.jneurosci.org as supplemental material) (Ramón y Cajal, 1908; Smith and Rubel, 1979; Smith, 1981). Segregated inputs to these dendrites from neurons in the second-order auditory nucleus, nucleus magnocellularis (NM), provide NL with information from the two ears. Ipsilateral projections from NM contact dorsal dendrites, and contralateral projections contact ventral dendrites (supplemental Fig. 1B, available at www.jneurosci.org as supplemental material). This segregation of inputs from the two ears allows NL neurons to act as coincidence detectors in a neuronal pathway specialized for sound localization (Carr and Konishi, 1990; Overholt et al., 1992). For experimental studies, it also allows removal or alteration of synaptic input to only one set of dendrites while leaving the identical input to the other, matching set of dendrites on the same cell unmanipulated.
Figure 1.

Representative examples of intact dorsal and deafferented ventral dendrites imaged at 0 and 7 h after deafferentation in vitro. Black and white images at left were taken at 0 h. The same dendrites imaged 7 h later are shown in the center. A false-colored merge of the two time points is shown on the right. In merged images, yellow indicates the presence of stable dendritic branches, red indicates branches that have either retracted or moved between 0 and 7 h, and green indicates branches that have either grown or moved between 0 and 7 h. Both the intact dorsal dendrites and the deafferented ventral dendrites undergo dendritic remodeling between imaging sessions, but only the deafferented dendrites appear to have changed significantly, losing length. A, Intact dorsal dendrites remained fairly stable between imaging sessions, although both growing (green) and retracting (red) branches can be seen. B, In contrast, deafferented ventral dendrites underwent quite dramatic changes between imaging sessions. Although growing and moving processes can be seen, many more deafferented branches lost length or were eliminated between imaging sessions, as indicated by the arrows in the black and white images and the prominent appearance of red in the merged images. Scale bars, 20 μm.
In vivo removal of peripheral inputs to one set of dendrites in NL (Parks, 1981; Parks et al., 1987) or the mammalian analog, the medial superior olive (MSO) (Russell and Moore, 1999), alters the development of dendritic branch structure. Once NL dendrites have matured, partial interruption of excitatory synaptic input leads to rapid and localized losses in dendritic size (Benes et al., 1977; Deitch and Rubel, 1984, 1989). These findings suggest that synaptic input regulates the development and maintenance of NL dendrite structure. The current experiments used multiphoton microscopy, in vitro deafferentation, and electrophysiological stimulation to examine the spatial and temporal dynamics of this afferent regulation.
Time-lapse analysis of dorsal and ventral total dendritic branch length (TDBL) revealed that substantial, input-specific changes occur extremely rapidly after localized elimination or alteration in synaptic input. Furthermore, when individual dendritic branches were analyzed, we found that both control and manipulated dendrites exhibit dynamic behavior, growing and retracting throughout the imaging period. Importantly, the relative level of input to the two sets of dendrites determines whether these dynamic morphological changes are balanced, such that TDBL is maintained or altered.
Materials and Methods
Slicing procedures.
Acute brainstem slices were made from late-stage (embryonic day 19) white leghorn chicken embryos as described previously (Monsivais et al., 2000). At this age, hearing is functional (Saunders et al., 1974; Rebillard and Rubel, 1981) and NL neurons have obtained a mature dendritic configuration, although the dendrites are still adding some length (Smith, 1981). Embryos were removed from the egg and rapidly decapitated. The brainstem was quickly dissected out into room-temperature oxygenated artificial CSF (ACSF) (in mm: 130 NaCl, 3 KCl, 1.25 NaH2PO4, 26 NaHCO3, 1 MgCl2, and 2 CaCl2 in filtered dH2O) and blocked for additional sectioning. Coronal sections were then cut at 400 μm thickness using a vibratome (Technical Products International, St. Louis, MO). Vibratome sections were then placed in a slice chamber containing oxygenated ACSF heated to 34–36°C and allowed to equilibrate for 30 min to 1 h. All procedures were approved by the University of Washington Animal Care Committee.
Electroporation procedures.
After equilibration, slices were transferred to a Leica (Northvale, NJ) MZFLIII fluorescent dissecting scope and individual NL cells were identified and then filled with anionic tracer using a method for single-cell electroporation adapted from Haas et al. (2001). Slices were placed in a Sylgard-coated chamber containing oxygenated ACSF and a reference electrode. The stimulating electrode consisted of a pulled glass pipette with a tip size of ≪1 μm (A-M Systems, Carlsborg, WA) containing a silver wire submerged in anionic tracer. The electrode was positioned just below the surface of the slice within the line of NL cell bodies. Using an Electro Square Porator (model ECM 830; BTX, San Diego, CA), a negative voltage (20–50 V, 50 ms duration, train of eight pulses) was then applied to the slice. The voltage pulse temporarily permeabilized the cells surrounding the electrode tip and delivered a small amount of the charged dextran to the region. This procedure resulted in instantaneous labeling of the cell body, dendrites, and proximal axon of single NL cells (see example cell in supplemental Fig. 1B, available at www.jneurosci.org as supplemental material). Only occasionally were two NL neurons filled. For these experiments, we used either 10% Alexa 488 dextran (Invitrogen, Carlsbad, CA) or 10% Alexa 594 dextran (Invitrogen) in sterile saline. This procedure was used to label one to three NL cells on one side of the slice. After electroporation, slices were briefly returned to the holding chamber, before being transferred to the microscope described below.
Imaging procedures.
Slices were kept alive during imaging experiments by continual perfusion with oxygenated ACSF warmed with an in-line solution heater (model SF-28; Warner Instruments, Hamden, CT) to 34°C. Digital images of NL cells were captured with a Zeiss (Thornwood, NY) 510 Multi-Photon NLO microscope system coupled to a Zeiss Axiovert 200 stand using AIM for LSM510 scanning control software (LSM 510 MP-NLO; Zeiss). The light source used was a Coherent-AMT (Kitchener, Ontario, Canada) Mira 900 titanium/sapphire femtosecond pulse laser. All cells were imaged with a Plan Neofluar 40× oil immersion objective (1.3 numerical aperture, 0.12 mm working distance). Images were acquired either once at the beginning (0 h) and once at the end of the experimental time period (7 h) or every 20–60 min for up to 7 h. Because there is a 10-fold variation in dendritic length along the tonotopic map of the NL (Smith and Rubel, 1979), imaging parameters varied with the position of the neuron in the nucleus. Cells taken from the high-frequency region of the nucleus are smaller and could be imaged with a higher resolution (0.17–0.25 μm/pixel) than the larger cells taken from the low-frequency region of the nucleus (0.26–0.37 μm/pixel). When possible, neurons from the middle region of the nucleus were studied. For images acquired only at the beginning and end of experiments, a z-series of 100–200 consecutive images (with a distance of 0.4 μm between images) was taken through the entire extent of the NL cells (512 × 512). For images acquired repeatedly throughout the experiment, imaging parameters were similar to those described above, except only NL dendrites (and not their cell bodies) were imaged using the regions-of-interest function in the LSM software. Image resolution was higher (0.13–0.17 μm/pixel) for these experiments. These same parameters were used for the differential stimulation experiments, but a whole-cell image was acquired at the zero and final (5–7 h) time points. All images shown are three-dimensional (3D) projections, with dorsal dendrites oriented to the top of the page and ventral dendrites oriented to the bottom of the page. For qualitative comparison of dendrites between or across time points, images were first split into dorsal and ventral regions and then aligned to the cell body and/or to the base of the primary dendrites. When images of the two time points were false colored and merged for illustrative purposes, the image parameters were adjusted simultaneously in all channels using Adobe Photoshop 7.0 (Adobe Systems, San Jose, CA). Whole-cell images are not shown because changes in the cell body throughout the imaging period did not allow both sets of dendrites to be aligned in the same image (NL cell bodies typically either thinned and elongated or shrank slightly during the imaging period).
In vitro deafferentation procedures.
Once slices were transferred to the microscope stage and NL neurons were located, microscissors were used to cut the NM axons of the crossed dorsal cochlear tract (XDCT) that innervate the ventral dendrites of NL neurons on both sides of the slice (see scissor icon in supplemental Fig. 1A, available at www.jneurosci.org as supplemental material). At this age, myelinated crossing fibers of the XDCT can be easily viewed using dark- or bright-field optics. Thus, the success of the lesion was determined, and cells were imaged immediately thereafter. Slice position could change substantially with the lesion, so 0 h images were acquired immediately after the lesion was confirmed (within 1 min).
In vitro electrophysiological stimulation procedures.
To selectively stimulate the dorsal dendrites of NL neurons, a concentric, bipolar stimulating electrode (FHC, Bowdoinham, ME) was used to stimulate NM ipsilateral to the neuron being imaged. An A-M Systems 2100 Isolated Pulse Stimulator was used to apply voltage pulses of 20 V and 0.1 ms duration at 50 Hz for 5–7 h. Borosilicate recording electrodes filled with 1 m NaCl (1–10 mΩ) were used to confirm the effect of the stimulation at the beginning and end of each experiment. The recording electrode was placed ipsilateral to the stimulating electrode in the most lateral portion of the NL cell body line. NL neurons were only imaged in slices in which field potentials were confirmed. The postsynaptic components of the field potentials were verified by blocking with either 0.1 m DNQX or 0 m Ca2+ applied to the bath in separate experiments.
Pharmacological experiments.
To begin assessing the roles of glutamate signaling in maintaining NL dendrite structure, we imaged single NL cells before and after 4–5 h of exposure to ACSF containing the glutamate receptor (GluR) blockers DNQX (50 μm) and AP-5 (100 μm). These drug concentrations are known to block miniature EPSPs in this system (Monsivais et al., 2000). Drugs were obtained from Sigma (St. Louis, MO).
Three-dimensional morphological analysis procedures.
The noise in each raw image associated with blurring attributable to the optics of the scope was reduced by deconvolution using Huygens Essential software (version 2.7.3p3; Scientific Volume Imaging, Hilversum, The Netherlands). Deconvolved images were imported into Object Image 2.11, and a series of substack projections were made so that all analyzed image stacks had an effective z-step of ∼1 μm. The analyzed image stacks consisted of 50–100 images. For all images, the experimenter was blind to the imaging time point and the type of dendrite being analyzed (dorsal vs ventral or stimulated vs unstimulated).
Using Object Image, the dorsal and ventral dendrites of each cell were then separately analyzed in each 3D z-stack for TDBL, length of individual dendritic branches, branch dynamics, and the number of branch intersections at 1 μm intervals from the cell body. The morphometry macros used for these 3D analyses were obtained from Hollis Cline’s laboratory (http://clinelab.cshl.edu/methods.html).
For branch length and dynamics analyses, the z-stacks from each time point were opened simultaneously. Within the z-stack, a single dendritic branch was chosen and then located (if present) in all other z-stacks. Within each z-stack, a line was then drawn through the center of the dendrite from its terminal tip through each successive z-section to its origin at the cell body. All individual dendrites were analyzed in this way. If any individual dendrite was cut off in any plane or at any time point, it was not included in the analysis. z-Axis rotations were routinely made to confirm that dendrites were not cut off in this plane. Each dendrite was assigned a number, which allowed us to track changes in the length of individual dendritic branches. By summing individual branch lengths at each time point, changes in the TDBL of the entire dendritic tree could be calculated. The TDBLs of dorsal and ventral dendrites were compared separately for each cell; thus, each cell had two separate TDBL values for each time point. The mean dorsal and ventral TDBL for each group was then calculated. The mean percentage difference in individual branch length, as well as the mean percentage of branches that grew, retracted, or remained stable (within 10% of their original length), at each time point were also compared. For each neuron, the percentage difference between the initial TDBL and TDBL at each subsequent time point was determined. Finally, a Sholl analysis was performed on the 3D images to determine how the spatial configuration of NL dendrites changed throughout the imaging period (Sholl, 1953). For these analyses, Object Image was also used to calculate the total number of branch intersections spaced at 1 μm intervals from the cell body out to the last dendritic tip. To compare between cells of different sizes, we first converted the number of intersections at each distance from the cell body to a percentage of the total number of branch intersections. Statview (SAS Institute, Cary, NC) was used for statistical analyses. Significance was determined using an ANOVA and individual Fisher’s PLSD test; p < 0.05 was considered statistically significant. Unless otherwise noted, all data are shown as mean ± SE.
For deafferentation experiments in which neurons were imaged at only two time points, five control cells and seven deafferented cells were analyzed for a total of 273 control dendrites and 416 deafferented dendrites. For deafferentation experiments in which cells were repeatedly imaged, either the dorsal or the ventral sets of dendrites from four deafferented cells were analyzed for a total of 206 dendrites. For differential stimulation experiments, four stimulated cells were used plus two additional control cells, for a total of 227 and 203 dendrites, respectively. For glutamate receptor blocker experiments, either the dorsal and/or the ventral sets of dendrites from six NL neurons were analyzed for a total of 399 dendrites. For all experiments, electroporated NL cells that exhibited appreciable photobleaching or aberrant changes in morphology, e.g., swelling of the cell body and/or formation of dendritic varicosities, were excluded from these analyses.
Results
Synaptic integrity is required for maintenance of total dendritic branch length of NL neurons in vitro
Single NL neurons filled with fluorescent dextrans were imaged live with a multiphoton microscope after selective deafferentation of their ventral dendrites in vitro. For initial experiments, cells were imaged immediately after deafferentation and then again 7 h later. Figure 1 shows representative examples of deafferented ventral dendrites (B) and normally innervated (intact) dorsal dendrites (A). Intact dorsal dendrites act as a within cell control for the effect of deafferentation on NL dendrite structure. The images shown in Figure 1 are z-projection images of complete sets of intact dorsal (two examples) or deafferented ventral (four examples) dendrites taken at 0 and 7 h (images in black and white). A false-colored, merged image is also shown. In the merged image, the 0 h time point is represented in red, and the 7 h time point is in green. Where the two images overlap completely, yellow appears. The presence of red indicates dendrites that have either retracted (branches completely eliminated or decreased in length) or moved since the initial imaging time point. The presence of green indicates dendrites that have either grown (branches newly added or increased in length) or moved since the initial time point. Retracting, growing, and stable branches can be observed in the merged images of both intact and deafferented dendrites, although much more retraction (red) can be observed in the images of deafferented ventral dendrites. Arrows in the black and white images also indicate branches that have retracted between the 0 and 7 h images.
Although the images presented in Figure 1 (see also Figs. 7–9) are z-projection images, changes in TDBL were measured from individual optical sections within the three-dimensional image stacks. These values are shown here in Figure 2, A and B. In Figure 2A, the dorsal and the ventral TDBLs of individual neurons are shown at the initial and final imaging periods (0 and 7 h, respectively). The dorsal and ventral dendrites of control cells changed very little between the imaging periods (open and filled triangles, respectively). Similarly, the normally innervated (intact) dorsal dendrites of ventrally deafferented cells remained fairly stable (open circles). In contrast, with 7 h of deafferentation, the deprived, ventral dendrites of all deafferented neurons (filled circles) lost TDBL. Interestingly, the absolute amount of dendritic loss was fairly consistent across neurons (ranging between 40 and 80 μm), regardless of the initial TDBL. This differs from previous research that reported that the proportion of dendritic loss was constant across the nucleus but the absolute amount of length changed (Deitch and Rubel, 1984). Figure 2B shows the mean percentage change in total dendritic length between imaging sessions for these same cells. After 7 h of input deprivation, deafferented ventral dendrites lost a significant portion of their total length (−12.9 ± 4.16%) relative to all other types of dendrites (ANOVA, p < 0.001). The normally innervated (intact) dorsal dendrites on the same neuron exhibited slight, but nonsignificant increases in TDBL (5.1 ± 9.80%) between imaging sessions. Similarly, the total length of both the dorsal and the ventral sets of dendrites on control neurons changed little over the 7 h imaging period. On average, the control dorsal dendrites lost −2.4 ± 3.39% of their TDBL, whereas ventral dendrites increased TDBL by 3.6 ± 2.94%. Thus, only the deafferented ventral dendrites changed significantly over the 7 h imaging time period, losing a significant amount of TDBL.
Figure 7.
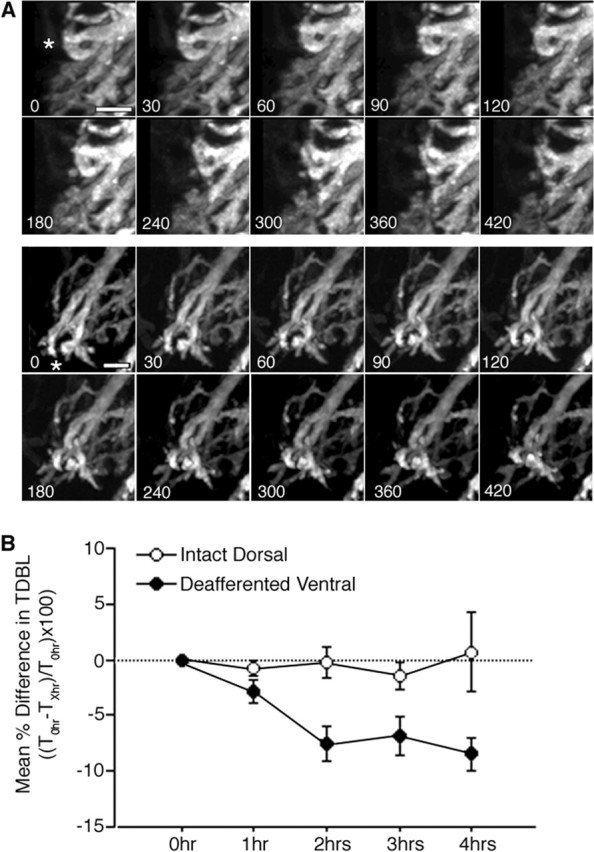
Progressive changes in NL dendrites over 7 h of deafferentation. A, Typical examples of deafferented ventral dendrites from two neurons imaged every 30 min for 7 h. Several dendritic branches (indicated by asterisks in 0 h image) in each image series can be observed to progressively retract over the imaging period. Time of image acquisition (in minutes, beginning immediately after deafferentation) is indicated at the bottom left corner of each image. Scale bar, 5 μm. B, Quantification of TDBL changes with repeat imaging over 4 h. The mean percentage difference in TDBL between the initial value at 0 h and each subsequent image is shown for deafferented ventral dendrites (filled circles) and for intact dorsal dendrites on deafferented neurons (open circles). Intact dorsal dendrites of deafferented neurons change very little in the first 4 h after the manipulation. In contrast, by 2 h after the lesion, deafferented ventral dendrites lost substantial TDBL and lost length only in much smaller increments at subsequent imaging time points (n = 4 deafferented NL neurons).
Figure 8.
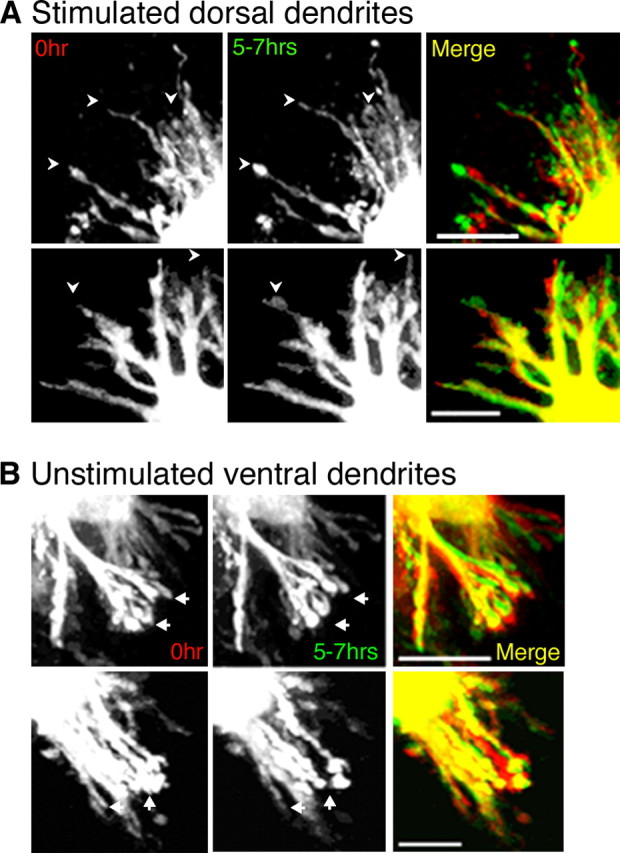
Representative examples of stimulated dorsal (A) and unstimulated ventral (B) dendrites from two NL neurons in the high-frequency region of the nucleus imaged at 0 and 5–7 h. Black and white images at left were taken at 0 h. The same dendrites imaged 5–7 h later are shown in the center. A false-colored merge of the two time points is shown on the right. In merged images, yellow indicates the presence of stable dendritic branches, red indicates branches that have either retracted or moved, and green indicates branches that have either grown or moved between the imaging periods. Although both sets of dendrites exhibit substantial stability (yellow in merge images), stimulated dendrites appear to exhibit more growing branches (green) and fewer retracting branches (red) than the unstimulated ventral dendrites. Arrowheads also indicate branches that added length between the initial and final imaging time points. Conversely, unstimulated ventral dendrites appear to have a higher proportion of retracting branches (red) compared with growing branches (green). Scale bars, 20 μm.
Figure 9.

Representative example of stimulated dorsal (A) and unstimulated ventral (B) dendrites from one NL neuron in the low-frequency region of the nucleus imaged at 0 and 5 h. Black and white images at left were taken at 0 h. The same dendrites imaged 5 h later are shown in the center. A false-colored merge of the two time points is shown on the right. Although both sets of dendrites have stable branches (yellow in merge images), the primary branches of stimulated dorsal dendrites appear to exhibit a large amount of growth, and smaller branches are also added to more peripheral dendrites. The unstimulated ventral dendrites on the opposite side of the cell remain more stable than the stimulated dorsal dendrites. However, the primary branches can be observed to retract during the imaging period, and a number of the smaller branches are eliminated. Scale bar, 20 μm.
Figure 2.

Changes in TDBL for NL neurons imaged live at 0 and 7 h, under partial deafferentation and control conditions. A, Scatter-plot comparisons of the difference in TDBL measured in 3D image stacks at 0 and 7 h for individual NL neurons. The initial TDBL for each cell is indicated on the x-axis, and the amount of length lost or gained at the final time point is indicated on the y-axis. TDBL remained stable between imaging sessions for both dorsal (open triangles) and ventral (filled triangles) control dendrites. The intact dorsal dendrites of deafferented neurons (open circles) also demonstrated little change in TDBL between the imaging sessions, although several neurons exhibited a small increase in TDBL. In contrast, the deafferented ventral dendrites (filled circles) of every cell lost between 40 and 80 μm of TDBL between the imaging periods. B, Bar graph indicates the mean ± SD percentage difference between TDBL at 0 and 7 h for dorsal and ventral dendrites of control and partially deafferented neurons. Both dorsal and ventral control dendrites changed very little on average, whereas intact dorsal dendrites have a slight but nonsignificant increase in length. Compared with all other kinds of dendrites, deafferented ventral dendrites exhibited the largest change between imaging sessions. On average, they lost −12.9% of their TDBL (n = 7 deafferented neurons; n = 5 control neurons; p < 0.001).
We found similar results when we examined how the length of individual dendritic branches was affected by deafferentation (Fig. 3). In Figure 3B, it can be seen that, on average, there was a significant loss of deafferented ventral dendrite relative to all other types of dendrites (−12.3 ± 4.73%; p < 0.001). In contrast, both the intact dorsal dendrites and the dorsal and ventral dendrites of control neurons exhibited growth of individual branches, although not to a significant degree. The normally innervated dorsal dendrites grew by 4.5 ± 8.22% (Fig. 3B), and the dorsal and ventral dendrites of control neurons grew by 2.6 ± 2.00 and 3.13 ± 3.46%, respectively (Fig. 3A). These results demonstrate that, on average, the lengths of individual dendritic branches were affected to the same degree as TDBL.
Figure 3.

Mean ± SD percentage difference in individual dendritic branch length between 0 and 7 h of imaging, under control and deafferentation conditions. A, Bar graph for control cells demonstrating the percentage difference between imaging sessions in individual dendritic branch length. On average, each individual dendritic branch of control cells tended to grow slightly between the imaging periods, regardless of whether it was part of the dorsal or ventral set of dendrites. B, Bar graph for deafferented NL neurons demonstrating the percentage difference in the length of individual dendritic branches between imaging sessions. Each branch of the dorsal dendrites of deafferented neurons also tended to grow between the imaging periods. Only individual dendritic branches of deafferented ventral dendrites lost a significant amount of length between the imaging sessions when compared with all other control dendrites (p < 0.001).
Deafferentation preferentially eliminates small dendritic branches, distal to the cell body
A scatter-plot comparison of the lengths of individual dendritic branches at the initial and final imaging time points illustrates that deafferented NL dendrites did not exhibit uniform remodeling across the dendritic tree (Fig. 4). Any length losses that occur between imaging sessions will place the combined data point closer to the x-axis than to the y-axis, and the reverse will be true for length gains. Branches that were completely eliminated or newly added between imaging sessions appear on the x- and y-axis, respectively. Qualitative assessment of the scatter plot for deafferented ventral dendrites (Fig. 4C,D, black open circles) reveals that the smallest dendritic branches (i.e., <20 μm) exhibited the highest degree of retraction compared with larger dendrites, although length losses occurred for branches of every size. The retraction and loss of the smallest dendritic branches can be seen more clearly in the blowup image of the scatter plot in Figure 4D. In contrast to the smaller dendrites, the longer dendrites of deafferented cells tended to remain the same length or even grow slightly. The slight length gains may be attributable to the reabsorption of shorter branches by the longer primary dendrites in response to deafferentation. Conversely, the different sets of control dendrites, the intact dorsal dendrites of deafferented neurons (Fig. 4C,D, gray open circles), and the dorsal and ventral dendrites of control neurons (Fig. 4A,B, gray and black circles, respectively) more consistently maintained branches of all lengths between imaging periods. This is evidenced by the smaller incidence of intact dorsal dendrites or control dendrites in close proximity to, or on, the x-axis. Surprisingly, the intact dorsal dendrites of deafferented cells exhibited obvious length gains between the imaging time points, particularly for dendrites longer than 5 μm. This was true, despite no significant increases in TDBL across cells (Fig. 2B).
Figure 4.

Scatter-plot comparisons of individual dendritic branch length after deafferentation and control conditions. The length of each individual dendritic branch at 0 and 7 h is plotted on the x- and y-axes, respectively. Ventral (V) dendrites appear in black, and dorsal (D) dendrites are in gray. A, Scatter-plot comparisons of individual dendritic branches from control neurons. Dendritic branches from dorsal and ventral sets of control dendrites changed little in length between the imaging periods, and very few branches were eliminated (open circles on the x-axis) or added (open circles on the y-axis). This can be seen more clearly in the blowup image in the left corner of this scatter plot (B). C, Scatter-plot comparisons of individual dendritic branches from partially deafferented neurons. Intact dorsal dendritic branches (gray circles) of deafferented neurons tended to remain stable or increase in length over the imaging period. The longest dendrites in particular exhibited a tendency to grow. Also, very few dendritic branches were either eliminated or added (gray circles on x- and y-axes, respectively). In contrast, the deafferented ventral dendritic branches (black circles) of all sizes lost length. However, the shorter dendrites in particular lost length or were eliminated. This can be seen more clearly in the blowup image of this scatter plot (D).
To further assess how dendritic configuration was affected by deafferentation, we performed a 3D Sholl analysis on these cells. As seen in Figure 5A–C, for control dorsal and ventral dendrites and intact dorsal dendrites, branch configuration did not change between the imaging sessions. For each distance from the cell body, the number of normalized branch intersections at 0 h (open circles) overlaps almost completely with the number of intersections at 7 h (black squares). However, the branch configuration of the deafferented ventral dendrites changed dramatically with 7 h of deafferentation. Figure 5D shows that the number of intersections proximal to the cell body (<15 μm) increased slightly at 7 h relative to the number of intersections at 0 h. Furthermore, the number of intersections for branches that were distal to the cell body (>15 μm) decreased significantly. These results suggest that TDBL losses might have resulted from the absorption of whole primary branches at their base (Deitch and Rubel, 1989). However, in our study, the longest, primary dendrites tended to remain the same length or even to add length during the imaging period (Fig. 4C), suggesting that branches are preferentially lost distally and, to a more limited extent, gained proximally.
Figure 5.

A Sholl analysis was performed to determine whether the spatial organization of dendrites (relative to the cell body) was altered under control and deafferentation conditions. The distribution of dendrites at 0 h (open circles) and 7 h (filled boxes) is virtually identical for control dorsal (A), control ventral (B), and the intact dorsal (C) dendrites of deafferented neurons. Thus, dendritic configuration is not altered between the imaging periods in any of the control dendrites. Dendritic configuration of deafferented ventral dendrites (D) is dramatically altered between 0 and 7 h. The number of branch intersections distal to the cell body (20 μm and up) was significantly reduced at 7 h compared with 0 h (p < 0.05). These results suggest that the net loss in TDBL resulted primarily from the retraction or elimination of NL dendrites located distal to the cell body.
Intact synaptic input balances the branch dynamics of NL dendrites, such that total dendritic branch length is maintained
To assess the degree to which NL neurons exhibit the types of dynamic behavior (growth or retraction) observed in other developing systems (Rajan and Cline, 1998; Wong et al., 2000) and how synaptic integrity affects these dynamics, we determined the percentage of individual dendritic branches that underwent growth, retraction, or remained stable (exhibited less than a 10% change from their original branch length) under control and deafferentation conditions. Figure 6 illustrates that deafferented ventral dendritic branches (black bars) exhibited the highest degree of retraction relative to all other types of dendrites (53.9 ± 5.45%; p < 0.005). The deafferented ventral dendritic branches also exhibited the least growth (12.2 ± 2.94%; p < 0.02). Somewhat surprisingly, the percentage of stable dendrites (33.9 ± 4.84%) on deafferented ventral dendrites did not differ significantly from the percentage for all other types of dendrites (intact dorsal, 41.5 ± 7.27; control ventral, 44.6 ± 7.44; control dorsal, 56.8 ± 3.98). The results of these analyses, when combined with the 3D Sholl analysis, suggest that growing and stable branches are likely found near the cell body, whereas retracting branches are likely found at more distal locations.
Figure 6.

Dynamic behavior of individual dendritic branches under control and deafferentation conditions. The bar graph indicates the percentage of dendritic branches that grew, retracted, or remained stable (defined as within 10% of their original length) between the imaging periods. Control dorsal (D) dendrites are represented in vertical stripes, control ventral (V) dendrites in diagonal stripes, intact dorsal dendrites in white, and deafferented ventral dendrites in black. Approximately 50% of all dendrites remained stable. For control dendrites, including the intact dorsal dendrites of deafferented neurons, the remaining 50% either grew or retracted in nearly equal proportion. In contrast, a significantly higher percentage of deafferented ventral dendritic branches retracted (p < 0.005), and a significantly lower percentage grew (p < 0.02) compared with all other types of dendrites.
Repeat imaging of deafferented NL dendrites reveals that they lose TDBL at early time points after interruption of synaptic input
Figure 7A shows two representative examples of the types of dendritic changes that occur at 30 min to 1 h intervals throughout the 7 h imaging period. Several dendritic branches can be observed to lose length incrementally across the imaging time points (indicated by asterisks in the 0 h images). Figure 7B shows the mean percentage difference in TDBL from four NL neurons imaged at 1 h intervals for 4 h. For two of the four sets of dendrites examined, the TDBL values for intact dorsal dendrites (open circles) and deafferented ventral dendrites (filled black circles) were obtained from different neurons. With the exception of the 3 h time point, TDBL decreased relative to the previous imaging time point for deafferented ventral dendrites. The largest percentage loss of TDBL occurred between the first and second hour after deafferentation of the ventral NL dendrites: deafferented ventral dendrites significantly decreased their TDBL by −7.55 ± 2.76% from the original time point compared with −0.23 ± 2.47% for intact dorsal dendrites (p < 0.03). The normally innervated (intact) dorsal dendrites did not change significantly during the imaging period.
Modulation of synaptic input by differential electrophysiological stimulation regulates dendritic structure
These studies were designed to assess whether differential activation of NL dendrites can also regulate dendrite structure in the absence of a lesion. For these experiments, the synaptic inputs to the dorsal and ventral dendrites were left intact, and only the level of synaptic activity was altered by electrically stimulating the inputs to the dorsal dendrites (ipsilateral NM). Figures 8 and 9 show representative examples of differentially stimulated NL dendrites from the high-frequency and low-frequency region of the nucleus, respectively. The images shown are of stimulated dorsal or unstimulated ventral dendrites taken at 0 and 5–7 h of differential stimulation (images in black and white). A false-colored, merged image is also shown. In the merged image, as in Figure 1, the 0 h time point is represented in red, and the 5–7 h time point is in green. Although many stable structures are observed in the images of both stimulated and unstimulated dendrites, much more retraction (arrows in black and white images, red in merge) can be observed in the images of unstimulated ventral dendrites compared with the stimulated dorsal dendrites. Conversely, more growing branches (arrowheads in black and white images, green in merge) can be observed in the images of stimulated dendrites than in the images of the unstimulated ventral dendrites. The dorsal dendrites of the low-frequency NL neuron (Fig. 9) in particular exhibited a dramatic increase in branch length. (A time-lapse movie of this neuron can be viewed in supplemental Fig. 2, available at www.jneurosci.org as supplemental material.)
These changes were quantified in the 3D image stacks of two control and four differentially stimulated NL neurons (Fig. 10A,B). Although TDBL was measured only at the initial and final time points, differentially stimulated neurons were imaged repeatedly throughout the imaging session. The additional control neurons were added to account for the effects of repeated imaging. Control neurons were not electrically stimulated during the imaging period. In Figure 10A, the TDBLs of the dorsal and ventral dendrites of individual cells at the initial and final imaging periods (0 and 5–7 h, respectively) are shown. Again we found that both sets of dendrites from control neurons changed very little throughout the imaging period. In contrast, the unstimulated ventral dendrites (filled dots) of differentially stimulated neurons all lost TDBL during the imaging period. In contrast, the stimulated dorsal dendrites (open circles) all added length during the imaging period. Interestingly, the NL neuron with the largest initial TDBL added the most length during the stimulation.
Figure 10.

Changes in TDBL for NL neurons imaged live at 0 and 5–7 h, under differential stimulation conditions. A, Scatter-plot comparisons of the difference in TDBL at 0 and 5–7 h for individual NL neurons. The initial TDBL for each cell is indicated on the x-axis, and the amount of length lost or gained at the final imaging time point is indicated on the y-axis. TDBL remains stable between imaging sessions for both dorsal (open triangles) and ventral (filled triangles) control dendrites. The stimulated dorsal dendrites (open circles) add substantial TDBL between the imaging sessions. The amount of length added appears to be related to the initial size of the dendritic tree. The unstimulated ventral dendrites (filled circles) of every cell lost TDBL between the imaging periods. The relationship between length lost and initial TDBL was less clear for unstimulated dendrites than for stimulated dendrites. B, The bar graph indicates the mean percentage difference between TDBL at 0 and 5–7 h for dorsal and ventral dendrites of control and differentially stimulated neurons. Both dorsal and ventral control dendrites changed very little on average. Stimulated dorsal dendrites exhibited a significant increase in TDBL compared with all other types of dendrites (p < 0.05). Unstimulated ventral dendrites significantly lost TDBL compared with stimulated dorsal dendrites (p < 0.001) but only approached significance when compared with control ventral dendrites (p = 0.067).
Figure 10B illustrates the mean percentage difference in total dendritic length between imaging sessions for these cells. With 5–7 h of stimulation, control dendrites changed little (ventral dendrites, −0.536 ± 1.58%; dorsal dendrites, 0.789 ± 1.46%). The stimulated dorsal dendrites exhibited a significant increase in total length (6.387 ± 2.47%) relative to all other types of dendrites (p < 0.05). The unstimulated ventral dendrites on the same cell exhibited a mean decrease in total length (−6.156 ± 2.86%) between imaging sessions. The percentage change was significant when compared with the stimulated dorsal dendrites on the same cells (p < 0.001) and approached significance for the comparison with control, ventral dendrites (p = 0.067). Thus, differential stimulation of the two sets of NL dendrites appeared to be sufficient to induce changes in dendritic structure in an input-dependent manner. Whether the changes in stimulated dorsal dendrites result from the imbalance of input or just simply the presence of increased synaptic input remains to be tested, although an analysis of the TDBL of the entire neuron (dorsal TDBL and ventral TDBL summed together and compared at 0 and 5–7 h) supports the latter conclusion. That is, whole-cell TDBL remained fairly constant between imaging sessions for both differential stimulation and control neurons (data not shown).
Differential stimulation unbalances branch dynamics such that stimulated and unstimulated dendrites on the same cell add and lose TDBL, respectively
Figure 11 illustrates the percentage of individual dendritic branches in each group of dendrites that added length (grew), lost length (retracted), or remained stable within 10% of their original size over the experimental time period. Like deafferented ventral dendrites, unstimulated ventral dendrites (black bars) exhibited the highest degree of retraction (37.09 ± 5.73%) relative to all other types of dendrites (p < 0.05). The percentage of growing (21.16 ± 7.81%) and stable (41.75 ± 11.72%) dendrites was not significantly different from all other types of dendrites. Surprisingly, stimulated dorsal dendrites did not differ significantly in the amount of growth (34.06 ± 15.09%), retraction (24.57 ± 10.07%), and stability (41.37 ± 8.77%) exhibited when compared with control dendrites. These results suggest that, to account for the increased TDBL, the growing dendrites of stimulated cells either added more length per branch than growing control dendrites, or the amount of retraction per branch was smaller than unstimulated or control dendrites.
Figure 11.

Dynamic behavior of individual dendritic branches under control and differential stimulation conditions. Bar graph indicates the percentage of dendritic branches that grew, retracted, or remained stable (within 10% of their original length) between the imaging periods. Control dorsal (D) dendrites are represented in vertical stripes, control ventral (V) dendrites in diagonal stripes, stimulated dorsal dendrites in white, and unstimulated ventral dendrites in black. Approximately 50% of all dendrites remained stable. For all control dendrites, the remaining 50% either grew or retracted in nearly equal proportion. This was also true for the stimulated dorsal dendrite. This suggests that the observed increases in TDBL are attributable to either greater length gains for growing branches or smaller length losses for retracting branches. In contrast, the unstimulated ventral dendrites exhibited a significantly higher percentage of retracting dendrites (p < 0.05) compared with all other types of dendrites.
Glutamate signaling is required to maintain TDBL
These studies were designed to begin assessing whether the dendritic losses observed for deafferented dendrites were caused by the removal of an afferent signal or by the introduction of a retraction-inducing signal. Previous research has demonstrated that glutamate signaling is necessary for regulating many aspects of dendritic structure (Wong and Ghosh, 2002). We assessed the effect of blocking all ionotropic GluR activity on the TDBL of NL neurons in vitro. Single NL neurons were imaged at 0 h and then again after 4–5 h of exposure to the GluR blockers DNQX (50 μm) and AP-5 (100 μm). Figure 12A demonstrates that all NL dendrites lost TDBL with 4–5 h of GluR blockade. (Example images of dendrites exposed to GluR blockers can be found in supplemental Fig. 3, available at www.jneurosci.org as supplemental material.) On average, all sets of NL dendrites exposed to GluR blockers lost −4.9 ± 2.53% of their TDBL during the 4–5 h of GluR blockade compared with control dendrites, which gained 2.1±.71% of their TDBL during this same period of time (p < 0.01). There was no significant difference between the dorsal and ventral dendrites exposed to GluR blockers (p = 0.765). Figure 12B demonstrates that the proportion of dendritic branches that exhibited dendrite retraction also increased significantly after exposure to GluR blockers, 35.2 ± 5.43% compared with only 20.7 ± 2.24% for control dendrites (p < 0.02). (All control cells presented were pooled for these comparisons.) These data demonstrate that NL dendrites depend on glutamate receptor signaling to maintain TDBL and suggest that the deafferentation-induced dendritic losses may, at least in part, be accounted for by deafferentation-induced changes in GluR signaling.
Figure 12.

Changes in total dendritic branch length and branch dynamics between 0 and 4–5 h of imaging, for control neurons and for neurons exposed to DNQX and AP-5. A, Bar graph demonstrating the mean percentage change between imaging sessions in TDBL. On average, TDBL increased slightly between the imaging periods for control dendrites. In comparison, exposure to the glutamate receptor blockers DNQX and AP-5 significantly decreased TDBL over the 4–5 h imaging period (p < 0.01), demonstrating that NL neurons require glutamatergic input to maintain dendrite structure. B, Bar graph indicating the percentage of dendritic branches that grew, retracted, or remained stable (within 10% of their original length) between the imaging periods. Control dendrites are represented in white, and DNQX plus AP-5-exposed dendrites are in black. Approximately 50% of all dendrites remained stable in both groups. For control dendrites, the remaining 50% either grew or retracted in nearly equal proportion. In comparison, the dendrites exposed to DNQX plus AP-5 had a significantly higher percentage of retracting dendrites (p < 0.02).
Discussion
The goal of these experiments was to examine how afferent input dynamically regulates NL dendrite structure. We established an acute slice preparation and imaged single, dye-filled NL neurons while separately manipulating the level, pattern, and integrity of synaptic input to the two sets of NL dendrites. There are few other systems in which (1) all excitatory inputs to a single neuron or neuronal compartment can be discretely manipulated and (2) effects of the manipulation on specific dendrites can be readily determined. In hippocampal cultures, input-specific changes in dendritic spines have been elegantly demonstrated for small segments of individual dendrites (Engert and Bonhoeffer, 1999; Maletic-Savatic et al., 1999). In the current studies, we demonstrate input-specific changes across an entire dendritic tree.
We found that NL dendrites exhibit dynamic morphological changes on a very rapid timescale in vitro. Furthermore, intact synaptic inputs were required to balance these changes and maintain TDBL. Specifically, when synaptic inputs were interrupted by a lesion, deafferented ventral dendrites rapidly degenerated, whereas control dendrites changed very little. These findings agree with the effects that partial deafferentation in vivo has on dendritic structure in NL and MSO (Benes et al., 1977; Deitch and Rubel, 1984, 1989; Russell and Moore, 1999) and on spine density in hippocampus (Parnavelas et al., 1974; Goldowitz et al., 1979). We also demonstrated, for the first time, that NL dendrites depend on GluR signaling to maintain dendritic length and that altering the level and pattern of synaptic input induces localized, input-specific changes in NL dendrite structure. Finally, our studies suggest that the two sets of NL dendrites require balanced (possibly glutamatergic) input to maintain their relative sizes.
Is afferent input necessary for maintaining NL dendrites in vitro?
After 7 h in vitro, control NL dendrites changed very little, whereas deafferented dendrites lost a significant portion of their TDBL. This suggests that NL dendrites either depend on afferent input to maintain TDBL or that they degenerate in response to a lesion-related event.
The rapid time course in which deafferented NL dendrites retract (within 2 h of the lesion) might suggest that a lesion-related event caused the change in dendritic structure. Lesion-induced dendrite retraction can result from activated microglia (Eyupoglu et al., 2003; Rappert et al., 2004) or excitotoxic “injury potentials.” However, previous electron micrographic studies of NL neurons deafferented in vivo do not support such a role for glia (Deitch and Rubel, 1989), and time-lapse imaging of deafferented NL neurons did not reveal the dendritic “blebbing” that often occurs in response to an excitotoxic insult (Bindokas and Miller, 1995). Furthermore, the dendritic losses we observed for deafferented NL dendrites were not uniformly distributed across the dendritic tree (Fig. 5). Dendritic branches were more typically eliminated when located distal to the soma. This finding is not easily accounted for by a lesion-related event. Rather, it might suggest that afferent synaptic input is important for maintaining NL dendrite structure. Ipsilateral NM neurons still provide synaptic input to the soma of partially deafferented NL neurons. If these somatic inputs initiated a postsynaptic signal (such as calcium increases) that diffused only into the most proximal, and not the distal, deafferented dendritic branches, this could explain why proximal branches were more frequently maintained (Lohmann et al., 2002). Additional support for the importance of afferent input in maintaining NL dendrites comes from our GluR blocker studies (Fig. 12). In the absence of ionotropic GluR signaling, NL dendrites significantly lost TDBL and exhibited increased branch retraction relative to control dendrites. Thus, NL dendrites depend on glutamatergic input to maintain their TDBL. This is also true for neurons in other sensory systems (Rajan and Cline, 1998; Rajan et al., 1999; Wong et al., 2000). Interestingly, in NL, this effect likely results from blocking miniature postsynaptic potentials (minis) because spontaneous action potentials are absent in this preparation in vitro. Minis have also been found to be necessary and sufficient to maintain dendrite spines in hippocampal cultures (McKinney et al., 1999). In these studies, deafferentation decreases spine density by reducing spontaneous GluR signaling. Currently, there is no direct evidence to indicate that deafferenting NL dendrites in vitro decreases GluR signaling within the time frame examined in our studies. However, lesion-related losses in glutamate release have been observed at this level of the auditory system (Potashner et al., 1997), and therefore it seems likely that alterations in GluR signaling contribute to the deafferentation-induced dendritic losses observed for NL neurons.
Although both ionotropic GluR blockade and deafferentation induce changes in the TDBL of NL dendrites, the deafferentation-induced losses were much greater. Because DNQX and AP-5 only block AMPA and NMDA receptors, this might suggest that signaling through other GluRs is involved in maintaining NL dendrites. NL neurons also express metabotropic GluRs, which were not blocked in these studies. These receptors are thought to have a protective function in preventing deafferentation-induced cell death in NM (Zirpel and Rubel, 1996); perhaps they also aid in maintaining dendritic length in NL. Additional nonglutamatergic afferent signals may also be necessary for maintaining NL dendrite structure. Activity and neurotrophin signaling have been found to act in coordination to regulate dendrite structure in other systems (Wang and Poo, 1997; McAllister et al., 1999; Vaillant et al., 2002; Miller and Kaplan, 2003). It remains to be tested whether neurotrophins regulate NL dendrite structure, although they are critical for dendrite development and maintenance in other systems (McAllister et al., 1996, 1997; Xu et al., 2000; Gorski et al., 2003; Kohara et al., 2003).
Can NL dendrite structure be regulated by alterations in the pattern of synaptic input?
To test whether NL dendrite structure can be regulated by the pattern of synaptic input, we used electrophysiological stimulation to differentially manipulate the inputs to dorsal and ventral dendrites of NL neurons, in the absence of a lesion or pharmacological manipulation. Electrophysiological stimulation provided the only significant source of action potentials to NL neurons in vitro. With 5–7 h of differential stimulation, the stimulated dorsal dendrites grew, and, more surprisingly, the unstimulated ventral dendrites on the same neuron retracted.
As mentioned previously, at this age, NL neurons are still developing. Their dendrites have a mature configuration but they have not yet achieved mature TDBL. Our finding that stimulated dendrites grow suggests that action potential-mediated signaling may facilitate continued dendritic development in vitro. Synaptic stimulation causes actin polymerization and stabilization in the dendrites and spines of hippocampal neurons in vivo (Lin et al., 2005). Conversely, interruption of synaptic input in vivo destabilizes the cytoskeleton in NL dendrites (Deitch and Rubel, 1989). Perhaps stimulation induces activity-dependent stabilization of the cytoskeleton in stimulated dorsal dendrites of NL neurons, which helps sustain existing dendritic branches. When we compared the percentage of TDBL either added through growth or lost through retraction (data not shown), we found that the stimulated dendrites lost significantly less length than control dendrites. The retraction of unstimulated dendrites perhaps can also be attributed to cytoskeletal changes induced by the relative lack of activation. Another explanation for the differential changes observed in stimulated and unstimulated dendrites is that balanced activation of the two sets of dendrites may be required to maintain their relative TDBLs (discussed later). In the future, it will be important to assess the effect that different stimulation paradigms have on NL dendrites to determine which mechanism is more likely.
Why did the unstimulated ventral dendrites of differentially stimulated neurons lose TDBL?
We were surprised to find that the unstimulated dendrites of differentially stimulated NL neurons lost TDBL. Unstimulated dendrites likely do not experience the same putative degeneration signals or presynaptic changes that affect deafferented NL dendrites, and yet they still lose TDBL. Different mechanisms may underlie the dendritic losses observed for unstimulated and deafferented NL dendrites. For example, unstimulated dendrites may become activated with the differential stimulation but lack the ability to recover from this activation in the absence of normal afferent signals (Caicedo et al., 1997; Okada et al., 1999; Alvarado et al., 2004). Future studies combining electrophysiology and calcium imaging will help clarify how changes in activity affect NL dendrite structure. However, our glutamate receptor blocker studies indicate a second possibility. We found that the level of glutamatergic input is extremely important for maintaining NL dendrite structure. Balanced glutamatergic input may be necessary to maintain the relative sizes of the two sets of NL dendrites. Previously, Deitch and Rubel (1989) suggested that axons from ipsilateral and contralateral NM compete for synaptic space on NL neurons, with more dendritic area allotted to the more active input. The finding that unbalanced auditory experience alters the ratio of dorsal to ventral TDBL in NL (Gray et al., 1982) and the ratio of lateral to medial dendrites in MSO (Feng and Rogowski, 1980) supports this hypothesis. Similarly, in the current studies, the stimulated dendrites gained the same proportion of TDBL that the unstimulated dendrites lost (on average), and TDBL for the whole cell was not significantly altered. The pattern of dendritic activation has also been found to be important for determining dendritic configuration in other developing sensory systems, without affecting TDBL of the whole cell (Tailby et al., 2005). This mechanism could aid neurons in establishing and retaining a functional circuit despite fluctuating levels of sensory stimuli.
Footnotes
This work was supported by National Institute on Deafness and other Communication Disorders Grants DC03829, DC07008, and DC04661. We thank Julie Harris and David Perkel for helpful comments with this manuscript, Glen MacDonald for expert imaging advice and writing Object Image macros, Dr. Nigel Bamford for the generous loan of his electrophysiology and related imaging equipment, and Dr. Krzysztof Palczewski and the University of Washington Department of Ophthalmology for use of the multiphoton imaging facilities.
References
- Alvarado JC, Fuentes-Santamaria V, Henkel CK, Brunso-Bechtold JK (2004). Alterations in calretinin immunostaining in the ferret superior olivary complex after cochlear ablation. J Comp Neurol 470:63–79. [DOI] [PubMed] [Google Scholar]
- Benes FM, Parks TN, Rubel EW (1977). Rapid dendritic atrophy following deafferentation: an EM morphometric analysis. Brain Res 122:1–13. [DOI] [PubMed] [Google Scholar]
- Bindokas VP, Miller RJ (1995). Excitotoxic degeneration is initiated at non-random sites in cultured rat cerebellar neurons. J Neurosci 15:6999–7011. [DOI] [PMC free article] [PubMed] [Google Scholar]
- Caicedo A, d’Aldin C, Eybalin M, Puel JL (1997). Temporary sensory deprivation changes calcium-binding proteins levels in the auditory brainstem. J Comp Neurol 378:1–15. [DOI] [PubMed] [Google Scholar]
- Carr CE, Boudreau RE (1996). Development of the time coding pathways in the auditory brainstem of the barn owl. J Comp Neurol 373:467–483. [DOI] [PubMed] [Google Scholar]
- Carr CE, Konishi M (1990). A circuit for detection of interaural time differences in the brain stem of the barn owl. J Neurosci 10:3227–3246. [DOI] [PMC free article] [PubMed] [Google Scholar]
- Cline HT (2001). Dendritic arbor development and synaptogenesis. Curr Opin Neurobiol 11:118–126. [DOI] [PubMed] [Google Scholar]
- Cramer KS, Fraser SE, Rubel EW (2000). Embryonic origins of auditory brain-stem nuclei in the chick hindbrain. Dev Biol 224:138–151. [DOI] [PubMed] [Google Scholar]
- Deitch JS, Rubel EW (1984). Afferent influences on brain stem auditory nuclei of the chicken: time course and specificity of dendritic atrophy following deafferentation. J Comp Neurol 229:66–79. [DOI] [PubMed] [Google Scholar]
- Deitch JS, Rubel EW (1989). Rapid changes in ultrastructure during deafferentation-induced dendritic atrophy. J Comp Neurol 281:234–258. [DOI] [PubMed] [Google Scholar]
- Engert F, Bonhoeffer T (1999). Dendritic spine changes associated with hippocampal long-term synaptic plasticity. Nature 399:66–70. [DOI] [PubMed] [Google Scholar]
- Eyupoglu IY, Bechmann I, Nitsch R (2003). Modification of microglia function protects from lesion-induced neuronal alterations and promotes sprouting in the hippocampus. FASEB J 17:1110–1111. [DOI] [PubMed] [Google Scholar]
- Feng AS, Rogowski BA (1980). Effects of monaural and binaural occlusion on the morphology of neurons in the medial superior olivary nucleus of the rat. Brain Res 189:530–534. [DOI] [PubMed] [Google Scholar]
- Goldowitz D, Scheff SW, Cotman CW (1979). The specificity of reactive synaptogenesis: a comparative study in the adult rat hippocampal formation. Brain Res 170:427–441. [DOI] [PubMed] [Google Scholar]
- Gorski JA, Zeiler SR, Tamowski S, Jones KR (2003). Brain-derived neurotrophic factor is required for the maintenance of cortical dendrites. J Neurosci 23:6856–6865. [DOI] [PMC free article] [PubMed] [Google Scholar]
- Gray L, Smith Z, Rubel EW (1982). Developmental and experimental changes in dendritic symmetry in n. laminaris of the chick. Brain Res 244:360–364. [DOI] [PubMed] [Google Scholar]
- Haas K, Sin WC, Javaherian A, Li Z, Cline HT (2001). Single-cell electroporation for gene transfer in vivo. Neuron 29:583–591. [DOI] [PubMed] [Google Scholar]
- Kohara K, Kitamura A, Adachi N, Nishida M, Itami C, Nakamura S, Tsumoto T (2003). Inhibitory but not excitatory cortical neurons require presynaptic brain-derived neurotrophic factor for dendritic development, as revealed by chimera cell culture. J Neurosci 23:6123–6131. [DOI] [PMC free article] [PubMed] [Google Scholar]
- Kubke MF, Massoglia DP, Carr CE (2002). Developmental changes underlying the formation of the specialized time coding circuits in barn owls (Tyto alba). J Neurosci 22:7671–7679. [DOI] [PMC free article] [PubMed] [Google Scholar]
- Lin B, Kramar EA, Bi X, Brucher FA, Gall CM, Lynch G (2005). Theta stimulation polymerizes actin in dendritic spines of hippocampus. J Neurosci 25:2062–2069. [DOI] [PMC free article] [PubMed] [Google Scholar]
- Lohmann C, Myhr KL, Wong RO (2002). Transmitter-evoked local calcium release stabilizes developing dendrites. Nature 418:177–181. [DOI] [PubMed] [Google Scholar]
- Maletic-Savatic M, Malinow R, Svoboda K (1999). Rapid dendritic morphogenesis in CA1 hippocampal dendrites induced by synaptic activity. Science 283:1923–1927. [DOI] [PubMed] [Google Scholar]
- McAllister AK, Katz LC, Lo DC (1996). Neurotrophin regulation of cortical dendritic growth requires activity. Neuron 17:1057–1064. [DOI] [PubMed] [Google Scholar]
- McAllister AK, Katz LC, Lo DC (1997). Opposing roles for endogenous BDNF and NT-3 in regulating cortical dendritic growth. Neuron 18:767–778. [DOI] [PubMed] [Google Scholar]
- McAllister AK, Katz LC, Lo DC (1999). Neurotrophins and synaptic plasticity. Annu Rev Neurosci 22:295–318. [DOI] [PubMed] [Google Scholar]
- McKinney RA, Capogna M, Durr R, Gahwiler BH, Thompson SM (1999). Miniature synaptic events maintain dendritic spines via AMPA receptor activation. Nat Neurosci 2:44–49. [DOI] [PubMed] [Google Scholar]
- Miller FD, Kaplan DR (2003). Signaling mechanisms underlying dendrite formation. Curr Opin Neurobiol 13:391–398. [DOI] [PubMed] [Google Scholar]
- Monsivais P, Yang L, Rubel EW (2000). GABAergic inhibition in nucleus magnocellularis: implications for phase locking in the avian auditory brainstem. J Neurosci 20:2954–2963. [DOI] [PMC free article] [PubMed] [Google Scholar]
- Okada T, Schultz K, Geurtz W, Hatt H, Weiler R (1999). AMPA-preferring receptors with high Ca2+ permeability mediate dendritic plasticity of retinal horizontal cells. Eur J Neurosci 11:1085–1095. [DOI] [PubMed] [Google Scholar]
- Overholt EM, Rubel EW, Hyson RL (1992). A circuit for coding interaural time differences in the chick brainstem. J Neurosci 12:1698–1708. [DOI] [PMC free article] [PubMed] [Google Scholar]
- Parameshwaran-Iyer S, Carr CE, Perney TM (2003). Localization of KCNC1 (Kv3.1) potassium channel subunits in the avian auditory nucleus magnocellularis and nucleus laminaris during development. J Neurobiol 55:165–178. [DOI] [PMC free article] [PubMed] [Google Scholar]
- Parks TN (1981). Changes in the length and organization of nucleus laminaris dendrites after unilateral otocyst ablation in chick embryos. J Comp Neurol 202:47–57. [DOI] [PubMed] [Google Scholar]
- Parks TN, Rubel EW (1975). Organization and development of brain stem auditory nuclei of the chicken: organization of projections from n. magnocellularis to n. laminaris. J Comp Neurol 164:435–448. [DOI] [PubMed] [Google Scholar]
- Parks TN, Rubel EW (1978). Organization and development of the brain stem auditory nuclei of the chicken: primary afferent projections. J Comp Neurol 180:439–448. [DOI] [PubMed] [Google Scholar]
- Parks TN, Gill SS, Jackson H (1987). Experience-independent development of dendritic organization in the avian nucleus laminaris. J Comp Neurol 260:312–319. [DOI] [PubMed] [Google Scholar]
- Parnavelas JG, Lynch G, Brecha N, Cotman CW, Globus A (1974). Spine loss and regrowth in hippocampus following deafferentation. Nature 248:71–73. [DOI] [PubMed] [Google Scholar]
- Potashner SJ, Suneja SK, Benson CG (1997). Regulation of d-aspartate and uptake in adult brain stem auditory nuclei after unilateral middle ear ossicle removal and cochlear ablation. Exp Neurol 148:222–235. [DOI] [PubMed] [Google Scholar]
- Rajan I, Cline HT (1998). Glutamate receptor activity is required for normal development of tectal cell dendrites in vivo J Neurosci 18:7836–7846. [DOI] [PMC free article] [PubMed] [Google Scholar]
- Rajan I, Witte S, Cline HT (1999). NMDA receptor activity stabilizes presynaptic retinotectal axons and postsynaptic optic tectal cell dendrites in vivo. J Neurobiol 38:357–368. [DOI] [PubMed] [Google Scholar]
- Ramón y Cajal S (1908). Les ganglions terminaux du nerf acoustique des oiseaux. Trab Inst Cajal Invest Biol 6:195–225. [Google Scholar]
- Rappert A, Bechmann I, Pivneva T, Mahlo J, Biber K, Nolte C, Kovac AD, Gerard C, Boddeke HW, Nitsch R, Kettenmann H (2004). CXCR3-dependent microglial recruitment is essential for dendrite loss after brain lesion. J Neurosci 24:8500–8509. [DOI] [PMC free article] [PubMed] [Google Scholar]
- Rebillard G, Rubel EW (1981). Electrophysiological study of the maturation of auditory responses from the inner ear of the chick. Brain Res 229:15–23. [DOI] [PubMed] [Google Scholar]
- Rubel EW, Parks TN (1975). Organization and development of brain stem auditory nuclei of the chicken: tonotopic organization of n. magnocellularis and n. laminaris. J Comp Neurol 164:411–433. [DOI] [PubMed] [Google Scholar]
- Russell FA, Moore DR (1999). Effects of unilateral cochlear removal on dendrites in the gerbil medial superior olivary nucleus. Eur J Neurosci 11:1379–1390. [DOI] [PubMed] [Google Scholar]
- Saunders JC, Gates GR, Coles RB (1974). Brain-stem evoked responses as an index of hearing thresholds in one-day-chicks and ducklings. J Comp Physiol Psychol 86:426–431. [DOI] [PubMed] [Google Scholar]
- Sholl DA (1953). Dendritic organization in the neurons of the visual and motor cortices of the cat. J Anat 87:387–406. [PMC free article] [PubMed] [Google Scholar]
- Smith DJ, Rubel EW (1979). Organization and development of brain stem auditory nuclei of the chicken: dendritic gradients in nucleus laminaris. J Comp Neurol 186:213–239. [DOI] [PubMed] [Google Scholar]
- Smith ZD (1981). Organization and development of brain stem auditory nuclei of the chicken: dendritic development in n. laminaris. J Comp Neurol 203:309–333. [DOI] [PubMed] [Google Scholar]
- Tailby C, Wright LL, Metha AB, Calford MB (2005). Activity-dependent maintenance and growth of dendrites in adult cortex. Proc Natl Acad Sci USA 102:4631–4636. [DOI] [PMC free article] [PubMed] [Google Scholar]
- Tang YZ, Carr CE (2004). Development of NMDA R1 expression in chicken auditory brainstem. Hear Res 191:79–89. [DOI] [PMC free article] [PubMed] [Google Scholar]
- Vaillant AR, Zanassi P, Walsh GS, Aumont A, Alonso A, Miller FD (2002). Signaling mechanisms underlying reversible, activity-dependent dendrite formation. Neuron 34:985–998. [DOI] [PubMed] [Google Scholar]
- Van Aelst L, Cline HT (2004). Rho GTPases and activity-dependent dendrite development. Curr Opin Neurobiol 14:297–304. [DOI] [PubMed] [Google Scholar]
- Wang XH, Poo MM (1997). Potentiation of developing synapses by postsynaptic release of neurotrophin-4. Neuron 19:825–835. [DOI] [PubMed] [Google Scholar]
- Wong RO, Ghosh A (2002). Activity-dependent regulation of dendritic growth and patterning. Nat Rev Neurosci 3:803–812. [DOI] [PubMed] [Google Scholar]
- Wong WT, Faulkner-Jones BE, Sanes JR, Wong RO (2000). Rapid dendritic remodeling in the developing retina: dependence on neurotransmission and reciprocal regulation by Rac and Rho. J Neurosci 20:5024–5036. [DOI] [PMC free article] [PubMed] [Google Scholar]
- Xu B, Zang K, Ruff NL, Zhang YA, McConnell SK, Stryker MP, Reichardt LF (2000). Cortical degeneration in the absence of neurotrophin signaling: dendritic retraction and neuronal loss after removal of the receptor TrkB. Neuron 26:233–245. [DOI] [PubMed] [Google Scholar]
- Yuste R, Bonhoeffer T (2001). Morphological changes in dendritic spines associated with long-term synaptic plasticity. Annu Rev Neurosci 24:1071–1089. [DOI] [PubMed] [Google Scholar]
- Zirpel L, Rubel EW (1996). Eighth nerve activity regulates intracellular calcium concentration of avian cochlear nucleus neurons via a metabotropic glutamate receptor. J Neurophys 76:4127–4139. [DOI] [PubMed] [Google Scholar]