Abstract
PURPOSE
Uterine corpus cancer incidence rates have been projected to increase, a prediction often attributed to the obesity epidemic. However, correct estimation of these rates requires accounting for hysterectomy prevalence, which varies by race, ethnicity, and region. Here, we evaluated recent trends in hysterectomy-corrected rates by race and ethnicity and histologic subtype and estimated differences in relative survival by race and ethnicity, subtype, and stage.
METHODS
We estimated hysterectomy prevalence from the Behavioral Risk Factor Surveillance System. Hysterectomy-corrected age-standardized uterine corpus cancer incidence rates from 2000 to 2015 were calculated from the SEER 18 registries. Incidence rates and trends were estimated separately by race and ethnicity, region, and histologic subtype. Five-year relative survival rates were estimated by race and ethnicity, histologic subtype, and stage.
RESULTS
Hysterectomy-corrected incidence rates of uterine corpus cancer were similar among non-Hispanic whites and blacks and lower among Hispanics and Asians/Pacific Islanders. Endometrioid carcinoma rates were highest in non-Hispanic whites, whereas nonendometrioid carcinoma and sarcoma rates were highest in non-Hispanic blacks. Hysterectomy-corrected uterine corpus cancer incidence increased among non-Hispanic whites from 2003 to 2015 and among non-Hispanic blacks, Hispanics, and Asians/Pacific Islanders from 2000 to 2015. Overall incidence rates among non-Hispanic blacks surpassed those of non-Hispanic whites in 2007. Endometrioid carcinoma rates rose among non-Hispanic blacks, Hispanics, and Asians/Pacific Islanders but were stable among non-Hispanic whites; however, nonendometrioid carcinoma rates rose significantly among all women. Non-Hispanic blacks had the lowest survival rates, irrespective of stage at diagnosis or histologic subtype.
CONCLUSION
Among all women, rates of nonendometrioid subtypes have been rising rapidly. Our analysis shows profound racial differences and disparities indicated by higher rates of nonendometrioid subtypes and poorer survival among non-Hispanic black women.
INTRODUCTION
Uterine corpus cancer is the most common and second deadliest gynecologic cancer diagnosed in the United States, with approximately 63,230 new cases and 11,350 deaths occurring in 2018.1 Unlike in most cancers, uterine corpus (hereafter referred to as uterine) cancer incidence rates have been increasing over the past two decades2 and have been projected to rise substantially.3,4 These trends and predictions have been largely attributed to increasing obesity rates, population aging, and decreased use of combined menopausal hormone therapy.5 Uterine carcinomas with endometrioid histology are the most common, have good prognosis, and are strongly associated with obesity and other estrogen-related risk factors. Uterine carcinomas with nonendometrioid histology (eg, serous and clear cell carcinomas) are more aggressive and are suggested to be less hormone dependent, with worse outcomes and survival.6,7 Sarcomas generally arise in the myometrium, are less common, and have not been well studied.
Despite having historically lower uterine cancer incidence rates, black women have been more likely to be diagnosed with aggressive nonendometrioid subtypes and have been twice as likely to die as a result of uterine cancer compared with white women, making this one of the largest racial disparities observed for any cancer type.8,9 Recent studies using population-based registry data have suggested that nonendometrioid cancer incidence rates have been disproportionately increasing among black women.8,10-12 However, these studies did not correct for hysterectomy prevalence, which varies widely by age, race, ethnicity, geographic region, and calendar time. Women who have had a hysterectomy are no longer at risk for developing uterine cancer, and failure to remove them from the population at risk may result in biased comparisons.13-16 Few studies of racial and ethnic differences in uterine cancer incidence have accounted for hysterectomy prevalence, with the most recent evaluating trends through 2008.13,16
With the availability of several additional years of data and larger population coverage in the recent release of the SEER 18 database, we sought to evaluate the extent of racial and ethnic differences in uterine cancer incidence and patient survival. We evaluated trends in rates overall and by histologic subtype, accounting for racial, ethnic, and geographic differences in hysterectomy prevalence. Furthermore, we present uterine cancer survival estimates by race and ethnicity according to histologic subtype and stage at diagnosis.17
METHODS
SEER Database
We obtained incidence data on microscopically confirmed cases of invasive corpus uteri and uterine corpus not otherwise specified (NOS; excluding uterine cervical) cancers from the SEER database in 18 population-based registries representing approximately 28% of the US population (San Francisco, Connecticut, Detroit, Hawaii, Iowa, New Mexico, Seattle, Utah, Atlanta, San Jose–Monterey, Los Angeles, Alaska Native Registry, rural Georgia, California [excluding San Francisco, San Jose–Monterey, and Los Angeles], Kentucky, Louisiana, New Jersey, and Georgia [excluding Atlanta and rural Georgia]), diagnosed between 2000 and 2015.18 In SEER, race and ethnicity data are abstracted from medical records and grouped into race and origin categories using standardized algorithms.19 We included women of Hispanic and non-Hispanic origin/ethnicity and, among non-Hispanics, white, black, and Asian/Pacific Islander race (hereafter referred to as whites, blacks, and Asians, respectively); non-Hispanic American Indian/Alaska Native and unknown races were excluded because of the small number of cases. We excluded the few cases diagnosed in women younger than age 30 years and those age 80 years or older because age-specific hysterectomy data were not available. Cases from the Alaska Native SEER registry were excluded because this registry does not provide information on ethnicity (ie, Hispanic v non-Hispanic). Cases were classified by histologic subtypes defined by the third edition of the International Classification of Diseases for Oncology histology codes and included endometrioid and nonendometrioid carcinomas and sarcomas (Appendix Table A1, online only). Cases coded as adenocarcinoma NOS (n = 8,140) decreased from 32% of all cases in 2000 to only 4.1% in 2015. For the incidence analyses, we reclassified them according to the observed distribution of endometrioid and nonendometrioid cases by year, age, race, ethnicity, and region. For example, of the 10 adenocarcinoma NOS cases diagnosed during 2000 among whites in the Northeast age 35 to 39 years, nine and one were reclassified according to the observed proportions of endometrioid (90%) and nonendometrioid (10%) cases, respectively. All other malignant uterine cancers combined (ie, other) were included in analyses of overall incidence rates (Appendix Table A1). We classified stage at diagnosis using SEER Summary Stage 2000 as localized, regional, distant, or unstaged/unknown.
Behavioral Risk Factor Surveillance System
The Behavioral Risk Factor Surveillance System (BRFSS) is a nationally representative cross-sectional telephone survey that collects data on health-related risk behaviors, chronic health conditions, and use of preventive services in the noninstitutionalized adult civilian US population.20 BRFSS uses a dual-frame sample design, conducting both landline and cell phone (as of 2011) surveys using random-digit dialing. Survey-weighted estimates of hysterectomy prevalence were calculated for women age 30 to 79 years. Because BRFSS only obtains information on hysterectomy in even‐numbered years, hysterectomy prevalence was estimated for the odd‐numbered years by calculating a population-weighted average of the neighboring years. To ensure stable estimates of hysterectomy prevalence, we used data from women residing in all 50 states and defined regions according to US Census Bureau designation (Northeast, Midwest, South, and West).
Statistical Analysis
Age-adjusted incidence rates, uncorrected for hysterectomy prevalence, were calculated using SEER*Stat software (version 8.3.5) for uterine cancer overall and by histologic subtype, stratified by 5-year age groups (ie, 30 to 34, 35 to 39, and continuing to 75 to 79), year of diagnosis (2000 to 2015), region (Northeast [Connecticut and New Jersey], Midwest [Michigan and Iowa], South [Georgia, Kentucky, and Louisiana], and West [California, Hawaii, New Mexico, Washington, and Utah]), and race and ethnicity (white, black, Hispanic, and Asian). Rates were age adjusted to the 2000 US standard population and expressed per 100,000 woman-years.
We estimated smoothed survey-weighted hysterectomy prevalence using logistic regression with coefficients for 5-year age group, year, an interaction term for age group and year, race and ethnicity, and geographic region using data from BRFSS. Adjusted prevalence estimates were predicted from the model, within strata of race and ethnicity, age group, year, and region. These estimates were used to correct the corresponding populations at risk by removing the proportion of women with a hysterectomy from the denominator. To account for the fact that women with uterine cancer undergo hysterectomy for treatment, we added cases back into the corrected denominator. Hysterectomy-corrected rates were age standardized to the 2000 US population. We estimated incidence rate ratios and 95% CIs to compare incidence rates between groups and calculated the percentage change between uncorrected and corrected rates.
Trends in uterine cancer incidence were estimated using the National Cancer Institute Joinpoint regression software (version 4.6),21 which calculates annual percentages changes (APCs) and 95% CIs and uses t tests to determine whether APCs are statistically significantly different from zero. The program selects the best-fitting log-linear regression model to identify years when APCs significantly changed, providing a minimum number of joinpoints necessary to fit the data. In most cases, a single segment best fit the data (single APC), with the exception of overall uterine cancer rates in all women and among whites. If more than one APC was estimated, trends were summarized by the average APC (AAPC). Trends were plotted using a semilogarithmic scale.22
We estimated 5-year relative survival rates for patients diagnosed with uterine cancer during 2000 to 2014 by race and ethnicity, stratified by histology and stage at diagnosis. Cases diagnosed by autopsy or death certificate and those missing follow-up information were excluded. Expected survival was estimated with the Ederer II method.23 Individuals in the survival cohort were matched to the socioeconomic, geographic, and race annual life tables by age, sex, race and ethnicity, calendar year, and county of residence at the time of cancer diagnosis, and relative survival was estimated as the ratio of the observed to the expected survival rate of matched patients using the actuarial method.17 All statistical tests were two sided, and statistical significance was assessed at an α level of P < .05.
RESULTS
Prevalence of Hysterectomy Among US Women
The prevalence of hysterectomy declined from 27.3% in 2000 to 23.9% in 2015, with an overall prevalence of 25.2% during 2000 to 2015. Hysterectomy prevalence varied by race and ethnicity, with the highest rate in blacks (29.0%; declining from 31.4% to 27.6%), followed by whites (25.5%; from 27.7% to 24.2%), Hispanics (22.7%; from 24.8% to 21.5%), and Asians (16.0%; from 16.7% to 15.3%). Prevalence estimates also varied by region, with the highest observed in the South (29.5%), followed by the Midwest (24.3%), West (25.0%), and Northeast (18.1%). The rates of decline were similar across regions.
Uncorrected and Corrected Age-Adjusted Uterine Cancer Incidence Rates, 2000 to 2015
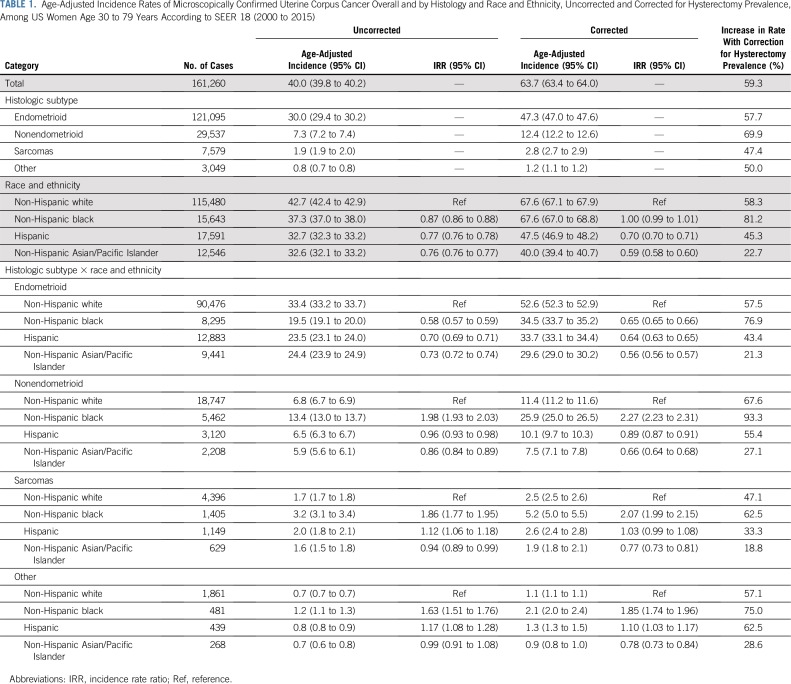
Overall, the hysterectomy-corrected incidence rate of 63.7 per 100,000 woman-years was 59% higher than the corresponding uncorrected rate (40.0; Table 1). Hysterectomy-corrected incidence varied widely by histologic subtype, being the highest for endometrioid carcinomas (47.3), followed by nonendometrioid carcinomas (12.4), sarcomas (2.8), and other malignancies (1.2). Hysterectomy correction increased rates by 81.2 among blacks, 58.3 among whites, 45.3 among Hispanics, and 22.7 among Asians. Hysterectomy-corrected rates for uterine cancer overall were similar for whites and blacks (67.6, respectively) but significantly lower among Hispanics (47.5) and Asians (40.0). Corrected endometrioid carcinoma rates were significantly higher among whites (52.6) compared with blacks (34.5), Hispanics (33.7), and Asians (29.6). In contrast, corrected nonendometrioid carcinoma rates were significantly higher among blacks (25.9) compared with whites (11.4), Hispanics (10.1), and Asians (7.5). Rates for sarcomas and for other malignancies were also highest among blacks (5.2 and 2.1, respectively).
TABLE 1.
Age-Adjusted Incidence Rates of Microscopically Confirmed Uterine Corpus Cancer Overall and by Histology and Race and Ethnicity, Uncorrected and Corrected for Hysterectomy Prevalence, Among US Women Age 30 to 79 Years According to SEER 18 (2000 to 2015)
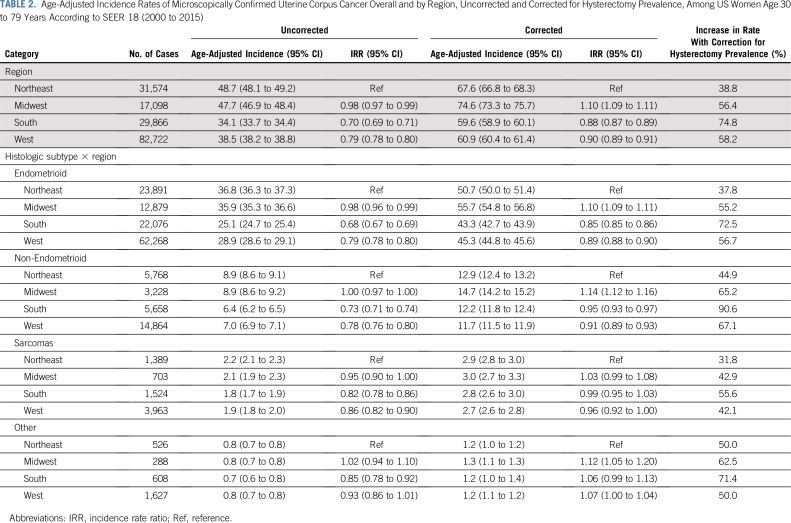
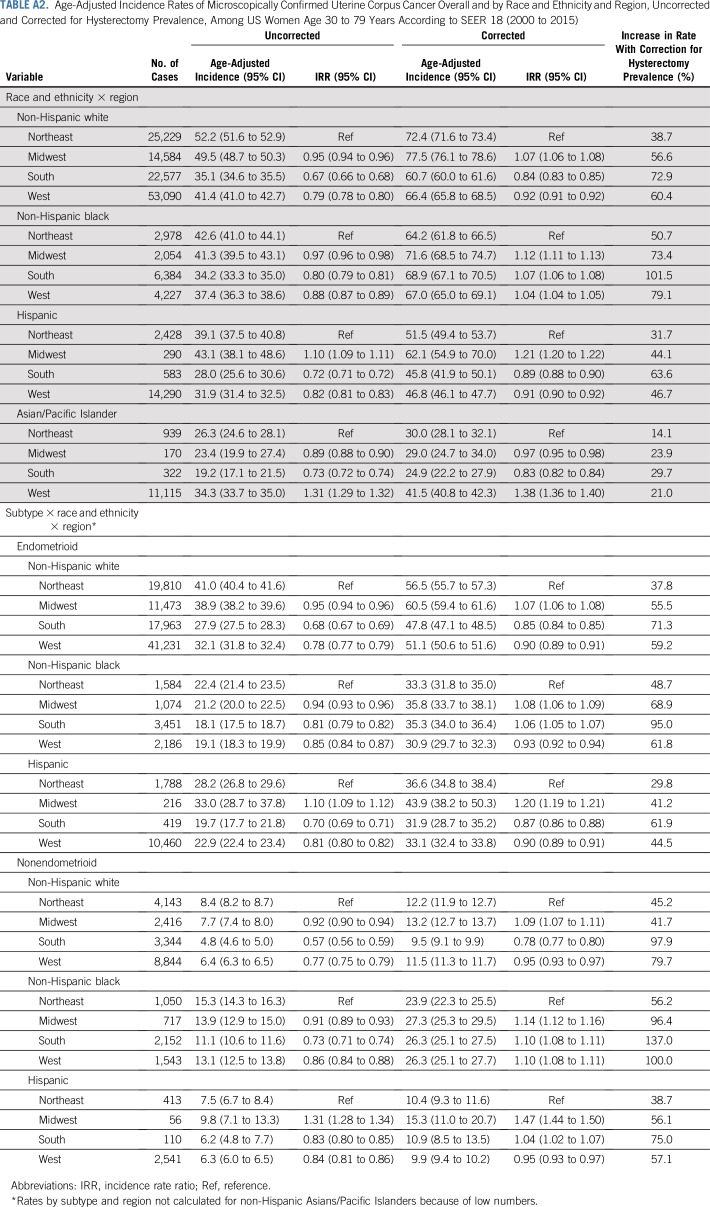
Uterine cancer rates overall and by subtype varied regionally (Table 2), with corrected rates highest in the Midwest. Overall, hysterectomy correction had the largest impact on rates in the South, particularly among blacks (Appendix Table A2, online only).
TABLE 2.
Age-Adjusted Incidence Rates of Microscopically Confirmed Uterine Corpus Cancer Overall and by Region, Uncorrected and Corrected for Hysterectomy Prevalence, Among US Women Age 30 to 79 Years According to SEER 18 (2000 to 2015)
Trends in Age-Adjusted Uterine Cancer Incidence Rates Overall and by Histologic Subtype
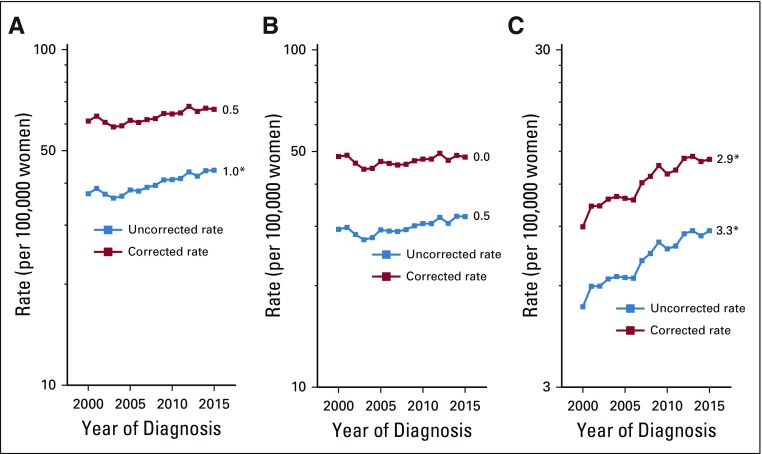
Hysterectomy correction had an important impact on uterine cancer trends. Among all women, uncorrected rates increased at approximately 1.0% (95% CI, 0.4% to 1.5%) per year during 2000 to 2015. After correction, the AAPC was reduced to 0.5% (95% CI, −0.1% to 1.1%) for the whole interval (Fig 1); however, corrected rates rose significantly between 2003 and 2015 (APC, 1.1%; 95% CI, 0.7% to 1.4%). Both uncorrected and corrected endometrioid cancer trends were stable, at 0.5% (95% CI, −0.1% to 1.2%) and 0.0% (95% CI, −0.7% to 0.6%), respectively. In contrast, uncorrected nonendometrioid cancer rates rose significantly, at 3.3% (95% CI, 2.8% to 3.7%) per year and similarly at 2.9% per year (95% CI, 2.4% to 3.4%) after correction. Both uncorrected and corrected sarcoma rates were stable (Appendix Fig A1, online only).
FIG 1.
Trends in age-adjusted incidence rates of microscopically confirmed uterine corpus cancer (A) overall and by (B) endometrioid and (C) nonendometrioid subtypes, uncorrected and corrected for hysterectomy prevalence, among US women age 30 to 79 years according to SEER 18 (2000 to 2015). All trends are summarized by a single annual percentage change estimate, with the exception of uncorrected and corrected overall rates, which are summarized by the average annual percentage change; trends for nonendometrioid carcinomas are plotted on a different scale. (*) Significantly different than zero at P < .05.
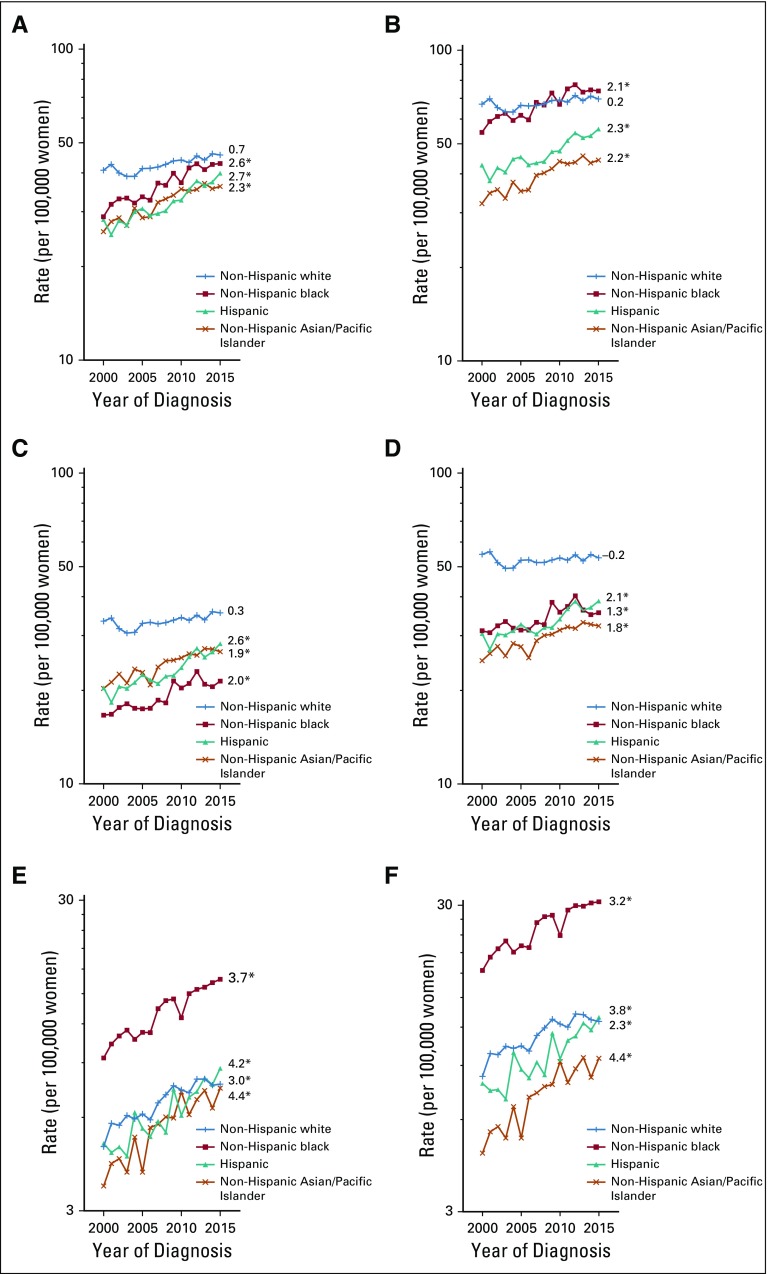
Hysterectomy-corrected trends for uterine cancer between 2000 and 2015 among whites were stable, with an AAPC of 0.2% (95% CI, −0.5% to 0.9%; Fig 2); however, rates rose significantly between 2003 and 2015 (APC, 0.8%; 95% CI, 0.4% to 1.2%). Corrected rates increased rapidly among blacks (APC, 2.1%; 95% CI, 1.5% to 2.6%), Hispanics (APC, 2.3%; 95% CI, 1.8% to 2.8%), and Asians (APC, 2.2%; 95% CI, 1.7% to 2.7%). Of note, corrected uterine cancer rates among blacks surpassed those among whites in 2007 and were consistently higher from 2011 through 2015 (Fig 2).
FIG 2.
Trends in age-adjusted incidence rates of microscopically confirmed uterine corpus cancer by race and ethnicity: (A, B) overall and by (C, D) endometrioid and (E, F) nonendometrioid subtypes, (A, C, E) uncorrected and (B, D, F) corrected for hysterectomy prevalence, among US women age 30 to 79 years according to SEER 18 (2000 to 2015). Uncorrected and corrected rates are shown separately among non-Hispanic whites (+), non-Hispanic blacks (solid square), Hispanics (solid triangle), and non-Hispanic Asians/Pacific Islanders (×). All trends are summarized by a single annual percentage change estimate, with the exception of uncorrected and corrected overall rates among non-Hispanic whites, which are summarized by the average annual percentage change; trends for nonendometrioid carcinomas are plotted on a different scale. (*) Significantly different than zero at P < .05.
For endometrioid carcinomas, corrected rates were stable among whites (APC, −0.2%; 95% CI, −0.9% to 0.5%). Corrected rates increased among blacks (APC, 1.3%; 95% CI, 0.7% to 2.0%), Hispanics (APC, 2.1%; 95% CI, 1.5% to 2.6%), and Asians (APC, 1.8%; 95% CI, 1.4% to 2.3%). Nonendometrioid carcinoma rates rose significantly among women in all racial/ethnic groups: 2.3% (95% CI, 1.0% to 3.7%) among whites, 3.2% (95% CI, 2.5% to 4.0%) among blacks, 3.8% (95% CI, 2.8% to 4.9%) among Hispanics, and 4.4% (95% CI, 3.1% to 5.6%) among Asians. Corrected sarcoma rates were stable in all groups (Appendix Fig A1).
Five-Year Relative Survival Overall, by Race and Ethnicity, Histologic Subtype, and Stage
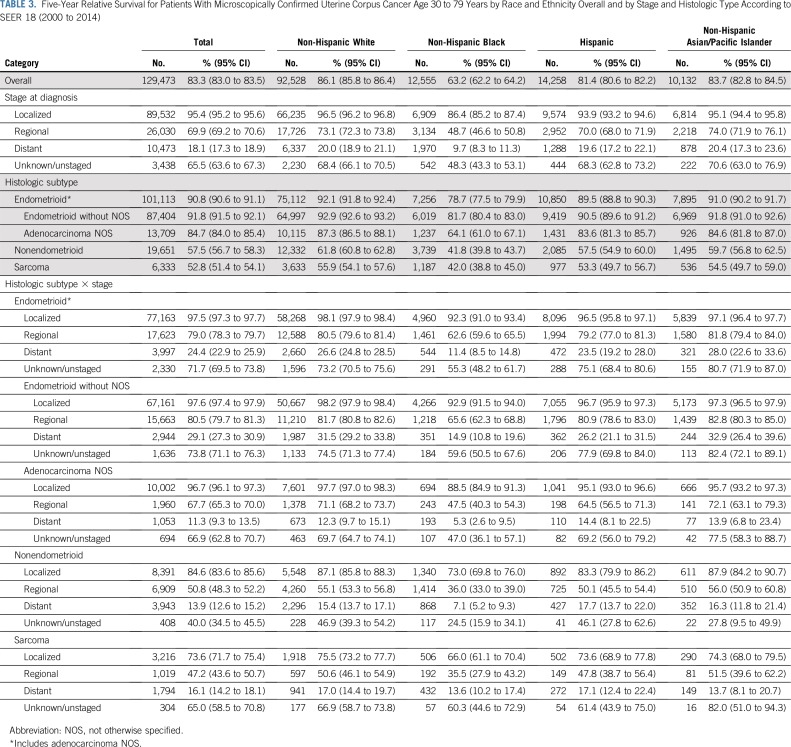
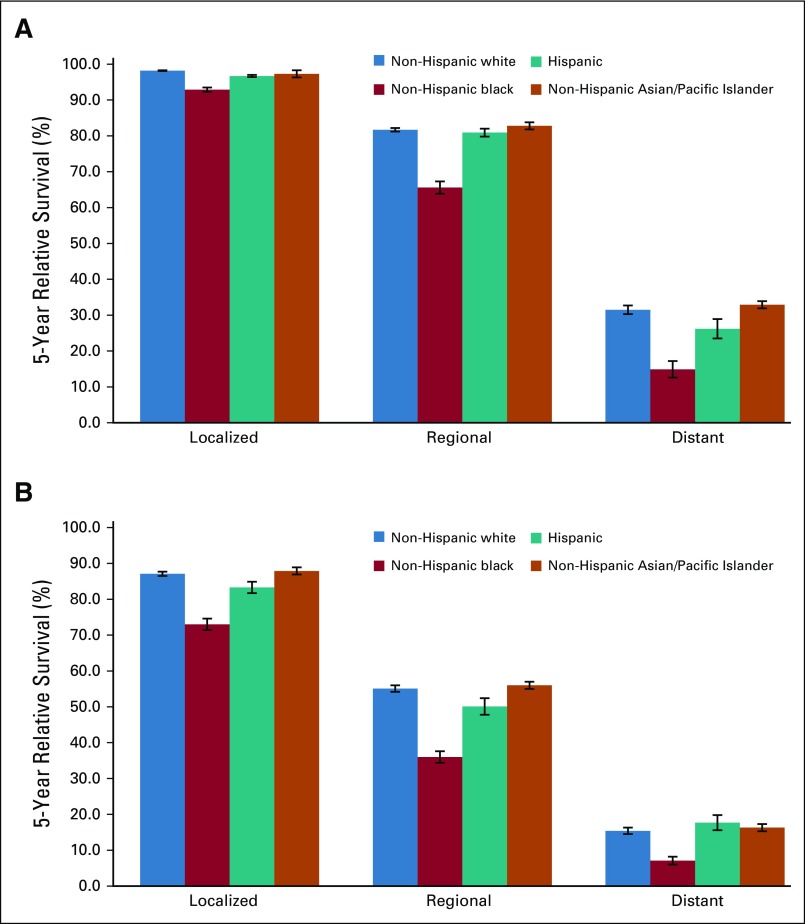
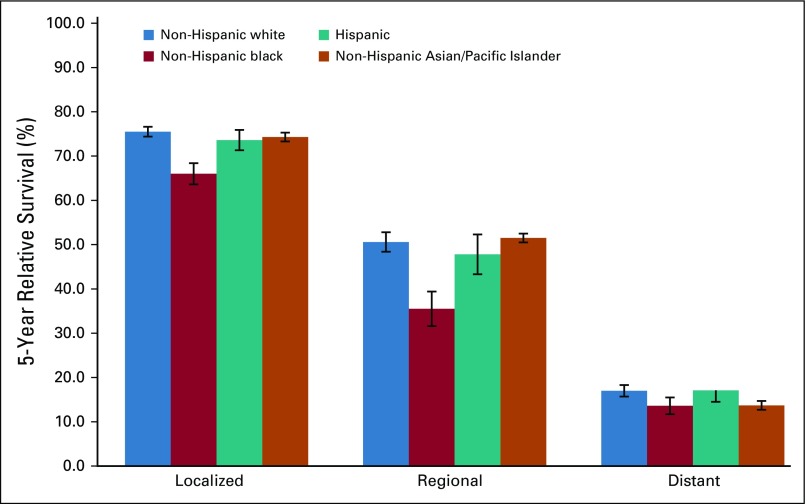
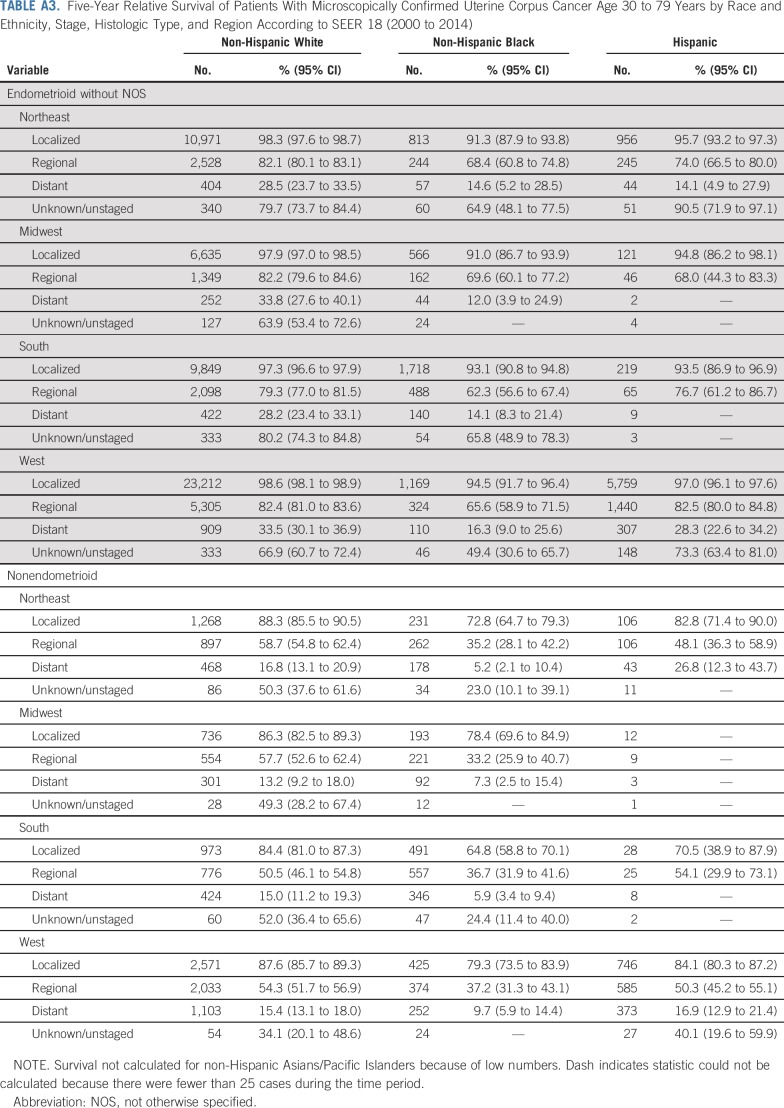
The overall 5-year relative survival rate among patients with uterine cancer was 83.3% and ranged from 95.4% among those with localized-stage to 69.9% among those with regional-stage and to 18.1% in those with distant-stage disease (Table 3). The 5-year relative survival rate was 91.8% in patients with endometrioid carcinomas (excluding adenocarcinoma NOS) and was significantly lower among those with nonendometrioid carcinomas or sarcomas (57.5% and 52.8%, respectively). Blacks had the lowest survival rates, irrespective of stage at diagnosis or histologic subtype (Table 3; Fig 3; Appendix Fig A2, online only). There were no apparent differences in survival among regions after stratifying by stage and histology (Appendix Table A3, online only).
TABLE 3.
Five-Year Relative Survival for Patients With Microscopically Confirmed Uterine Corpus Cancer Age 30 to 79 Years by Race and Ethnicity Overall and by Stage and Histologic Type According to SEER 18 (2000 to 2014)
FIG 3.
Five-year relative survival for patients with microscopically confirmed uterine corpus cancer age 30 to 79 years by stage at diagnosis and race and ethnicity for (A) endometrioid and (B) nonendometrioid subtypes. Expected survival for patients diagnosed between 2000 and 2014 was estimated with the Ederer II method, and relative survival was calculated by estimating the observed to the expected survival rate using the actuarial method. Error bars indicate standard error.
DISCUSSION
Our analysis shows that hysterectomy-corrected uterine cancer incidence rates have been significantly increasing by approximately 1% per year from 2003 to 2015, with the most rapid increases occurring in Hispanic, Asian, and black women, respectively. Among all women, we observed a concerning trend of increasing incidence of aggressive nonendometrioid subtypes, with particularly high rates in black women. Building on a previous observation,13 we show that hysterectomy-corrected uterine cancer rates in blacks have consistently exceeded those of whites since approximately 2007. In addition to higher incidence of nonendometrioid cancers, black women had substantially lower 5-year relative survival, irrespective of stage at diagnosis or histologic subtype, supporting previous observations and demonstrating strong racial differences and disparities related to both biologic and care-related factors among black women.24-27
Previous studies of uterine cancer incidence trends by race and ethnicity and histology have been mixed. A study evaluating trends in hysterectomy-corrected rates in women age 50 years or older suggested increasing rates of both endometrioid and nonendometrioid cancers in blacks but a significant decrease in the rate of endometrioid and nonstatistically significant increase in the rate of nonendometrioid cancers among whites.13 A study of women younger than 50 years of age suggested stable trends of hysterectomy-corrected rates of endometrioid carcinomas among whites and blacks but a significantly increasing trend among Hispanics.15 A recent study reported increasing rates of endometrioid carcinoma rates from 1999 to 2015 among all women, with decreases observed for all other histologic types; however, these rates were not corrected for hysterectomy prevalence.11 Moreover, in that analysis, cases with adenocarcinoma NOS histology were incorrectly grouped with nonendometrioid types, resulting in likely misattribution of many endometrioid carcinomas as nonendometrioid types, particularly in the earlier years.11
Our analysis of hysterectomy-corrected uterine cancer incidence rates among women age 30 to 79 years shows that rising rates are largely a result of the rapid increase of nonendometrioid subtypes among all racial and ethnic groups. Our data are in line with a recent study of hysterectomy-corrected uterine cancer incidence in Denmark, which showed increasing rates of nonendometrioid but not endometrioid carcinomas.28 Endometrioid carcinomas are more likely to be diagnosed at an early stage, with good overall survival; they are described as estrogen dependent and are more strongly associated with obesity.29 In contrast, patients with nonendometrioid carcinomas have worse survival, and risk has been less strongly associated with estrogen-related risk factors and obesity.29 Thus, the observed increases in nonendometrioid cancer incidence, combined with more stable rates of endometrioid cancers, challenge the prevailing hypothesis that the obesity epidemic and changing prevalence of hormonal risk factors are major contributors to rising uterine cancer incidence. Identifying risk factors and exposures more specifically associated with nonendometrioid cancers is needed to better understand the strong increases in this subtype and potentially address racial disparities.
To our knowledge, our study is the first to describe hysterectomy-corrected trends by histologic subtype among Hispanics and Asians. Despite lower uterine cancer incidence in these groups, rates have risen most rapidly among Hispanics and Asians, particularly nonendometrioid carcinomas. Risk factors such as obesity, diabetes, and metabolic syndrome are highly prevalent among Hispanic women30-32 and have been increasing among Asian American populations.33,34 However, it is unlikely that these risk factors cannot fully explain the pronounced increases in nonendometrioid cancer rates among these women. With respect to survival, we found that Asians had 5-year relative survival similar to those of whites, whereas survival was poorer among Hispanics, in line with some35,36 but not all studies.37-39 It is possible that these differences result from variation in cohort selection, data sources, and the ability to account for differences in treatment and comorbidities.
Another unique aspect of this study was the assessment of uterine cancer incidence and survival by geographic region. Hysterectomy prevalence varied widely by region, with the highest rates in the South and lowest in the Northeast. Hysterectomy correction decreased regional differences observed using uncorrected rates, suggesting these differences largely reflect regional variation in hysterectomy prevalence rather than true differences in cancer incidence. Our analysis underscores the importance of using hysterectomy-corrected rates to understand variation in the regional burden of uterine cancer in the United States.16 Importantly, after stratifying by race and ethnicity, histology, and stage at diagnosis, we did not observe strong regional differences in the survival rates of patients with uterine cancer.
Our analysis provides nationally representative hysterectomy-corrected estimates of uterine cancer incidence and trends, overall and by histologic subtype, using the most recent data from SEER 18 registries. In addition, we used a new approach to better account for unclassified adenocarcinomas compared with previous studies. The proportion of adenocarcinomas NOS has decreased substantially over time, and incorrect attribution of these poorly classified cases can affect subtype-specific rates.11 Our proportional allocation of adenocarcinomas NOS to the two main subtypes provides incidence estimates that are closer to the true underlying incidence. Some limitations are worth noting. First, although BRFSS is the only nationally representative database with state-level hysterectomy prevalence estimates, response rates have been lower compared with other surveys, which may affect data representativeness.40 Moreover, it is possible that the region-specific hysterectomy prevalence estimates do not completely overlap with SEER catchment areas. Finally, although SEER registries use standardized codes and procedures for classifying race and ethnicity data, initial collection of this information is carried out by health care facilities and practitioners, and misclassification is possible.41
To our knowledge, this study represents the most comprehensive analysis of hysterectomy-corrected uterine cancer incidence trends and survival conducted to date. Our findings show profound racial differences and disparities with respect to subtype-specific incidence and survival, indicated by the higher burden of nonendometrioid subtypes and poorer survival irrespective of stage or histology among black women, suggesting a combination of biologic and care-related factors. We confirm that uterine cancer incidence rates among black women have surpassed those of white women since 2007 and have remained consistently higher through 2015. A striking finding from our study is that recent increases have been primarily driven by rising rates of aggressive nonendometrioid histologic subtypes among all racial and ethnic subgroups. Contrary to prior assumptions, it is unlikely that the rising prevalence of obesity and changes in hormonal risk factors can fully explain the increasing uterine cancer incidence trends, because these factors are equally or more strongly associated with endometrioid cancers, the rates for which remained more stable over time in our study. Future studies are needed to clarify the factors underlying the remarkable rise in nonendometrioid carcinoma incidence.
Appendix
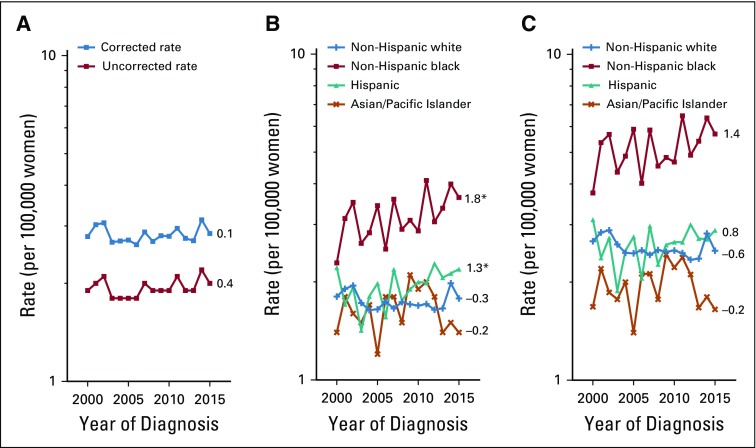
FIG A1.
Trends in age-adjusted incidence rates of microscopically confirmed uterine corpus sarcomas overall and by race and ethnicity, uncorrected and corrected for hysterectomy prevalence, among US women age 30 to 79 years according to SEER 18 (2000 to 2015). (A) Uncorrected and corrected rates for sarcomas among all women. (B) Uncorrected and (C) corrected rates for non-Hispanic whites (+), non-Hispanic blacks (solid square), Hispanics (solid triangle), and non-Hispanic Asians/Pacific Islanders (×). Annual percentage change estimates are shown next to each respective curve. (*) Significantly different than zero at P < .05.
FIG A2.
Five-year relative survival for patients with microscopically confirmed uterine corpus sarcoma age 30 to 79 years by stage at diagnosis and race and ethnicity. Expected survival for patients diagnosed between 2000 and 2014 was estimated with the Ederer II method, and relative survival was calculated by estimating the observed to the expected survival rate using the actuarial method. Error bars indicate standard error.
TABLE A1.
Number of Cases by ICD-O-3 Histology Codes by Histologic Subtype Among US Women Age 30 to 79 Years According to SEER 18 (2000 to 2015)
TABLE A2.
Age-Adjusted Incidence Rates of Microscopically Confirmed Uterine Corpus Cancer Overall and by Race and Ethnicity and Region, Uncorrected and Corrected for Hysterectomy Prevalence, Among US Women Age 30 to 79 Years According to SEER 18 (2000 to 2015)
TABLE A3.
Five-Year Relative Survival of Patients With Microscopically Confirmed Uterine Corpus Cancer Age 30 to 79 Years by Race and Ethnicity, Stage, Histologic Type, and Region According to SEER 18 (2000 to 2014)
Footnotes
Supported by Intramural Research Program Grant No. Z01 CP010124-21 from the National Cancer Institute, National Institutes of Health.
See accompanying Editorial on page 1851
AUTHOR CONTRIBUTIONS
Conception and design: Megan A. Clarke, Susan S. Devesa, Nicolas Wentzensen
Administrative support: Nicolas Wentzensen
Collection and assembly of data: Megan A. Clarke, Nicolas Wentzensen
Data analysis and interpretation: All authors
Manuscript writing: All authors
Final approval of manuscript: All authors
Accountable for all aspects of the work: All authors
AUTHORS' DISCLOSURES OF POTENTIAL CONFLICTS OF INTEREST
Hysterectomy-Corrected Uterine Corpus Cancer Incidence Trends and Differences in Relative Survival Reveal Racial Disparities and Rising Rates of Nonendometrioid Cancers
The following represents disclosure information provided by authors of this manuscript. All relationships are considered compensated. Relationships are self-held unless noted. I = Immediate Family Member, Inst = My Institution. Relationships may not relate to the subject matter of this manuscript. For more information about ASCO's conflict of interest policy, please refer to www.asco.org/rwc or ascopubs.org/jco/site/ifc.
Megan A. Clarke
Stock and Other Ownership Interests: Merck, Johnson & Johnson
Susan S. Devesa
Stock and Other Ownership Interests: HCA Healthcare, Gilead Sciences, Celgene, Agilent, CVS Health, Encompass Healthcare
Nicolas Wentzensen
Other Relationship: Roche, Becton Dickinson
No other potential conflicts of interest were reported.
REFERENCES
- 1.Siegel RL, Miller KD, Jemal A. Cancer statistics, 2018. CA Cancer J Clin. 2018;68:7–30. doi: 10.3322/caac.21442. [DOI] [PubMed] [Google Scholar]
- 2. doi: 10.1093/jnci/djx214. Lortet-Tieulent J, Ferlay J, Bray F, et al: International patterns and trends in endometrial cancer incidence, 1978-2013. J Natl Cancer Inst 110:354-361, 2018. [DOI] [PubMed] [Google Scholar]
- 3.Rahib L, Smith BD, Aizenberg R, et al. Projecting cancer incidence and deaths to 2030: The unexpected burden of thyroid, liver, and pancreas cancers in the United States. Cancer Res. 2014;74:2913–2921. doi: 10.1158/0008-5472.CAN-14-0155. [DOI] [PubMed] [Google Scholar]
- 4.Sheikh MA, Althouse AD, Freese KE, et al. USA endometrial cancer projections to 2030: Should we be concerned? Future Oncol. 2014;10:2561–2568. doi: 10.2217/fon.14.192. [DOI] [PubMed] [Google Scholar]
- 5.Wartko P, Sherman ME, Yang HP, et al. Recent changes in endometrial cancer trends among menopausal-age U.S. women. Cancer Epidemiol. 2013;37:374–377. doi: 10.1016/j.canep.2013.03.008. [DOI] [PMC free article] [PubMed] [Google Scholar]
- 6.Suarez AA, Felix AS, Cohn DE. Bokhman Redux: Endometrial cancer “types” in the 21st century. Gynecol Oncol. 2017;144:243–249. doi: 10.1016/j.ygyno.2016.12.010. [DOI] [PubMed] [Google Scholar]
- 7.Felix AS, Brinton LA. Cancer progress and priorities: Uterine cancer. Cancer Epidemiol Biomarkers Prev. 2018;27:985–994. doi: 10.1158/1055-9965.EPI-18-0264. [DOI] [PMC free article] [PubMed] [Google Scholar]
- 8.Cote ML, Ruterbusch JJ, Olson SH, et al. The growing burden of endometrial cancer: A major racial disparity affecting black women. Cancer Epidemiol Biomarkers Prev. 2015;24:1407–1415. doi: 10.1158/1055-9965.EPI-15-0316. [DOI] [PubMed] [Google Scholar]
- 9.Long B, Liu FW, Bristow RE. Disparities in uterine cancer epidemiology, treatment, and survival among African Americans in the United States. Gynecol Oncol. 2013;130:652–659. doi: 10.1016/j.ygyno.2013.05.020. [DOI] [PMC free article] [PubMed] [Google Scholar]
- 10.Tarney CM, Tian C, Wang G, et al. Impact of age at diagnosis on racial disparities in endometrial cancer patients. Gynecol Oncol. 2018;149:12–21. doi: 10.1016/j.ygyno.2017.07.145. [DOI] [PMC free article] [PubMed] [Google Scholar]
- 11.Henley SJ, Miller JW, Dowling NF, et al. Uterine cancer incidence and mortality: United States, 1999-2016. MMWR Morb Mortal Wkly Rep. 2018;67:1333–1338. doi: 10.15585/mmwr.mm6748a1. [DOI] [PMC free article] [PubMed] [Google Scholar]
- 12.Hosh M, Antar S, Nazzal A, et al. Uterine sarcoma: Analysis of 13,089 cases based on Surveillance, Epidemiology, and End Results database. Int J Gynecol Cancer. 2016;26:1098–1104. doi: 10.1097/IGC.0000000000000720. [DOI] [PubMed] [Google Scholar]
- 13.Jamison PM, Noone AM, Ries LA, et al. Trends in endometrial cancer incidence by race and histology with a correction for the prevalence of hysterectomy, SEER 1992 to 2008. Cancer Epidemiol Biomarkers Prev. 2013;22:233–241. doi: 10.1158/1055-9965.EPI-12-0996. [DOI] [PubMed] [Google Scholar]
- 14.Sherman ME, Carreon JD, Lacey JV, Jr, et al. Impact of hysterectomy on endometrial carcinoma rates in the United States. J Natl Cancer Inst. 2005;97:1700–1702. doi: 10.1093/jnci/dji378. [DOI] [PubMed] [Google Scholar]
- 15.Temkin SM, Kohn EC, Penberthy L, et al. Hysterectomy-corrected rates of endometrial cancer among women younger than age 50 in the United States. Cancer Causes Control. 2018;29:427–433. doi: 10.1007/s10552-018-1018-z. [DOI] [PubMed] [Google Scholar]
- 16.Siegel RL, Devesa SS, Cokkinides V, et al. State-level uterine corpus cancer incidence rates corrected for hysterectomy prevalence, 2004 to 2008. Cancer Epidemiol Biomarkers Prev. 2013;22:25–31. doi: 10.1158/1055-9965.EPI-12-0991. [DOI] [PMC free article] [PubMed] [Google Scholar]
- 17.Mariotto AB, Zou Z, Johnson CJ, et al. Geographical, racial and socio-economic variation in life expectancy in the US and their impact on cancer relative survival. PLoS One. 2018;13:e0201034. doi: 10.1371/journal.pone.0201034. [DOI] [PMC free article] [PubMed] [Google Scholar]
- 18. National Cancer Institute: Surveillance, Epidemiology, and End Results Program: SEER*Stat Databases—Incidence: SEER18 Regs research data, Nov 2017 sub (2000-2015) <Katrina/Rita population adjustment>. https://seer.cancer.gov/data-software/documentation/seerstat/nov2017/
- 19. National Cancer Institute: Surveillance, Epidemiology, and End Results Program: Race recode changes for the 1973-2005 SEER research data (November 2007 submission) and later releases. https://seer.cancer.gov/seerstat/variables/seer/race_ethnicity/
- 20. Centers for Disease Control and Prevention: Behavioral Risk Factor Surveillance System: Annual survey data. https://www.cdc.gov/brfss/annual_data/annual_data.htm.
- 21.Kim HJ, Fay MP, Feuer EJ, et al. Permutation tests for joinpoint regression with applications to cancer rates. Stat Med. 2000;19:335–351. doi: 10.1002/(sici)1097-0258(20000215)19:3<335::aid-sim336>3.0.co;2-z. [DOI] [PubMed] [Google Scholar]
- 22.Devesa SS, Donaldson J, Fears T. Graphical presentation of trends in rates. Am J Epidemiol. 1995;141:300–304. doi: 10.1093/aje/141.4.300. [DOI] [PubMed] [Google Scholar]
- 23. Cho H, Howlader N, Mariotto AB, et al: Surveillance Research Program, NCI, Technical Report #2011-01: Estimating relative survival for cancer patients from the SEER program using expected rates based on Ederer I versus Ederer II method. https://surveillance.cancer.gov/reports/tech2011.01.pdf.
- 24.Olson SH, Atoria CL, Cote ML, et al. The impact of race and comorbidity on survival in endometrial cancer. Cancer Epidemiol Biomarkers Prev. 2012;21:753–760. doi: 10.1158/1055-9965.EPI-11-0735. [DOI] [PubMed] [Google Scholar]
- 25.Sherman ME, Devesa SS. Analysis of racial differences in incidence, survival, and mortality for malignant tumors of the uterine corpus. Cancer. 2003;98:176–186. doi: 10.1002/cncr.11484. [DOI] [PubMed] [Google Scholar]
- 26.Baskovic M, Lichtensztajn DY, Nguyen T, et al. Racial disparities in outcomes for high-grade uterine cancer: A California cancer registry study. Cancer Med. 2018;7:4485–4495. doi: 10.1002/cam4.1742. [DOI] [PMC free article] [PubMed] [Google Scholar]
- 27.Randall TC, Armstrong K. Differences in treatment and outcome between African-American and white women with endometrial cancer. J Clin Oncol. 2003;21:4200–4206. doi: 10.1200/JCO.2003.01.218. [DOI] [PubMed] [Google Scholar]
- 28.Faber MT, Frederiksen K, Jensen A, et al. Time trends in the incidence of hysterectomy-corrected overall, type 1 and type 2 endometrial cancer in Denmark 1978-2014. Gynecol Oncol. 2017;146:359–367. doi: 10.1016/j.ygyno.2017.05.015. [DOI] [PubMed] [Google Scholar]
- 29.Setiawan VW, Yang HP, Pike MC, et al. Type I and II endometrial cancers: Have they different risk factors? J Clin Oncol. 2013;31:2607–2618. doi: 10.1200/JCO.2012.48.2596. [DOI] [PMC free article] [PubMed] [Google Scholar]
- 30.Aguilar M, Bhuket T, Torres S, et al. Prevalence of the metabolic syndrome in the United States, 2003-2012. JAMA. 2015;313:1973–1974. doi: 10.1001/jama.2015.4260. [DOI] [PubMed] [Google Scholar]
- 31.Hales CM, Carroll MD, Fryar CD, et al. Prevalence of obesity among adults and youth: United States, 2015-2016. NCHS Data Brief. 2017;288:1–8. [PubMed] [Google Scholar]
- 32.Geiss LS, Wang J, Cheng YJ, et al. Prevalence and incidence trends for diagnosed diabetes among adults aged 20 to 79 years, United States, 1980-2012. JAMA. 2014;312:1218–1226. doi: 10.1001/jama.2014.11494. [DOI] [PubMed] [Google Scholar]
- 33.Ye J, Rust G, Baltrus P, et al. Cardiovascular risk factors among Asian Americans: Results from a National Health Survey. Ann Epidemiol. 2009;19:718–723. doi: 10.1016/j.annepidem.2009.03.022. [DOI] [PMC free article] [PubMed] [Google Scholar]
- 34.Lee JW, Brancati FL, Yeh HC. Trends in the prevalence of type 2 diabetes in Asians versus whites: Results from the United States National Health Interview Survey, 1997-2008. Diabetes Care. 2011;34:353–357. doi: 10.2337/dc10-0746. [DOI] [PMC free article] [PubMed] [Google Scholar]
- 35.Rodriguez AM, Schmeler KM, Kuo YF. Disparities in endometrial cancer outcomes between non-Hispanic white and Hispanic women. Gynecol Oncol. 2014;135:525–533. doi: 10.1016/j.ygyno.2014.10.021. [DOI] [PubMed] [Google Scholar]
- 36.Bregar AJ, Alejandro Rauh-Hain J, Spencer R, et al. Disparities in receipt of care for high-grade endometrial cancer: A National Cancer Data Base analysis. Gynecol Oncol. 2017;145:114–121. doi: 10.1016/j.ygyno.2017.01.024. [DOI] [PubMed] [Google Scholar]
- 37.Mahdi H, Hou H, Kowk LL, et al. Type II endometrial cancer in Hispanic women: Tumor characteristics, treatment and survival compared to non-Hispanic white women. Gynecol Oncol. 2014;133:512–517. doi: 10.1016/j.ygyno.2014.03.562. [DOI] [PubMed] [Google Scholar]
- 38.Malagon-Blackwell EM, Seagle BL, Nieves-Neira W, et al. The Hispanic paradox in endometrial cancer: A National Cancer Database study. Gynecol Oncol. 2017;146:351–358. doi: 10.1016/j.ygyno.2017.05.026. [DOI] [PubMed] [Google Scholar]
- 39.Cook LS, Nelson HE, Cockburn M, et al. Comorbidities and endometrial cancer survival in Hispanics and non-Hispanic whites. Cancer Causes Control. 2013;24:61–69. doi: 10.1007/s10552-012-0090-z. [DOI] [PMC free article] [PubMed] [Google Scholar]
- 40.Pierannunzi C, Hu SS, Balluz L. A systematic review of publications assessing reliability and validity of the Behavioral Risk Factor Surveillance System (BRFSS), 2004-2011. BMC Med Res Methodol. 2013;13:49. doi: 10.1186/1471-2288-13-49. [DOI] [PMC free article] [PubMed] [Google Scholar]
- 41.Polite BN, Adams-Campbell LL, Brawley OW, et al. Charting the future of cancer health disparities research: A position statement from the American Association for Cancer Research, the American Cancer Society, the American Society of Clinical Oncology, and the National Cancer Institute. J Clin Oncol. 2017;35:3075–3082. doi: 10.1200/JCO.2017.73.6546. [DOI] [PubMed] [Google Scholar]


