Summary:
The study of the origin and development of cerebellar tumors has been hampered by the complexity and heterogeneity of cerebellar cells that change over the course of development. We used single-cell transcriptomics to study >60,000 cells from the developing murine cerebellum, and show that different molecular subgroups of childhood cerebellar tumors mirror the transcription of cells from distinct, temporally restricted cerebellar lineages. Sonic Hedgehog medulloblastoma transcriptionally mirrors the granule cell hierarchy as expected, whereas Group3 MB resemble Nestin+ve stem cells, Group 4 MB resemble unipolar brush cells, and PFA/PFB ependymoma and cerebellar pilocytic astrocytoma resemble the pre-natal gliogenic progenitor cells. Furthermore, single-cell transcriptomics of human childhood cerebellar tumors demonstrates that many bulk tumors contain a mixed population of cells with divergent differentiation. Our data highlight cerebellar tumors as a disorder of early brain development, and provide a proximate explanation for the peak incidence of cerebellar tumors in early childhood.
Introduction
Pediatric brain tumors are most commonly found in the posterior fossa, particularly the cerebellum, where medulloblastoma, ependymoma, and pilocytic astrocytoma are most prevalent. Cerebellar tumors are currently treated using non-specific therapies. They have few somatically mutated driver genes2,17,22–26 which has impeded the understanding of their biology and resulted in the development of targeted therapies lagging behind other major cancer types. Nevertheless, childhood cerebellar tumor types are known to have distinct molecular subtypes with different clinical behaviours. ‘Medulloblastoma’ is now known to comprise four molecularly distinct diseases (subgroups), with further clinical and molecular heterogeneity within each subgroup1–5. Sonic Hedgehog (Shh-MB), Group 3 (Grp3-MB), and Group 4 medulloblastoma (Grp4-MB) are thought to originate in the cerebellum6–11, while Wnt-MB arises from the lower rhombic lip of the developing brain stem12. Although Shh-MB is thought to arise from the granule cell precursors (GCPs), careful examination of fully developed Shh-MB revealed populations of cells displaying varying levels of differentiation and growth capacity, mirroring the temporal evolution of the developing GCP hierarchy13. It is currently unclear to what extent the other molecular subgroups of medulloblastoma recapitulate a similar developmental hierarchy. Ependymomas are found throughout the central nervous system, but in the cerebellum are thought to be largely limited to two variants: PFA and PFB14–16, and have been suggested to arise from regional radial glial-like cells17–19. Molecular subgroups of medulloblastoma and ependymoma have been delineated by transcriptomics as well as patterns of DNA CpG methylation, both of which have been suggested to reflect the cell of origin20,21.
The cerebellum is made up of a large variety of cell types, with many undergoing temporally regulated differentiation through defined developmental hierarchies27–29. GABAergic neurons, including Purkinje cells and a variety of interneurons, arise from the ventricular zone (VZ), while glutamatergic neurons, including those of the cerebellar nuclei (CN), the inner granule cell layer, and the unipolar brush cells (UBCs) arise from the upper rhombic lip (URL). Cerebellar glial cells, including radial glia, astrocytes, and Bergmann glia also arise from stem cells in the VZ that produce a proliferating progenitor still present in the cerebellar cortex after birth30–32. In the past, transcriptional studies of bulk cerebellar tissue were performed on a complex mixture of GABAergic neurons, glutamatergic neurons, glia, and non-neuronal cells. The use of mixed transcriptomes from normal bulk cerebellum precludes a meaningful comparison to the transcriptome or epigenome of cerebellar tumors. Massive changes during early development, and the relative inaccessibility of the cerebellum inside the skull further complicate the study of the normal developing cerebellum, particularly from human samples. However, the recent development of large-scale single cell RNA sequencing (scRNA-seq) permits the development of a ‘cellular scaffold’53,54 for cerebellar development in which the transcriptomes of distinct hierarchies can be determined at various points in time, and subsequently compared to the transcriptomes of childhood cerebellar tumors. Identification of temporally and lineage restricted cell populations in the developing cerebellum that most closely mirror the transcriptome of cerebellar neoplasms could allow for identification of tumor cells of origin, as transcriptional similarity can be construed as good evidence for the lineage of cellular origin. Although it remains possible that a more differentiated cell could ‘de-differentiate,’ or that a cell from another lineage hierarchy could ‘trans-differentiate’ during the process of transformation32 there is scant evidence for de-differentiation or trans-differentiation in human brain tumors. Furthermore, because of the low mutational burden in cerebellar tumors, it would seem likely that the tumor remains similar to its cell of origin. Benefits of matching cerebellar tumors to their transcriptional best match from cerebellar development include the discovery of developmental checkpoints defective in cerebellar tumors, the development of clinically relevant mouse models, and direct comparison of tumor and normal cell transcriptomes to discover tumor-related changes in transcriptional programs. Insights into the process of transformation from a normal cerebellar cell to a cerebellar cancer cell could lead to the development of novel targeted therapies.
Identification of transcriptional clusters in the developing murine cerebellum
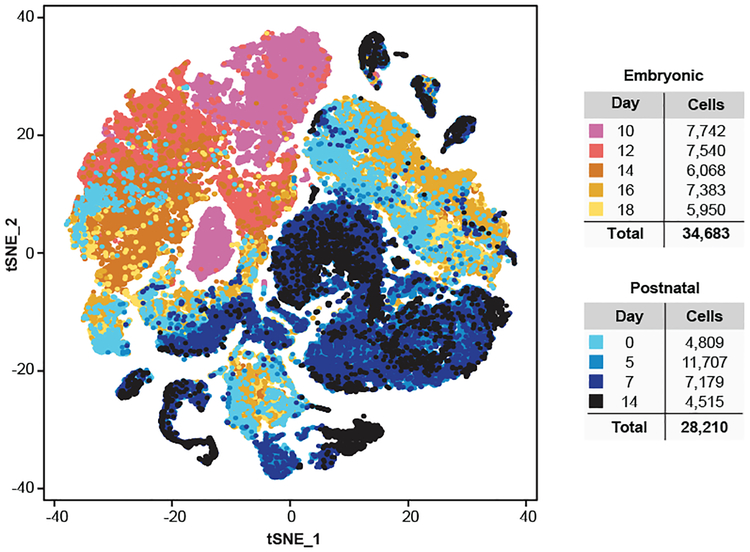
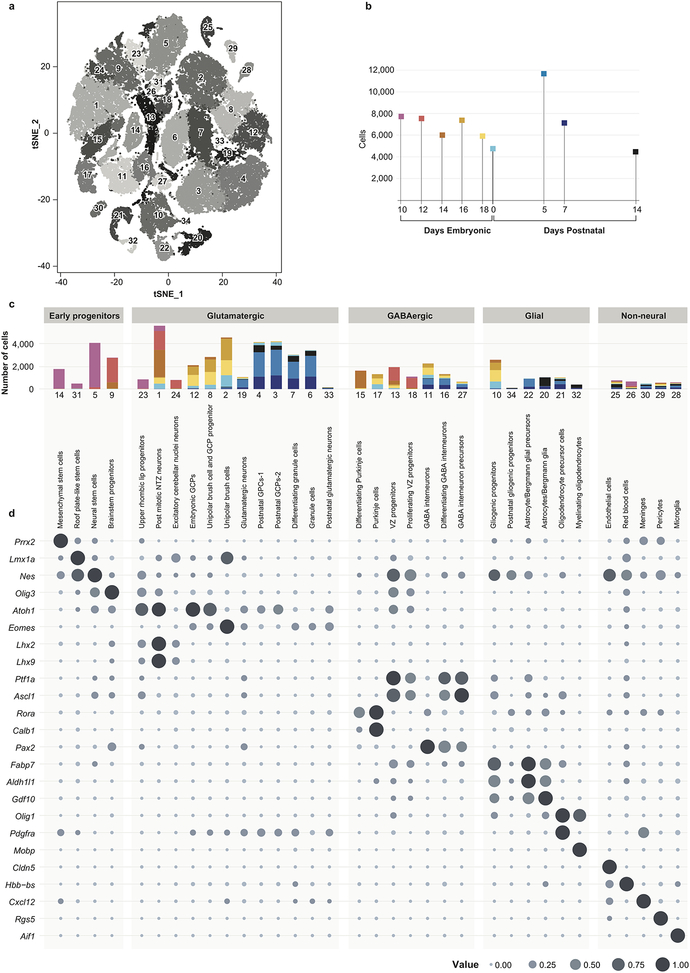
We isolated the mesial cerebellum (E14-P14), or hindbrain (E10-E12) from wild-type mice, and performed scRNA-seq on > 60,000 cells from five embryonal time points and four early postnatal time points (Figure-1, Extended Figure-1 a–c, Extended Figure-2). Unsupervised clustering of individual cell transcriptomes yielded >30 distinct clusters, many of which were heavily populated by cells from specific time points in development (Figure-1). Expression of known marker genes allowed identification of clusters of progenitors belonging to glutamatergic (Atoh1), GABAergic (Ptf1a, Calb1, Pax2) and glial (Fabp7, Gdf10, Olig1) lineages (Extended Figure-1d, Extended Figure-4). Stem cell-like clusters marked by Nestin expression were primarily seen early, while glutamatergic and GABAergic neuronal populations appeared in mid development, and glial cells developed later overall. Conversely non-CNS cells were found across all time points. Several distinct clusters of cells only appear during restricted developmental time points, with many not found in the postnatal period (Extended Figure-4). We conclude that scRNA-seq is able to identify biologically distinct cerebellar cellular populations.
Figure 1. Identification of cell types in the developing mouse cerebellum.
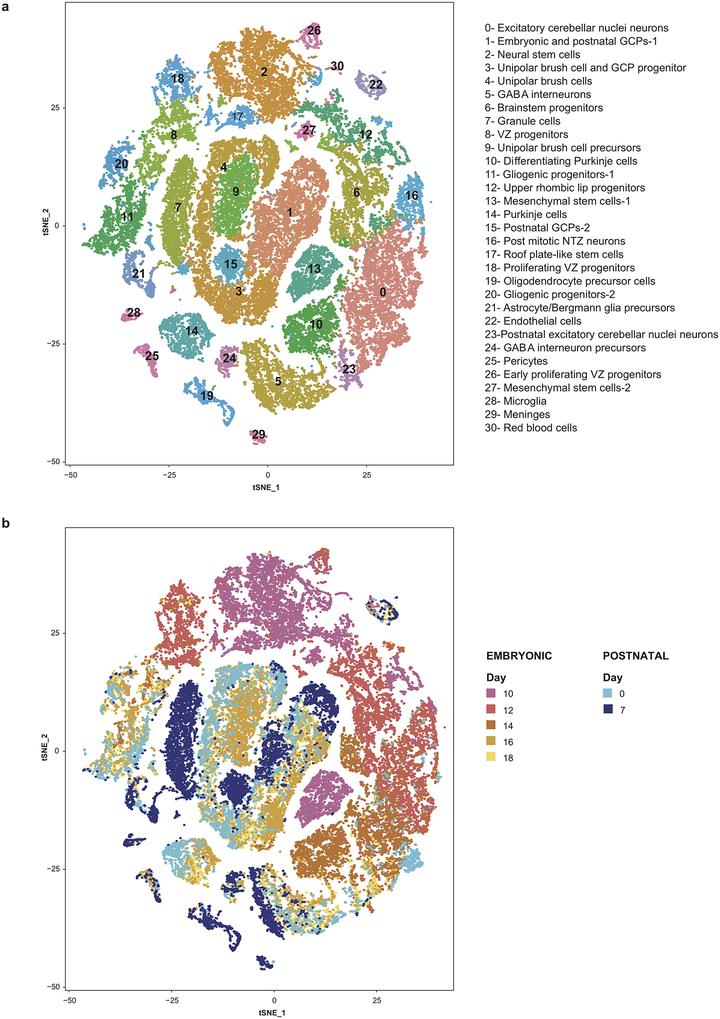
t-SNE visualization of transcriptionally distinct cell populations from 62,040 single cells from nine developmental time points. Clusters of cells were identified using a shared nearest neighbour (SNN) modularity optimization based clustering algorithm implemented by Seurat. The cells are color-coded by time point as indicated by the legend on the right.
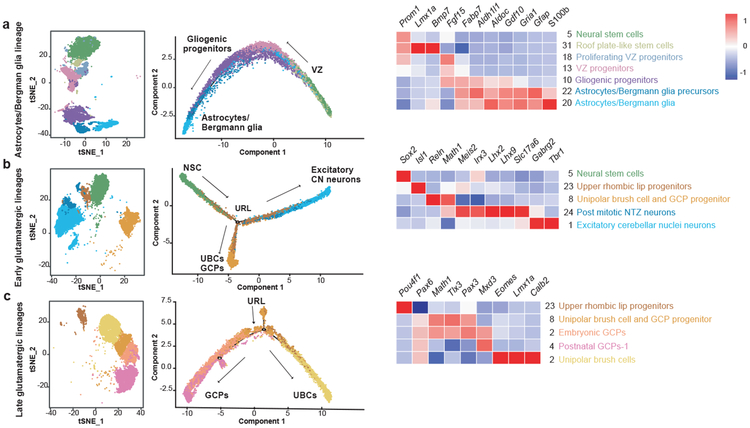
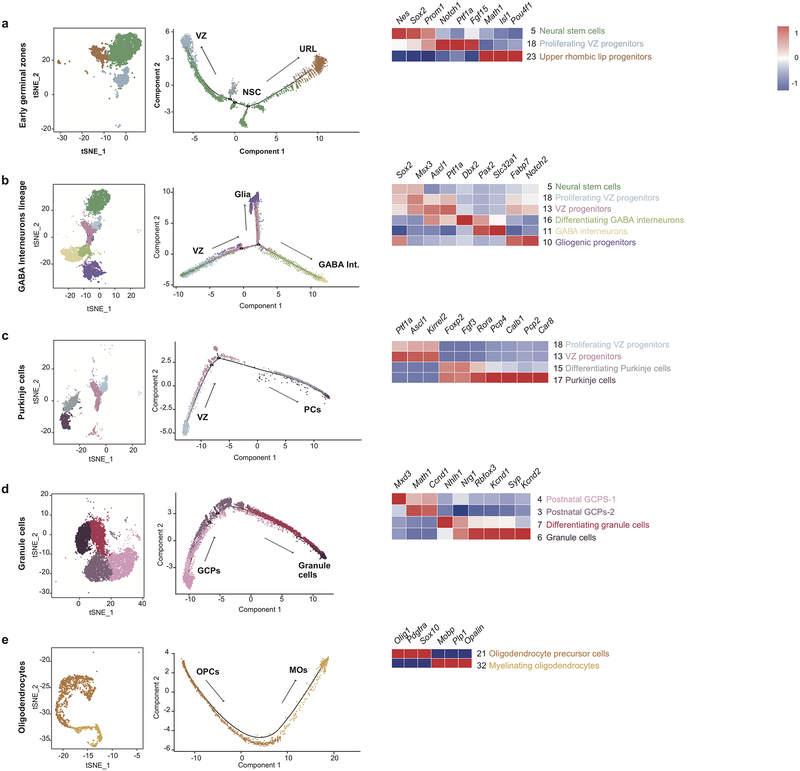
Based on known developmental relationships, and transcriptional similarity, we constructed pseudo-time trajectories for the various cerebellar lineages (Figure-2, Extended Figure-3). Nestin+ve early neural stem cells give rise to the two major lineages of the cerebellum: GABAergic cells from the ventricular zone (VZ) and glutamatergic cells from the URL (Extended Figure-3a). Stem cells in the VZ give rise to both GABAergic neurons (Purkinje cells and GABAergic interneurons) as well as the cerebellar glia (Figure-2a, Extended Figure-3b,c). The URL gives rise to excitatory neurons of the cerebellar nuclei, GCPs, and UBCs (Figure-2b,c, Extended Figure-3d). Clustering of scRNA-seq profiles combined with the construction of pseudo-time trajectories that largely conform to known patterns of cerebellar development allows us to build a ‘single cell genomic transcriptional scaffold’ of cerebellar development (Extended Figure-4).
Figure 2. Re-construction of cerebellar developmental lineages through pseudo-temporal ordering of cells.
t-SNE visualization and two-dimensional embedding showing constructed pseudo-time trajectories of different lineages in the developing cerebellum: Astrocyte/Bergmann glia lineage (n=12,304 cells) (a), Early glutamatergic lineage (n=14,358 cells) (b), Late glutamatergic lineage (n=14,662 cells) (c). Cells within specific lineage clusters were selected, visualized using Seurat’s t-SNE visualization and then ordered based on Monocle 2’s reverse-graph embedding (RGE) method. Heatmaps demonstrate gene normalized expression levels of cluster-specific markers, red being highest and blue being lowest.
Cerebellar tumors mirror the transcriptomes of specific embryonic cerebellar cell clusters.
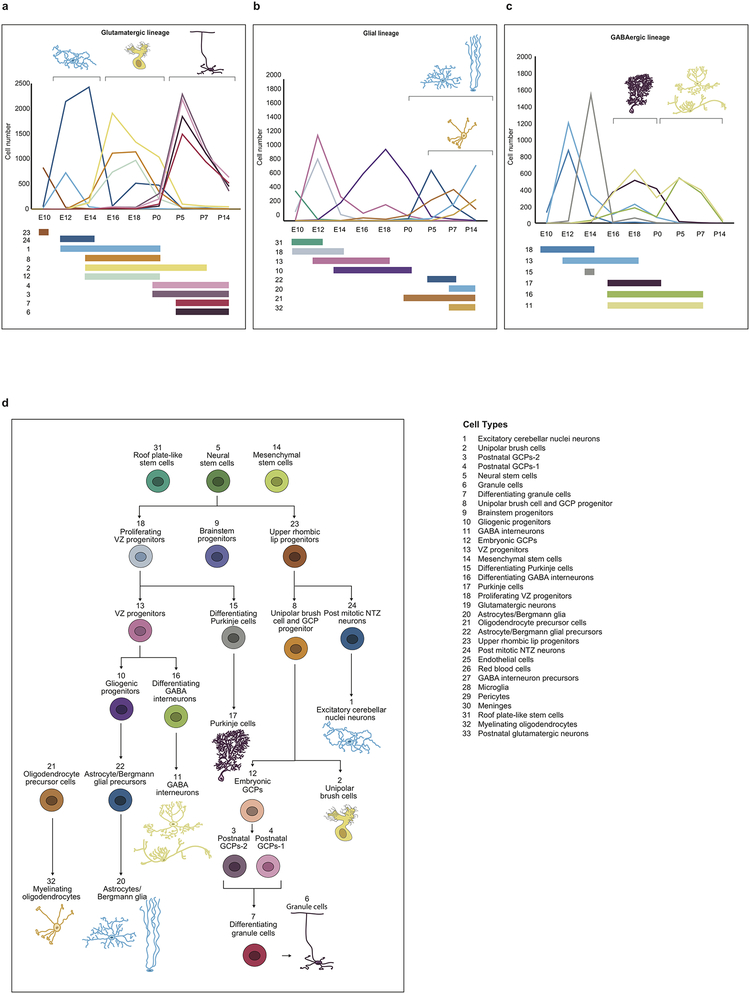
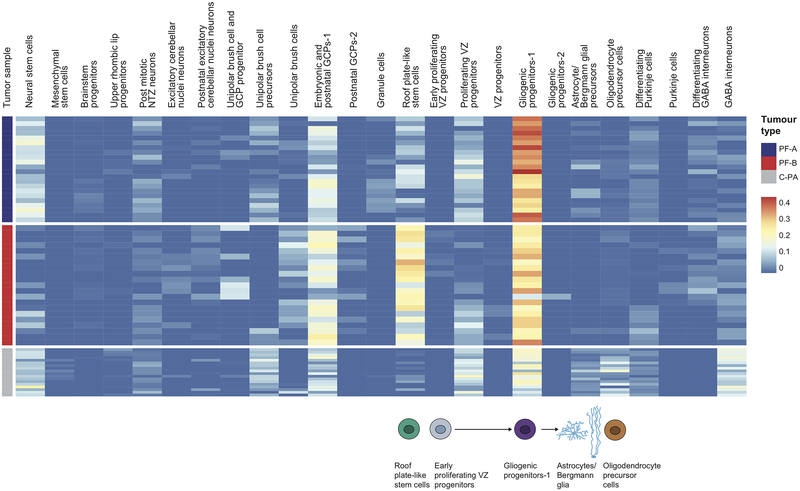
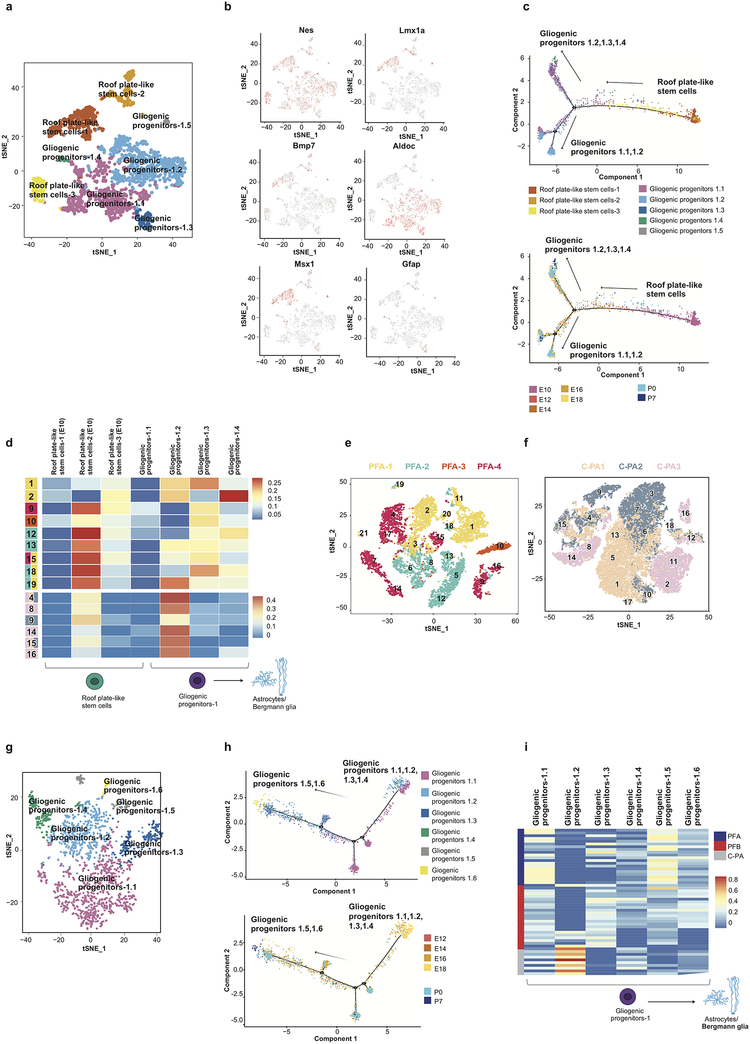
Using a carefully curated list of mouse/human orthologs and an algorithm to deconvolute complex RNA mixtures against a series of single cell type transcriptional profiles, we compared the transcriptomes of bulk human ependymomas (PFA and PFB, 43 tumors) as well as cerebellar pilocytic astrocytomas (C-PA, 10 tumors) to distinct developmental clusters. PFA, PFB, and C-PA are all transcriptionally most similar to the gliogenic progenitors-1 cell cluster (Extended Figure-5), with some similarity to the proliferating VZ progenitors, and to a novel cluster of ‘roof plate-like’ stem cells which has transcriptional similarity to the developing roof plate (Lmx1a, Msx1, Bmp7)33,34. The gliogenic progenitor cluster is observed initially at E12, peaks at E18, and has largely disappeared by P5 (Extended Figure-4). The ‘roof plate-like’ stem cells are seen much earlier, appearing only between E10 and E12 (Extended Figure-4). This is consistent with PFA, PFB, and C-PA being classified as ‘gliomas’, and prior publications that suggest that PFA arises from the regional radial glia19.
Posterior fossa ependymomas and C-PAs are both histologically and clinically distinct from each other. Re-clustering of the gliogenic progenitors, early VZ radial glia, and roof plate-stem cells identifies eight distinct transcriptional clusters within this lineage (Extended Figure-7). Both PFA and PFB remain transcriptionally best matched to the same developmental population (Extended Figure-7i). However, C-PA now transcriptionally match to a very distinct sub-cluster of the cerebellar gliogenic progenitor cell cluster, supporting a model in which posterior fossa ependymomas and C-PAs have distinct cells of origin (Extended Figure-7i).
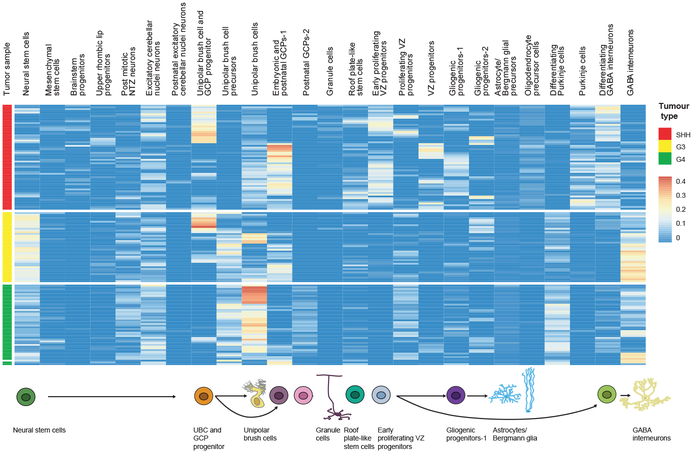
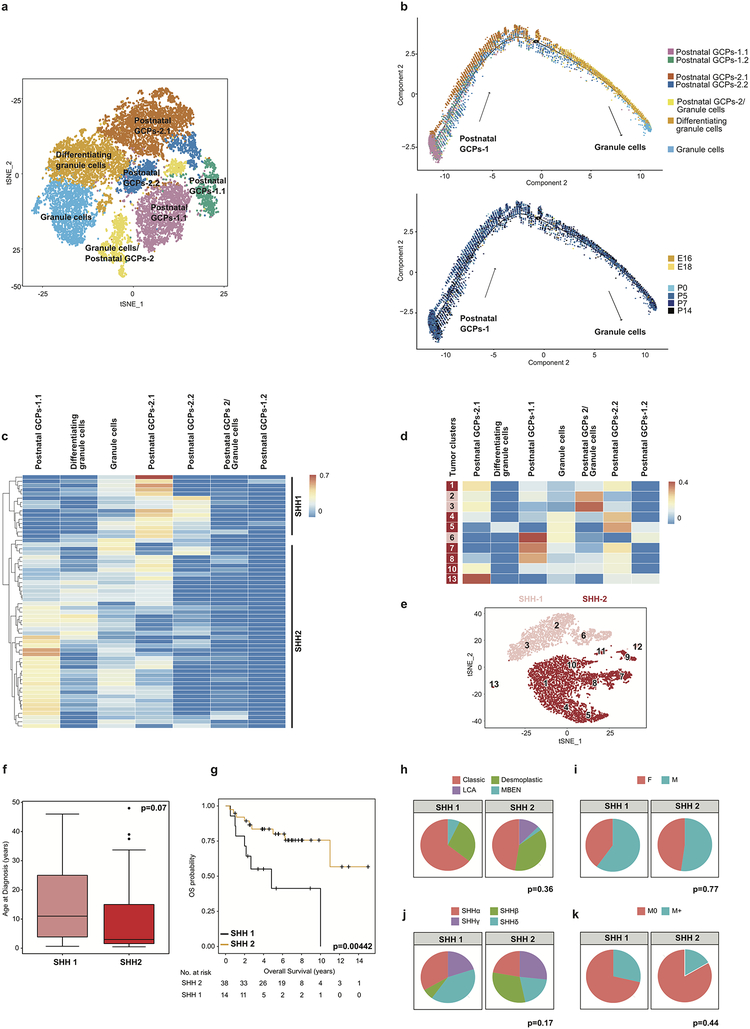
Deconvoluting bulk RNA-seq transcriptomes from human medulloblastomas (Shh, Grp3-MB, and Grp4-MB, total 145 tumors) against transcriptionally defined cerebellar clusters (Figure-3) demonstrated that Shh-MB is most similar to GCP clusters, as supported by prior publications6,7. Re-clustering of cells in the GCP lineage revealed additional heterogeneity, with the identification of seven distinct clusters (Extended Figure-8). Comparison of bulk human Shh-MB transcriptomes to these seven GCP cell lineage clusters revealed heterogeneity within Shh-MB (Extended Figure-8c). Shh MBs that transcriptionally resemble later time points in cerebellar development (SHH1 - similar to the Post-natal GCPs 2.1) have a worse prognosis than those that resemble the earlier arising GCPs (SHH2- similar to the Post-natal GCPs 1.1 (Extended Figure-8g) (p=0.00442). Furthermore, Shh-β subtype medulloblastomas are more similar to the earlier “SHH2” subset, demonstrating the similarity of this subtype to differentiation states in earlier GCP development (Extended Figure-8j).
Figure 3. Deconvolution analyses of bulk human medulloblastoma tumor transcriptomes.
Hierarchical clustering of patient samples of known molecular subgroups based on calculated relative abundance values of the mouse cell-type clusters in each sample, obtained from CIBERSORT. Expression signatures from 26 mouse cell clusters were selected to deconvolute bulk RNA-seq of human cerebellar tumors including: Shh, Group 3 and Group 4 MBs (n=145).
The cell of origin for Grp3-MB is not yet definitively known, but has been suggested to be a Nestin+ve cerebellar stem cell10. Comparison of Grp3-MB to developmental cerebellar cell clusters revealed a broad resemblance across Grp3-MB to Nestin+ve cerebellar early stem cells (Figure-3). Interestingly, subsets of bulk Grp3-MB transcriptomes also resemble developmental cell clusters in the GCP and UBC lineages, as well as similarity to cerebellar GABAergic interneurons (Figure-3). This multi-lineage differentiation is consistent with a model in which Grp3-MBs contain Nestin+ve early neural stem-like cells that give rise to a variety of differentiated progeny; however this possibility cannot be evaluated properly using bulk RNA-seq data.
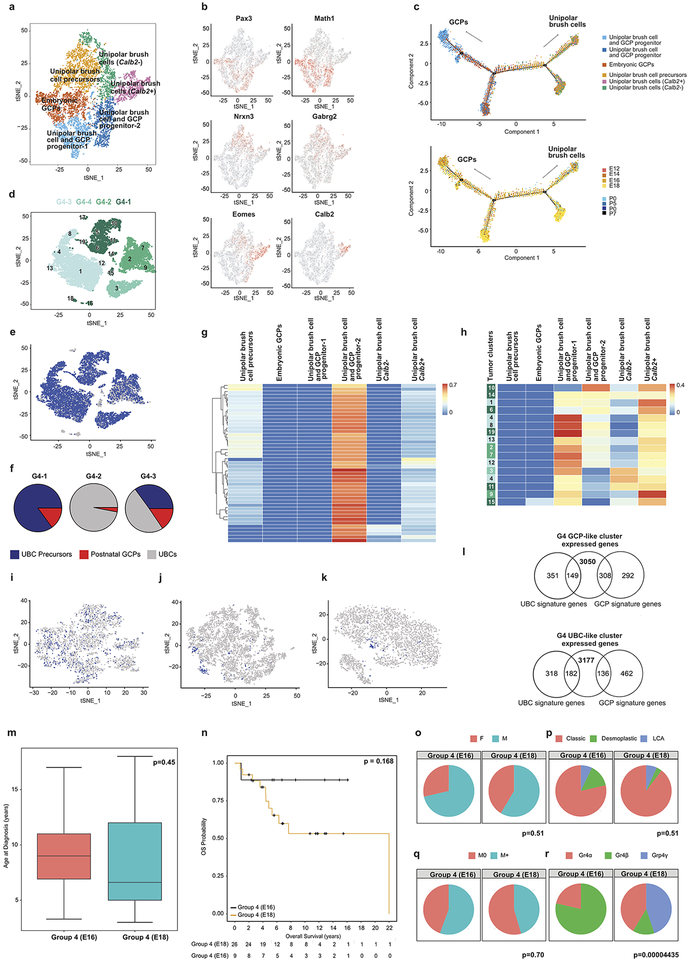
Mouse models of Grp4-MB are not available, and the cell of origin for Grp4-MB MB is unknown. Unexpectedly, Grp4-MB transcriptionally best matched to cells of the UBC lineage (Figure-3). UBCs are glutamatergic interneurons that derive from the URL, which have not been studied as deeply as other types of cerebellar neurons33. The cluster that best matched Grp4-MB MB (cluster #8) (Extended Figure-1) is first observed at E14, peaks in prevalence at E18, and has largely disappeared by P0 (Extended Figure-4). Re-clustering of cells in the UBC lineage followed by comparison to the transcriptomes of bulk human Grp4-MB affirms that in all cases, the bulk Grp4-MB MB transcriptome is most similar to the UBC progenitor cell cluster (Extended Figure-9g). These data are consistent with a model in which Grp4-MB arises from a cell in the UBC lineage.
Temporal mirroring of specific embryonic cell clusters.
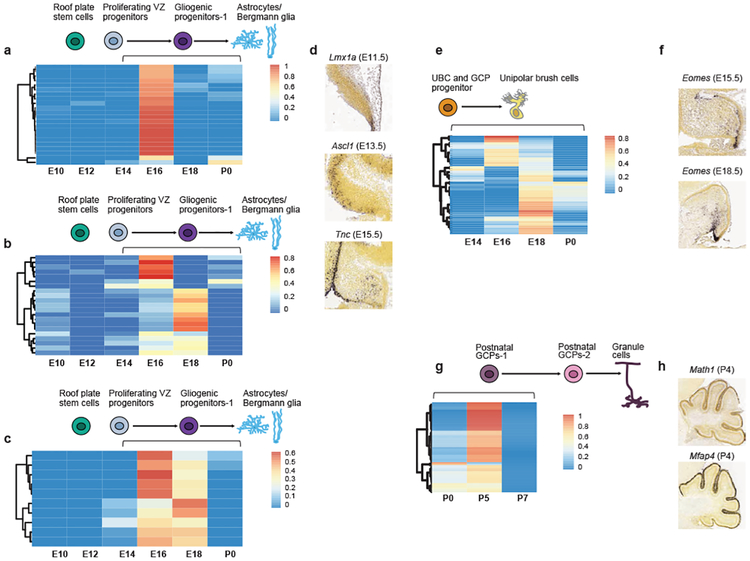
Different childhood tumors transcriptionally mirror specific clusters in defined cerebellar lineages. Many of these lineages are only detected over a defined period of development, while others persist into adulthood (Extended Figure-4). We compared human tumor transcriptomes to their best-matched developmental cluster as a function of time. Comparison of bulk PFA and PFB transcriptomes to murine single cells in the gliogenic progenitor cell lineage from E10 to P0 revealed a specific match to the E16 gliogenic progenitors (Figure-4a,b). Similarly, C-PAs revealed a very strong match at both E16 and E18 (Figure-4c). The gliogenic progenitor cells form a discrete cluster from E14 to P0 (Figure-4d), bracketing the period of highest transcriptional resemblance. Comparison of the bulk transcriptomes of human Grp4-MB to murine cells in the UBC lineage revealed that some Grp4-MBs are transcriptionally most similar to E16, while others are more similar to E18 (Figure-4e). The UBC lineage is well defined and detected from E14 to P0 (Figure-4f). Comparison of Grp4-MBs that more closely mirror E16 to those that mirror E18 demonstrates that Grp4-β is largely restricted to E16 similar tumors, while Grp4-γ is completely restricted to E18 similar tumors (Extended Figure-9r, P=0.00004)1. These data suggest that differences between Grp4-β and Grp4-γ could be secondary to their arising at different time points in the UBC lineage1.
Figure 4. Temporal transcriptional matching of normal cerebellar cell clusters with bulk human tumors.
Deconvolution analysis of PFA (n=22) (a), PFB (n=21) (b), C-PA (n=10) (c) patient samples against different developmental time points of the gliogenic progenitor cell cluster. In situ hybridization staining of medial sagittal slices of marker genes Lmx1a, Ascl1, and Tnc during mouse cerebellar development (d). Deconvolution analysis of 45 Group 4 MB patient samples against different developmental stages of the UBC cluster (e). In situ hybridization staining of medial sagittal slice of marker genes Eomes during mouse cerebellar development (E15.5 and E18.5) (f). Deconvolution analysis of Shh MB (n=60) patient samples against P0, P5, and P7 developmental stages of the post-natal GCP-1 cell cluster (g). Expression of the post-natal GCP-1 cell cluster marker Math1 and Mfap4 in the developing P4 mouse cerebellum (h). All in situ hybridization data were obtained from Allen Brain Map: Developing Mouse Brain Atlas (http://developingmouse.brain-map.org).
We did not attempt to temporally position Grp3-MBs using bulk transcriptomics, as Grp3-MB often transcriptionally match more than one cluster in the developing cerebellum. While PFA, PFB, C-PA, and Grp4-MB are all transcriptionally best matched to cell clusters present during fetal development, Shh-MBs are best matched to the GCP lineage in the early postnatal period at P5 (Figure-4g,h)6. We conclude that in addition to transcriptional mirroring of specific cell populations in the developing cerebellum, human cerebellar tumor transcriptomes are most similar to specific time points during development, predominantly during fetal life.
Single-cell heterogeneity in cerebellar tumors.
Medulloblastomas exhibit well-characterized intertumoral heterogeneity, as well as geographic, spatial (metastases) and temporal (at recurrence) heterogeneity1,2,24,35–39. Cerebellar ependymomas also show marked intertumoral heterogeneity15–19,26, while the intertumoral heterogeneity amongst C-PAs is not well characterized25. We undertook scRNA-seq of human cerebellar tumors including medulloblastoma (8 patients), PFA ependymoma (4 patients) and C-PA (3 patients). Analysis of clusters from scRNA-seq of human tumors revealed both tumor cell clusters, and non-tumor cell clusters (i.e., endothelium, monocytes/microglia, lymphocytes) (Extended Figure-6, Supplementary Table 4). In keeping with our goal to compare tumor cells to cell populations in the developing cerebellum, non-tumor cell clusters were removed from current consideration.
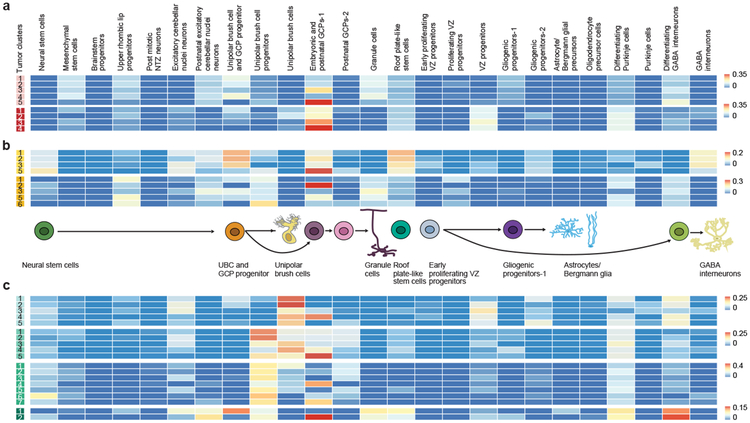
Shh MB scRNA-seq clusters remain most similar to cells in the GCP lineage (Figure-5a). Some Shh sc-RNA-seq clusters are most similar to the UBC and GCP progenitor cell cluster. Comparison to the seven re-clustered clusters in the GCP lineage revealed that Shh-MBs contain cells transcriptionally similar to various different stages of GCP development (Extended Figure-8c). These results are consistent with a model in which Shh-MBs contain a variety of tumor cell types representing different stages of GCP differentiation, and which might exhibit distinct clinical behaviours and therapeutic responses13.
Figure 5. Cell-type deconvolution analysis of tumor-cell specific clusters from human medulloblastoma scRNA-seq.
Clustering analysis and t-SNE visualization of scRNA-seq data of Shh MB (n=2) (a), Group 3 MB (n=2) (b), and Group 4 MB (n=4) (c) patient samples. Each patient’s sample is shown as a different color. Each individual tumor cell cluster was subjected to a deconvolution analysis against 26 previously identified mouse cell populations using CIBERSORT, with each individual tumor cluster identified in the far left hand column of each heatmap.
Identification and transcriptional mapping of individual tumor cell clusters from Grp3-MB reveal highly divergent lines of differentiation with tumor clusters similar to multiple normal developmental clusters in the GCP, UBC, Purkinje cell, and GABAergic interneuron lineages. This pattern is consistent with an origin from a very early, uncommitted cerebellar stem cell, followed by partial differentiation of transformed cells along diverse developmental lineages (Figure-5b).
scRNA-seq of human Grp4-MBs reveals discrete clusters that transcriptionally mirror the differentiated UBCs, as well as the UBC progenitors (Figure-5c, Extended Figure-9). Unexpectedly, we also observed tumor cell clusters from each human Grp4-MB that transcriptionally are most similar to the GCP lineage (Figure-5c). Comparison of Grp4-MB single cell tumor cluster transcriptomes to both the GCP and UBC lineages, revealed that ‘GCP similar’ clusters are in fact transcriptionally more similar to the GCP lineage than the UBC lineage (Supplementary Table 8- tab 5). Conversely, UBC similar clusters are more similar to the UBC lineage (Supplementary Table 8- tab 4). Individual Grp4-MBs contain highly variable percentages of differentiated versus less differentiated cells (Extended Figure-9f). Comparison of the Grp4-MB scRNA-seq data reveals that ‘UBC-like’ cells in Grp4-MB transcriptionally mirror several time points in UBC development (Extended Figure-9h). Two distinct types of UBCs have been described in the mammalian cerebellum40. Consistent with this, re-clustering of murine cerebellar cells in the UBC lineage revealed two distinct types of UBCs (Extended Figure-9c). Grp4 MB is predominantly similar to only one of these subtypes (CR+ve UBCs – Extended Figure-9h). Individual cells from the UBC/GCP progenitor cluster simultaneously express both GCP and UBC marker genes, which is not observed in cells committed to a GCP or a UBC fate (Extended Figure-10), but is observed in Grp4-MB cells. These data are consistent with a model in which Grp4-MB arises from a bipotential progenitor cell population (likely in cluster #8) that is capable of giving rise to cells in both the GCP, and the UBC lineages. Cumulatively, across the medulloblastoma subgroups our scRNA-seq data demonstrates high levels of single cell heterogeneity, with evidence of multiple lines of differentiation, and cells at different time-points in the differentiation hierarchy.
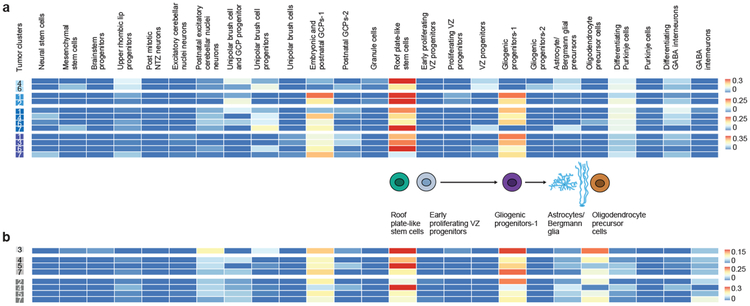
Single cell RNA-seq of PFA ependymomas revealed single cell heterogeneity, with each tumor containing clusters that best matched sub-clusters of the gliogenic progenitor cell population or roof plate-like stem cells (Figure-6a, Extended Figure-7). Of note, we did not observe clusters of more differentiated cell types such as Bergmann glia or astrocytes within the PFA ependymomas, but only observed less differentiated cell types. This lack of differentiated cell types within the tumor is unique to PFA among the childhood cerebellar tumors examined in this study. Some single cell transcriptional clusters of human PFA tumors are more similar to single cell clusters from another patient’s tumor than they are to other clusters from within the same individual (Extended Figure-7d). C-PA scRNA-seq also demonstrated clusters with transcriptional similarity to the relatively undifferentiated roof plate-like stem cell cluster and the gliogenic progenitors (Figure-6b). Unlike PFA ependymoma, some C-PA tumor cell clusters demonstrate similarity to more differentiated cell types, such as astrocytes, Bergmann glia, and oligodendrocytes (Figure-6b).
Figure 6. Cell-type deconvolution analysis of tumor-cell specific clusters from human PFA and cerebellar pilocytic astrocytoma scRNA-seq.
Clustering analysis and t-SNE visualization of scRNA-seq of PFA (n=4) (a) and C-PA (n=3) (b) human samples. Each patient’s sample is shown as a different color. Each individual tumor cell cluster was subjected to a deconvolution analysis against 26 previously identified mouse cell populations using CIBERSORT, with each individual tumor cluster identified in the far left hand column of each heatmap.
Discussion
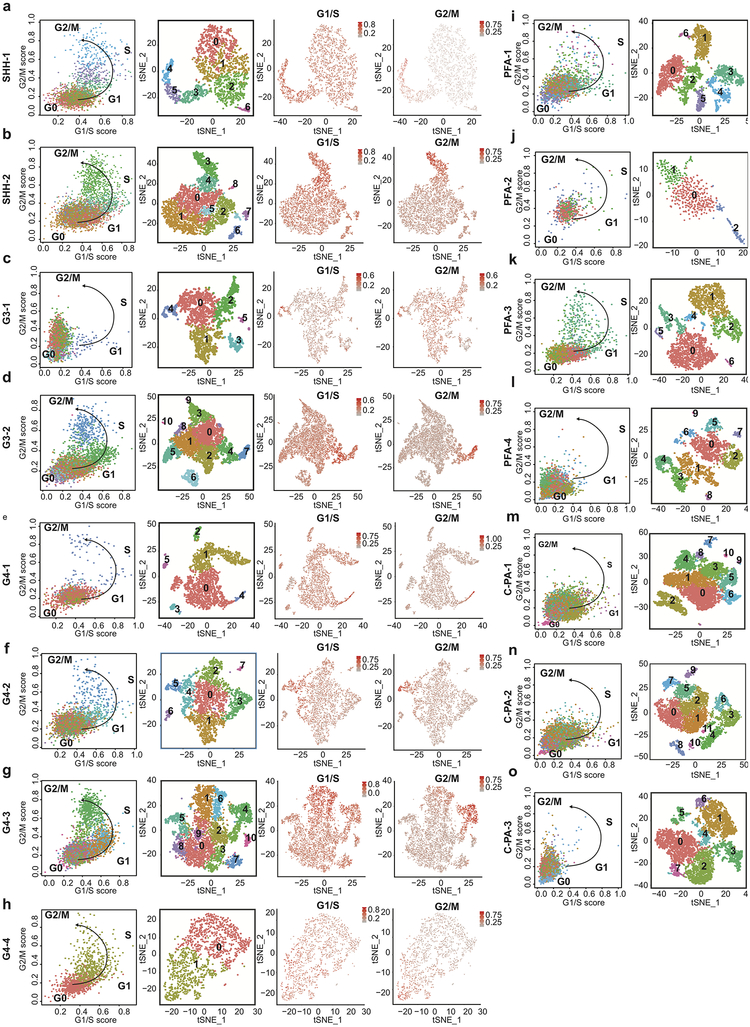
Cumulatively, across the medulloblastoma subgroups (Shh, Grp3-MB, and Group 4), as well as PFA ependymoma and C-PA, our scRNA-seq data demonstrated high levels of single cell heterogeneity, with evidence of multiple lineages of differentiation, and tumor cells matching different time-points in the differentiation hierarchy. Childhood cerebellar tumor transcriptomes demonstrate high levels of similarity to discrete cell populations within the developing cerebellum, supporting a model in which discrete cells of origin have a profound influence on the transcriptome and biology of the observed mature tumors. While the use of cell cycle genes is essential in defining developmental stages of cell populations in the cerebellum (i.e., progenitor cell versus differentiated cell), we excluded cell cycle genes when comparing human tumor cells to murine developmental clusters to avoid spurious comparisons based largely on cell cycle phenotypes (Supplementary Table 3); however cell cycle content and genomic alterations were quantified independently in the human single cell data sets (Extended Figure-10, Supplementary Table 7). The relative biological significance of well separated clusters in the t-SNE plots, versus those that are spread out and partially overlapping is uncertain, and a well-known issue in single cell sequence analysis that will require future exploration.
Many of the normal murine cerebellar cell populations, which are transcriptionally most similar to human cerebellar tumors are only present for a restricted time period during fetal development, or are found only in the very early postnatal period. It is certainly possible that each of the cerebellar tumor types discussed above arises in a particular cell type indicated by the cluster and developmental time point identified by transcriptional matching. However extensive cell lineage tracing using in vivo models of these diseases will be necessary to exclude the possibility that tumors arise in other cell lineages and undergo trans-differentiation during transformation, or arise in cerebellar cells at later time points and then undergo dedifferentiation.
Our data does not reveal substantial populations of differentiated cells within PFA ependymomas, differentiated glia within the medulloblastomas, nor differentiated neuronal cell types in the C-PAs. Distinguishing infiltrating normal cells within pediatric cerebellar tumors is difficult as these tumor types contain very few somatic genetic events that would allow us to discern transformed from non-transformed cells. The normal, non-transformed cell populations that best transcriptionally match cerebellar tumors are only present in utero, or immediately postnatally, and are therefore not present in the brains of children at the time of presentation, and likely could not contaminate their tumors. However, we cannot exclude the possibility that some of our single cell tumor clusters also contain small populations of infiltrating non-transformed differentiated cells.
The ability of these different progenitor cell populations restricted to specific time points to give rise to different types of cerebellar tumors should ideally be tested functionally in vivo, as previously demonstrated8,12,18–19. While there would be great value in comparing human cerebellar tumors to single cell transcriptomes from normal human cerebellar cells from various time points in development, these types of samples are not readily available. The presence of multiple lineages and stages of differentiation within bulk medulloblastoma samples illustrates the difficulty of using the bulk tumor population as a tool to decipher tumor biology, or to develop tumor diagnostics. The absence of differentiated cell types in PFA ependymoma, but not other tumor types, suggests the presence of a differentiation block in PFA ependymomas. Due to space limitations, the current manuscript has focused on the relationship of posterior fossa tumors to cell types in the developing cerebellum. The current single cell RNA-seq datasets from posterior fossa tumors should allow further analyses and insights into both tumor cell autonomous, and infiltrating non-tumor cell biology from these entities. A more complete understanding of the biology and transcriptomes of the specific cerebellar hierarchies identified above, and their developmental timing may allow a better comprehension of cerebellar tumor biology, and promote the subsequent development of novel mouse models, improved tumor diagnostics, and eventually the development of novel rational therapeutics based on the differences between tumor cells and their normal cells of origin.
Methods
Patient recruitment.
Participants recruitment was in compliance with Hospital for Sick Children and McGill University Health Centre ethical regulations. Sample size of participants was determined based on consent availability and diagnosis. Available patient characteristic information is described in Supplementary Table 2. All tumor patient sample collection and experiments were approved by McGill University Health Centre (Montreal) and by The Arthur and Sonia Labatt Brain Tumour Research/Hospital for Sick Children (Toronto).
Animal experiments.
All mouse breeding and procedures were approved by The Centre for Phenogenomics (Toronto). Mated C57BL/6J female mice were dissected in order to collect embryos from the following gestational time points: 10, 12, 14, 16 and 18. C57BL/6J pups were dissected to collect tissue from the following postnatal time points: 0, 5, 7 and 14.
Tissue handling and dissociation.
Fresh tumor tissue was collected at the time of resection. The tumor tissue was mechanically and enzymatically dissociated using a collagenase-based dissociation method as previously reported41. Early embryonic hindbrain structures were dissected from the gestational time points E10 and E12. An incision was made between the midbrain and hindbrain boundary, as well as between the prepontine hindbrain and pontine hindbrain, in order to isolate the isthmus, and rhombomeres −1 and −2 at these early time points in development. Late embryonic cerebellar primordia were collected at embryonic time points 14, 16 and 18. All embryonic mouse dissections were performed under a Leica stereoscope with a pair of Moria ultra fine forceps (Fine Science Tools). The tissue was transferred into ice cold Leibovitz’s medium, followed by single cell dissociation with the Papain Dissociation System (Worthington Biochemical Corporation). Postnatal cerebella were dissected from the following time points: day 0, 5, 7 and 14. The central nervous system was fully dissected, then embedded in 2% Low melting point agarose. One mid sagittal slice of 300 um was generated using the Leica vibratome42. Under the stereoscope the cerebellum was isolated from the slice, followed by immediate single cell dissociation as described above.
RT, amplification and sequencing.
The concentration of the single cell suspension was assessed with a Trypan blue count. Approximately 10,000–14,000 cells per time point were loaded on the Chromium Controller and generated single cell GEMs. GEM-RT, DynaBeads cleanup, PCR amplification and SPRIselect beads cleanup were performed using Chromium Single Cell 3’ Gel Bead kit. Indexed single cell libraries were generated using the Chromium Single Cell 3’ Library kit and the Chromium i7 Multiplex kit. Size, quality, concentration and purity of the cDNAs and the corresponding 10× library was evaluated by the Agilent 2100 Bioanalyzer system. The 10× libraries were sequenced in the Illumina 2500 sequencing platform.
Alignment of raw reads.
Through 10× CellRanger’s pipeline43, the raw base call (BCL) files were demultiplexed into FASTQ files. The FASTQ files were aligned to the reference mouse genome GRCm38 (mm10) to generate raw gene-barcode count matrices. When clustering of multiple samples, we aggregated the multiple runs together to normalize on sequencing depth, and re-computed the gene-barcode matrices. Alignment quality control metrics are found in Supplementary Table 1- tab 1.
QC and normalization.
Low-quality cells were identified and removed from the datasets. We considered low-quality cells as cells with <200–300 genes expressed, and cells with high mitochondrial gene content (4 S.D.s above median). We predicted doublets to be cells with relatively high library sizes (4–5 S.D.s above median), and removed them from the analysis. Low-abundance genes were also removed from the datasets (genes expressed in less than 3 cells). The human single cell datasets were normalized using methods adapted from Scran’s pipeline44. Size factors were computed, and were applied to normalize gene expression across the cells, to produce normalized log-expression values to each dataset individually. Mouse single cell datasets were processed using CellRanger aggregation in order to account for sequencing depth variation, followed by QC and normalization as described above.
Clustering analysis and visualization.
Clustering analysis was performed with both the presence (Figure-1) and absence (Extended Figure-1) of cell cycle related genes obtained from Ensembl’s biomart49. When implemented, cell cycle genes removal was done prior to highly variable genes (HGVs) detection. HGVs were detected using Seurat’s pipeline45,46, calculating average expression and dispersion for each gene, diving genes into bins, and computing a z-score for dispersion within each bin. We used a z-score of 0.5 as the cutoff of dispersion, and a bottom cutoff of 0.0125 and a high cutoff of 3.0 for average expression. Linear dimensionality reduction was performed using principal component analysis (PCA), and statistically significant principal components were selected using the elbow and jackstraw methods from Seurat. The clusters of cells were identified by a shared nearest neighbor (SNN) modularity optimization based clustering algorithm from Seurat. We then visualized these clusters using t-SNE, t-distributed stochastic neighbor embedding.
Pseudo-time trajectory analysis.
The barcodes of selected clusters were normalized using Monocle’s dPFeature to remove lowly expressed genes and perform PCA analysis on the remaining genes, for significant PC selection47. Cells are then grouped using ‘density peak’ clustering algorithm. Differential gene expression analysis was performed using a generalized linear model (GLM), and the top 1000 genes per cluster were selected. Reverse graph embedding (RGE) was then used to reduce the high-dimensionality data into lower dimensional space and build the trajectory48. The structure of the trajectory was plotted into two dimensional space using the DRTree dimensionality reduction algorithm and order the cells in pseudo-time.
Creation of cell-type-specific signatures.
For each cluster identified, the average expression of each gene was calculated. Differential gene expression was performed using Seurat’s likelihood ratio test (LRT) method, and we filtered out genes expressed in less than 25% of the cells. The top differentially expressed genes were used as markers to build a signature gene expression matrix. Genes involved in cell proliferation and ribosome biogenesis were obtained from Ensembl’s biomart49, and omitted from the matrix. Human orthologues of mouse genes were identified, and used to create the final matrix. Complete gene signatures and inputs can be found in Supplementary Table 5 and 6.
Deconvolution analysis.
CIBERSORT was used to perform the deconvolution analysis of the bulk and single-cell RNA-seq tumor data against the mouse clusters50. The full transcriptomes of the tumor data were used as the input mixture, and the signature gene input was the mouse cluster expression matrix after removal of all genes that can introduce bias in the deconvolution process including 1400 cell cycle genes, 300 genes associated with ribosome biogenesis, and ~100 mitochondrial and apoptosis-related genes. Quantile normalization was disabled and 100–500 permutations were run. To test CIBERSORT on our datasets, we created synthetic bulk mixtures from the mouse clusters, and we selected known amount of reads from various clusters. CIBERSORT roughly yielded the expected relative abundances. In order to generate reliable input expression profiles, tumor clusters with very low number of cells were discarded from the analysis. To validate our mouse cluster signatures, we obtained human and mouse data of brain cell types from published datasets (Saunders et al. 2018, and Zhang et al. 2016) (Supplementary Table 1- tab 2), and deconvoluted them against our mouse signatures in order to ensure that our expected abundances had similar values to our cell of origin matches.
Bulk RNA-seq human tumor samples.
60 Shh, 40 Group 3, and 45 Group 4 human medulloblastoma bulk RNA-seq samples were obtained from MAGIC, Medulloblastoma Advanced Genomics International Consortium. The raw data was aligned to the reference human genome GRChg38 using STAR to generate raw counts51. FPKMs were then obtained from DESeq252. We performed bulk RNA-sequencing on 22 PFA, 4 PFB, and 10 C-PA patient samples, and obtained FPKMs using the same strategy. Microarray expression data was obtained from 17 PFB samples.
Relative gene expression panels.
Relative expression of genes within selected clusters was measured by calculating the average of the gene count from the log normalized matrix in each cluster. The averages of specific genes were then scaled between the values of −1.0 – 1.0 among the selected clusters in order to reflect higher versus lower expression levels.
Cell cycle analysis of human scRNA-seq tumor samples.
Cell cycle phase specific annotations were acquired from Whitfield et al. 2002 and used to quantify the percentage of phase specific cell cycle genes in each individual cell. The percentages was then normalized from a scale 0–1, after which the ratio between G1/S and G2/M was calculated. Cells with a low ratio values for the G2/M and G1/S ratios were labelled to be in G0 phase, whereas cells with increasing values for G1/S but low ratio values were labelled as cells progressing into G1 phase. Cell with high ratio values for G2/M were labelled to be progressing into S, G2 and M phase respectively.
Data availability statement.
The datasets generated and analysed during the current study are available in the following repositories: BAMs and filtered gene matrices of mouse developmental time points scRNA-seq (GSE118068), FASTQs of PFB bulk RNA-seq and microarray expression (EGAS00001002696, GSE64415), BAMs of human tumor scRNA-seq and either BAMs or FASTQs of bulk PFA/C-PA RNA-seq (EGAS00001003170) and FASTQs of MB bulk RNA-seq (EGAD00001004435).
Code availability statement.
The following packages were used for the data analysis: Cell Ranger v1.2.1, R v3.4.4, Seurat v1.4.0, v2.3.0 and v2.3.4, Monocle v2.6.3, CIBERSORT (absolute mode beta).
Extended Data
Extended Figure 1. Characterization of cell types in the mouse developing cerebellum.
t-SNE visualization demonstrating 34 unique clusters of 62,040 single cells (a). Bar chart displaying the number of cells collected during each developmental time point (n=9) (b). Bar plot displaying the number of cells within each identified cluster belonging to specific developmental time points (c). Circles showing the normalized average expression as indicated by the scale at the bottom right of established developmental lineage marker genes (n=24) specific to each cell cluster (d).
Extended Figure 2. Clustering analysis of scRNA-seq data of mouse developing cerebellum of 7 time points used for generating CIBERSORT expression signature.
Seurat’s t-SNE visualization of transcriptionally distinct cell populations from 44,461 single cells from seven developmental time points annotated by cluster identity (n=31) (a) and by time point (n=7) (b).
Extended Figure 3. Re-construction of cerebellar developmental lineages through pseudo-temporal ordering of cells.
t-SNE visualization and two-dimensional embedding showing constructed pseudo-time trajectories of different lineages in the developing cerebellum: Early germinal zones (n= 6,096 cells) (a), GABA Interneurons lineage (n= 13,432 cells) (b), Purkinje cells (n=6,048 cells) (c), Granule cells (n=15,011 cells) (d) and Oligodendrocytes (n= 1, 433 cells) (e). Cells within specific lineage clusters were selected, visualized using Seurat’s t-SNE visualization and then ordered based on Monocle 2’s reverse-graph embedding (RGE) method. Heatmaps demonstrate gene normalized expression levels of cluster-specific markers, red being highest and blue being lowest.
Extended Figure 4. Diagram of developing cerebellar lineages showing relative abundance of cell type clusters across time.
Line plot showing the number of cells of each glutamatergic lineage cluster at each collected time point (a). Line plot showing the number of glial population clusters at each collected time point (b). Line plot showing the number of GABAergic cells at each collected time point (c). Cartoon of individual cell clusters identified through unsupervised hierarchical clustering of single cell transcriptomes from the developing mouse cerebellum (d). Cell clusters were arranged in their respective developmental hierarchies based on the expression of known marker genes as well as the results of pseudo-time analyses. Cluster annotations are found on the bottom right.
Extended Figure 5. Deconvolution analyses of bulk human PFA, PFB ependymoma and cerebellar pilocytic astrocytoma tumor transcriptomes.
Hierarchical clustering of patient samples of known molecular subgroups based on calculated relative abundance values of the mouse cell-type clusters in each sample, obtained from CIBERSORT. Expression signatures from 26 mouse cell clusters were selected to deconvolute bulk RNA-seq of human PFA (n=22) and PFB (n=25) ependymomas, and C-PAs (n=10).
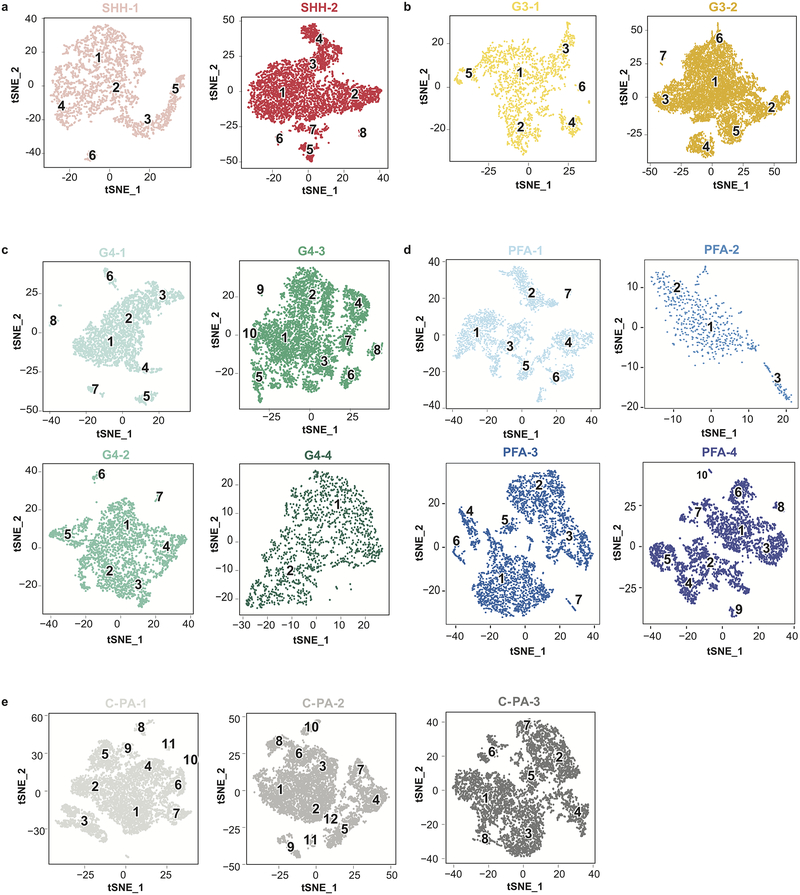
Extended Figure 6. Clustering analysis and t-SNE visualization of human scRNA-seq data.
t-SNE visualization of scRNA-seq data used as input for the CIBERSORT deconvolution analysis of Shh MB (n=2) (a), Group 3 MB (n=2) (b), and Group 4 MB (n=4) (c), PFA (n=4) (d) and C-PA (n=3) (e) patient samples. Cluster annotations were established by expression of known marker genes unique to tumor and cell type and are defined as follows: SHH-1 Tumor clusters: 1,2,3,4,5 (cell cycle cluster: 5); Monocyte/Microglia: 6. SHH-2 Tumor clusters: 1,2,3,4,7 (cell cycle cluster: 4); Monocyte/Microglia: 5,6; T-cells:8. G3–1 Tumor clusters:1,2,3,5,6; Monocyte/Microglia:4. G3–2 Tumor clusters: 1,2,3,5,6,7 (cell cycle cluster: 2); Monocyte/Microglia:4. G4–1 Tumor clusters: 1,2,3,4,5,6 (cell cycle cluster: 4); Microglia/Monocytes: 8; T-cells:7. G4–2 Tumor clusters:1,2,3,4,5,7 (cell cycle cluster: 5); Microglia/Monocytes:6. G4–3 Tumor clusters: 1,2,3,4,5,6,7,8,9 (cell cycle cluster: 4); Monocytes/Microglia:10. G4–4 Tumor clusters: 1,2. PFA-1 Tumor clusters: 4,6; Monocytes/Microglia: 1,3,5; T-cells:2; B-cells:7. PFA-2 Tumor clusters: 1,2; Monocytes/Microglia: 3. PFA-3 Tumor clusters: 1,4,6,7; Microglia/Monocytes:2,3,5. PFA-4 Tumor clusters: 1,3,6,7; Monocytes/Microglia:2,4,5; T-cells:9; Pericytes:8; Endothelial cells:10. C-PA-1 Tumor cluster: 3; Monocytes/Microglia: 1,2,4,5,6,7,9,10,11; T-cells: 8. C-PA-2 Tumor clusters: 4,5,7; Monocytes/Microglia:1,2,3,6,8,10,11,12; T-cells:9. C-PA-3 Tumor clusters:2,4,5,7; Monocytes/Microglia:1,3,8; T-cells:6.
Extended Figure 7. Re-clustering of the gliogenic progenitors and ‘roof plate like stem’ cells with comparison to PF ependymomas and C-PAs.
t-SNE visualization of the 8 sub-clusters obtained from combined re-clustering of ‘roof plate-like stem’ cells and gliogenic progenitor clusters (n= 2,525 cells) (a). Gene expression of gliogenic progenitor and ‘roof plate like stem’ cell marker genes onto t-SNE of sub-clusters (n= 2,525 cells) (b). Pseudo-time trajectory analysis of the 8 sub-clusters annotated by sub-cluster (above) and developmental time point (below) (n= 2,525 cells) (c). Deconvolution analysis heatmap of tumor cell single-cell PFA clusters (n = 9) (above) and tumor single-cell C-PA clusters (n = 6) (below) against expression signatures of the 8 murine developmental sub-clusters (d). t-SNE visualizations of clustered populations of PFA (n=4) (e) and C-PA (n=3) (f) scRNA-seq patient samples used for CIBERSORT’s deconvolution analysis. t-SNE visualization of the 6 sub-clusters obtained from re-clustering of only the gliogenic progenitor cluster (n= 1,709 cells) (g). Pseudo-time trajectory analysis of the gliogenic progenitor sub-clusters (n= 1,709 cells) annotated by sub-cluster (above) and developmental time point (below) (h). Deconvolution analysis heatmap of bulk PFA (n=22), PFB (n=25), and C-PA (n=10) patient samples against expression signatures of the 6 gliogenic progenitor sub-clusters (i).
Extended Figure 8. Re-clustering of the granule cell lineage with comparison to Shh medulloblastomas.
t-SNE visualization showing 7 distinct sub-clusters from re-clustering of the granule cell lineage (n=15,011 cells) (a). Pseudo-time trajectory analysis of the 7 granule cell sub-clusters annotated by sub-cluster (above) and developmental time point (below) (n= 15,011 cells) (b). Deconvolution analysis heat-map of bulk Shh MB (n=60) patient sample transcriptomes against expression signatures of the 7 granule cell sub-clusters (c). Deconvolution analysis heatmap of Shh MB scRNA-seq tumor specific clusters (n=10) against signatures of the 7 granule sub-clusters (d). t-SNE plot of clustered populations of Shh MB scRNA-seq samples (n=2) (e). Comparison of clinical characteristics based on clustering by similarity to different points in GCP lineage of SHH-1 (n=15) and SHH-2 (n=45) comparing age at diagnosis (f). Boxplot center lines show data media; box limits indicate 25th and 75th percentiles; lower and upper whiskers extend 1.5 times the interquartile range (IQR) from the 25th and 75th percentiles respectively; outliers are represented by individual points; p value (p=0.07) was determined by Wilcoxon test. Survival curve, corrected for metastatic dissemination and molecular subtype, of SHH-1 (n=15) and SHH-2 (n=45) identified through matching to a re-clustered granule cell lineage (g). p value (p=0.00442) was determined by log rank test and + indicates censored cases. Comparison of additional clinical characteristics including histology (h), sex (i), molecular subtype affiliation (j), and metastatic status (k) of SHH-1 (n=15) and SHH-2 (n=45) patient samples. p values were determined using Fisher exact test.
Extended Figure 9. Re-clustering of the unipolar brush cell lineage with comparison to Group 4 medulloblastomas.
t-SNE visualization of 6 distinct sub-clusters obtained from re-clustering of the unipolar brush cell (UBC) lineage (n= 9,605 cells) (a). Gene expression of unipolar brush cell lineage marker genes onto t-SNE of sub-clusters (n= 9,605 cells) (b). Pseudo-time trajectory analysis of the 6 sub-clusters, showing clear branching of the GCP and UBC lineage annotated by sub-clusters (above) and developmental time point (below) (n= 9,605 cells) (c). t-SNE visualization of the scRNA-seq clustered populations of Grp 4 MB human tumor samples (n=4) (d). t-SNE visualization of scRNA-seq clustering analysis of four Group 4 MB patient sample tumors colored by transcriptional match to both UBC and GCP gene expression signatures (9895 cells positive out of n= 12,129 cells) (e). Pie charts showing the percentage of cells at various states of differentiation in three G4 tumor samples based on their matches to UBC precursors, UBCs or postnatal GCPs (f). Deconvolution analysis heatmap of Group 4 MB (n=45) bulk patient sample transcriptomes against expression signatures of the 6 UBC sub-clusters (g). Deconvolution analysis heatmap of Group 4 MB scRNA-seq tumor cell clusters (n=15) against signatures of the 6 UBC sub-clusters (h). t-SNE visualization of re-clustered UBC and GCP progenitor cluster colored by the number of cells expressing UBCs transcriptional signature genes (573 cells positive out of n=2,866 cells) (i), the number of cells expressing GCP transcriptional signature genes (159 cells positive out of n= 4607 cells) (j), the number of cells expressing both UBC and GCP gene signatures (75 cells positive out of n=4607 cells) (k). Venn diagram showing Group 4 GCP-like clusters express 308/600 GCP signatures and 149/500 UBC signatures (n=3050 genes) (top) compared to Group 4 UBC-like clusters which express 136/600 GCP signatures and 182/500 UBC signatures (n=3177 genes) (bottom) (l). Comparison of clinical characteristics based on clustering by similarity to different points in UBC lineage of Group 4 E16 (n=17) and Group 4 E18 (n=28) comparing age at diagnosis (m). Boxplot center lines show data media; box limits indicate 25th and 75th percentiles; lower and upper whiskers extend 1.5 times the interquartile range (IQR) from the 25th and 75th percentiles respectively; outliers are represented by individual points; p value (p=0.45) was determined by Wilcoxon test. Survival curve, corrected for metastatic dissemination and molecular subtype, of Group 4 E16 (n=17) and Group 4 E18 (n=28) identified through matching to a re-clustered granule cell lineage (n). p value (p=0.168) was determined by log rank test and + indicates censored cases. Comparison of additional clinical characteristics including sex (o), histology (p), metastatic status (q), and molecular subtype affiliation (r) of Group 4 E16 (n=17) and Group 4 E18 (n=28) patient samples. p values were determined using Fisher exact test.
Extended Figure 10.
Cell cycle analysis of human scRNA-seq data. Dot plot showing the normalized ratio values of G1/S against G2/M ratios within each cell annotated by cluster identity (left) for Shh (n=2) (a-b), Group 3 MB (n=2) (c-d), Group 4 (n=4) (e-h) MBs and PFA (n=4) (i-l), C-PA (n=3) (m-o). Re-clustering t-SNE visualization of the single cell human tumors displaying cluster annotations (middle). Re-clustering t-SNE visualization with cell cycle phase ratios (G1/S, G2/M) projections (right).
Supplementary Material
Acknowledgements:
M.D.T. is supported by the NIH (R01CA148699 and R01CA159859), The Pediatric Brain Tumor Foundation, The Terry Fox Research Institute, The Canadian Institutes of Health Research, The Cure Search Foundation, b.r.a.i.n.child, Meagan’s Walk, SWIFTY foundation, Genome Canada, Genome BC, Genome Quebec, the Ontario Research Fund, Worldwide Cancer Research, V-Foundation for Cancer Research, and the Ontario Institute for Cancer Research through funding provided by the Government of Ontario. M.D.T. is also supported by a Canadian Cancer Society Research Institute Impact grant and by a Stand Up To Cancer (SU2C) St. Baldrick’s Pediatric Dream Team Translational Research Grant (SU2C-AACR-DT1113) and SU2C Canada Cancer Stem Cell Dream Team Research Funding (SU2C-AACR-DT-19–15) provided by the Government of Canada through Genome Canada and the Canadian Institutes of Health Research, with supplementary support from the Ontario Institute for Cancer Research through funding provided by the Government of Ontario. Stand Up To Cancer is a program of the Entertainment Industry Foundation administered by the American Association for Cancer Research. M.D.T. is also supported by the Garron Family Chair in Childhood Cancer Research at the Hospital for Sick Children and the University of Toronto. L.S. and I.E.H. were supported by funding provided by the Government of Ontario. M.C.V is supported by The Canadian Institutes of Health Research Doctoral scholarship. A.L.J. was supported by NIMH-R37MH085726, NCI-CA192176 and NINDS-R01NS092096 and a National Cancer Institute Cancer Center Support Grant [P30 CA008748–48]. This study was conducted with the support of the Ontario Institute for Cancer Research’s Genomics & Bioinformatics platform (genomics.oicr.on.ca) through funding provided by the Government of Ontario.
Footnotes
Competing interests: Authors declare no competing financial interests.
References
- 1.Cavalli FMG et al. Intertumoral Heterogeneity within Medulloblastoma Subgroups. Cancer Cell 31, 737–754 e736, doi: 10.1016/j.ccell.2017.05.005 (2017). [DOI] [PMC free article] [PubMed] [Google Scholar]
- 2.Northcott PA et al. Subgroup-specific structural variation across 1,000 medulloblastoma genomes. Nature 488, 49–56, doi: 10.1038/nature11327 (2012). [DOI] [PMC free article] [PubMed] [Google Scholar]
- 3.Dubuc AM, Mack S, Unterberger A, Northcott PA & Taylor MD The epigenetics of brain tumors. Methods in molecular biology 863, 139–153, doi: 10.1007/978-1-61779-612-8_8 (2012). [DOI] [PubMed] [Google Scholar]
- 4.Dubuc AM et al. Subgroup-specific alternative splicing in medulloblastoma. Acta neuropathologica 123, 485–499, doi: 10.1007/s00401-012-0959-7 (2012). [DOI] [PMC free article] [PubMed] [Google Scholar]
- 5.Northcott PA et al. Medulloblastoma comprises four distinct molecular variants. J Clin Oncol 29, 1408–1414, doi: 10.1200/JCO.2009.27.4324 (2011). [DOI] [PMC free article] [PubMed] [Google Scholar]
- 6.Wechsler-Reya RJ & Scott MP Control of neuronal precursor proliferation in the cerebellum by Sonic Hedgehog. Neuron 22, 103–114 (1999). [DOI] [PubMed] [Google Scholar]
- 7.Wallace VA Purkinje-cell-derived Sonic hedgehog regulates granule neuron precursor cell proliferation in the developing mouse cerebellum. Curr Biol 9, 445–448 (1999). [DOI] [PubMed] [Google Scholar]
- 8.Li P et al. A population of Nestin-expressing progenitors in the cerebellum exhibits increased tumorigenicity. Nat Neurosci 16, 1737–1744, doi: 10.1038/nn.3553 (2013). [DOI] [PMC free article] [PubMed] [Google Scholar]
- 9.Kawauchi D et al. A mouse model of the most aggressive subgroup of human medulloblastoma. Cancer Cell 21, 168–180, doi: 10.1016/j.ccr.2011.12.023 (2012). [DOI] [PMC free article] [PubMed] [Google Scholar]
- 10.Pei Y et al. An animal model of MYC-driven medulloblastoma. Cancer Cell 21, 155–167, doi: 10.1016/j.ccr.2011.12.021 (2012). [DOI] [PMC free article] [PubMed] [Google Scholar]
- 11.Swartling FJ et al. Pleiotropic role for MYCN in medulloblastoma. Genes Dev 24, 1059–1072, doi: 10.1101/gad.1907510 (2010). [DOI] [PMC free article] [PubMed] [Google Scholar]
- 12.Gibson P et al. Subtypes of medulloblastoma have distinct developmental origins. Nature 468, 1095–1099, doi: 10.1038/nature09587 (2010). [DOI] [PMC free article] [PubMed] [Google Scholar]
- 13.Vanner RJ et al. Quiescent sox2(+) cells drive hierarchical growth and relapse in sonic hedgehog subgroup medulloblastoma. Cancer Cell 26, 33–47, doi: 10.1016/j.ccr.2014.05.005 (2014). [DOI] [PMC free article] [PubMed] [Google Scholar]
- 14.Pajtler KW et al. The current consensus on the clinical management of intracranial ependymoma and its distinct molecular variants. Acta Neuropathol 133, 5–12, doi: 10.1007/s00401-016-1643-0 (2017). [DOI] [PMC free article] [PubMed] [Google Scholar]
- 15.Pajtler KW et al. Molecular Classification of Ependymal Tumors across All CNS Compartments, Histopathological Grades, and Age Groups. Cancer Cell 27, 728–743, doi: 10.1016/j.ccell.2015.04.002 (2015). [DOI] [PMC free article] [PubMed] [Google Scholar]
- 16.Witt H et al. Delineation of two clinically and molecularly distinct subgroups of posterior fossa ependymoma. Cancer Cell 20, 143–157, doi: 10.1016/j.ccr.2011.07.007 (2011). [DOI] [PMC free article] [PubMed] [Google Scholar]
- 17.Mack SC et al. Therapeutic targeting of ependymoma as informed by oncogenic enhancer profiling. Nature 553, 101–105, doi: 10.1038/nature25169 (2018). [DOI] [PMC free article] [PubMed] [Google Scholar]
- 18.Johnson RA et al. Cross-species genomics matches driver mutations and cell compartments to model ependymoma. Nature 466, 632–636, doi: 10.1038/nature09173 (2010). [DOI] [PMC free article] [PubMed] [Google Scholar]
- 19.Taylor MD et al. Radial glia cells are candidate stem cells of ependymoma. Cancer Cell 8, 323–335, doi: 10.1016/j.ccr.2005.09.001 (2005). [DOI] [PubMed] [Google Scholar]
- 20.Pomeroy SL et al. Prediction of central nervous system embryonal tumor outcome based on gene expression. Nature 415, 436–442, doi: 10.1038/415436a (2002). [DOI] [PubMed] [Google Scholar]
- 21.Capper D et al. DNA methylation-based classification of central nervous system tumors. Nature 555, 469–474, doi: 10.1038/nature26000 (2018). [DOI] [PMC free article] [PubMed] [Google Scholar]
- 22.Jones DT et al. Dissecting the genomic complexity underlying medulloblastoma. Nature 488, 100–105, doi: 10.1038/nature11284 (2012). [DOI] [PMC free article] [PubMed] [Google Scholar]
- 23.Pugh TJ et al. Medulloblastoma exome sequencing uncovers subtype-specific somatic mutations. Nature 488, 106–110, doi: 10.1038/nature11329 (2012). [DOI] [PMC free article] [PubMed] [Google Scholar]
- 24.Northcott PA et al. The whole-genome landscape of medulloblastoma subtypes. Nature 547, 311–317, doi: 10.1038/nature22973 (2017). [DOI] [PMC free article] [PubMed] [Google Scholar]
- 25.Jones DT et al. Recurrent somatic alterations of FGFR1 and NTRK2 in pilocytic astrocytoma. Nat Genet 45, 927–932, doi: 10.1038/ng.2682 (2013). [DOI] [PMC free article] [PubMed] [Google Scholar]
- 26.Mack SC et al. Epigenomic alterations define lethal CIMP-positive ependymomas of infancy. Nature 506, 445–450, doi: 10.1038/nature13108 (2014). [DOI] [PMC free article] [PubMed] [Google Scholar]
- 27.Goldowitz D & Hamre K The cells and molecules that make a cerebellum. Trends Neurosci 21, 375–382 (1998). [DOI] [PubMed] [Google Scholar]
- 28.Leto K et al. Consensus Paper: Cerebellar Development. Cerebellum 15, 789–828, doi: 10.1007/s12311-015-0724-2 (2016). [DOI] [PMC free article] [PubMed] [Google Scholar]
- 29.Sillitoe RV & Joyner AL Morphology, molecular codes, and circuitry produce the three-dimensional complexity of the cerebellum. Annu Rev Cell Dev Biol 23, 549–577, doi: 10.1146/annurev.cellbio.23.090506.123237 (2007). [DOI] [PubMed] [Google Scholar]
- 30.Fleming JT et al. The Purkinje neuron acts as a central regulator of spatially and functionally distinct cerebellar precursors. Dev Cell 27, 278–292, doi: 10.1016/j.devcel.2013.10.008 (2013). [DOI] [PMC free article] [PubMed] [Google Scholar]
- 31.Parmigiani E et al. Heterogeneity and Bipotency of Astroglial-Like Cerebellar Progenitors along the Interneuron and Glial Lineages. J Neurosci 35, 7388–7402, doi: 10.1523/JNEUROSCI.5255-14.2015 (2015). [DOI] [PMC free article] [PubMed] [Google Scholar]
- 32.Wojcinski A et al. Cerebellar granule cell replenishment postinjury by adaptive reprogramming of Nestin(+) progenitors. Nat Neurosci 20, 1361–1370, doi: 10.1038/nn.4621 (2017). [DOI] [PMC free article] [PubMed] [Google Scholar]
- 33.Yeung J & Goldowitz D Wls expression in the rhombic lip orchestrates the embryonic development of the mouse cerebellum. Neuroscience 354, 30–42, doi: 10.1016/j.neuroscience.2017.04.020 (2017). [DOI] [PubMed] [Google Scholar]
- 34.Yeung J et al. Wls provides a new compartmental view of the rhombic lip in mouse cerebellar development. J Neurosci 34, 12527–12537, doi: 10.1523/JNEUROSCI.1330-14.2014 (2014). [DOI] [PMC free article] [PubMed] [Google Scholar]
- 35.Garzia L et al. A Hematogenous Route for Medulloblastoma Leptomeningeal Metastases. Cell 173, 1549, doi: 10.1016/j.cell.2018.05.033 (2018). [DOI] [PubMed] [Google Scholar]
- 36.Morrissy AS et al. Spatial heterogeneity in medulloblastoma. Nat Genet 49, 780–788, doi: 10.1038/ng.3838 (2017). [DOI] [PMC free article] [PubMed] [Google Scholar]
- 37.Morrissy AS et al. Divergent clonal selection dominates medulloblastoma at recurrence. Nature 529, 351–357, doi: 10.1038/nature16478 (2016). [DOI] [PMC free article] [PubMed] [Google Scholar]
- 38.Wu X et al. Clonal selection drives genetic divergence of metastatic medulloblastoma. Nature 482, 529–533, doi: 10.1038/nature10825 (2012). [DOI] [PMC free article] [PubMed] [Google Scholar]
- 39.Tan IL et al. Lateral cerebellum is preferentially sensitive to high sonic hedgehog signaling and medulloblastoma formation. Proc Natl Acad Sci U S A 115, 3392–3397, doi: 10.1073/pnas.1717815115 (2018). [DOI] [PMC free article] [PubMed] [Google Scholar]
- 40.Kim JA, Sekerkova G, Mugnaini E & Martina M Electrophysiological, morphological, and topological properties of two histochemically distinct subpopulations of cerebellar unipolar brush cells. Cerebellum 11, 1012–1025, doi: 10.1007/s12311-012-0380-8 (2012). [DOI] [PMC free article] [PubMed] [Google Scholar]
Methods References
- 41.Nguyen QH et al. Profiling human breast epithelial cells using single cell RNA sequencing identifies cell diversity. Nat Commun 9, 2028, doi: 10.1038/s41467-018-04334-1 (2018). [DOI] [PMC free article] [PubMed] [Google Scholar]
- 42.De Simoni A & Yu LM Preparation of organotypic hippocampal slice cultures: interface method. Nat Protoc 1, 1439–1445, doi: 10.1038/nprot.2006.228 (2006). [DOI] [PubMed] [Google Scholar]
- 43.Zheng GX et al. Massively parallel digital transcriptional profiling of single cells. Nat Commun 8, 14049, doi: 10.1038/ncomms14049 (2017). [DOI] [PMC free article] [PubMed] [Google Scholar]
- 44.Lun AT, Bach K & Marioni JC Pooling across cells to normalize single-cell RNA sequencing data with many zero counts. Genome Biol 17, 75, doi: 10.1186/s13059-016-0947-7 (2016). [DOI] [PMC free article] [PubMed] [Google Scholar]
- 45.Satija R, Farrell JA, Gennert D, Schier AF & Regev A Spatial reconstruction of single-cell gene expression data. Nat Biotechnol 33, 495–502, doi: 10.1038/nbt.3192 (2015). [DOI] [PMC free article] [PubMed] [Google Scholar]
- 46.Butler A, Hoffman P, Smibert P, Papalexi E & Satija R Integrating single-cell transcriptomic data across different conditions, technologies, and species. Nat Biotechnol 36, 411–420, doi: 10.1038/nbt.4096 (2018). [DOI] [PMC free article] [PubMed] [Google Scholar]
- 47.Trapnell C et al. The dynamics and regulators of cell fate decisions are revealed by pseudotemporal ordering of single cells. Nat Biotechnol 32, 381–386, doi: 10.1038/nbt.2859 (2014). [DOI] [PMC free article] [PubMed] [Google Scholar]
- 48.Qiu X et al. Reversed graph embedding resolves complex single-cell trajectories. Nat Methods 14, 979–982, doi: 10.1038/nmeth.4402 (2017). [DOI] [PMC free article] [PubMed] [Google Scholar]
- 49.Zerbino DR et al. Ensembl 2018. Nucleic Acids Res 46, D754–D761, doi: 10.1093/nar/gkx1098 (2018). [DOI] [PMC free article] [PubMed] [Google Scholar]
- 50.Newman AM et al. Robust enumeration of cell subsets from tissue expression profiles. Nat Methods 12, 453–457, doi: 10.1038/nmeth.3337 (2015). [DOI] [PMC free article] [PubMed] [Google Scholar]
- 51.Dobin A et al. STAR: ultrafast universal RNA-seq aligner. Bioinformatics 29, 15–21, doi: 10.1093/bioinformatics/bts635 (2013). [DOI] [PMC free article] [PubMed] [Google Scholar]
- 52.Love MI, Huber W & Anders S Moderated estimation of fold change and dispersion for RNA-seq data with DESeq2. Genome Biol 15, 550, doi: 10.1186/s13059-014-0550-8 (2014). [DOI] [PMC free article] [PubMed] [Google Scholar]
- 53.Saunders A et al. Molecular Diversity and Specialization among the Cells of the Adult Mouse Brain. Cell 174, 1015–1030 e1016, doi: 10.1016/j.cell.2018.07.028 (2018). [DOI] [PMC free article] [PubMed] [Google Scholar]
- 54.Zeisel Al et al. Molecular Architecture of the Mouse Nervous System. Cell 174, 999–1014 e1022, doi: 10.1016/j.cell.2018.06.021 (2018). [DOI] [PMC free article] [PubMed] [Google Scholar]
Associated Data
This section collects any data citations, data availability statements, or supplementary materials included in this article.
Supplementary Materials
Data Availability Statement
The datasets generated and analysed during the current study are available in the following repositories: BAMs and filtered gene matrices of mouse developmental time points scRNA-seq (GSE118068), FASTQs of PFB bulk RNA-seq and microarray expression (EGAS00001002696, GSE64415), BAMs of human tumor scRNA-seq and either BAMs or FASTQs of bulk PFA/C-PA RNA-seq (EGAS00001003170) and FASTQs of MB bulk RNA-seq (EGAD00001004435).


