

Abstract
The aim of the present work was to study the technological impact of incorporating canola protein concentrate (extract) into gluten-free bread formulation made of white rice flour. The main properties of the obtained dough and bread were compared to two control formulations made of 100% wheat flour and 100% rice flour. The canola protein concentrate was added at 3, 6 and 9% supplementation level of the rice flour. The bread making process was conducted by approved technology and the obtained results showed that addition of canola protein concentrate to rice flour significantly improved the overall quality of the resulted bread even if its mass volume (1.777 mL/g) and honeycomb structure were of lower quality compared to those of control bread which was made of 100% wheat flour (2.518 mL/g). However, the mass volume of rice bread supplemented with canola protein concentrate was significantly higher than that of bread made of 100% rice flour (1.417 mL/g. In summary, this project demonstrated the positive impact of canola proteins incorporation into white rice flour-based gluten-free bread. These results contribute to the progress of current research focusing on substituting gluten by other proteins having good techno-functional properties. Moreover, a mathematical model was used to explain the impact of the added canola protein concentrate on the intensity of the reactions involved in the dough matrix during oven baking. The obtained model clearly highlighted the significant effect of both the baking time and temperature.
Keywords: Gluten-free bread, Rice, Wheat, Canola, Mathematical modelling
Introduction
Celiac disease is an autoimmune enteropathy associated with diet. It is characterized by gluten intolerance, a protein found in wheat and other cereals such as rye, barley and oats. It occurs in genetically predisposed individuals (Aaron et al. 2019; Kahaly et al. 2018). The toxic protein fraction is an alcoholic extract of prolamins which is wheat gliadin, rye seine, barley hordenine and low oat avenin (Kaur et al. 2018). Prolamines are responsible for total or subtotal atrophy of the intestinal villi leading to a malabsorption of many nutrients that results in stunted growth in children and a risk of osteoporosis in adults (Malalgoda and Simsek 2017). Currently, celiac disease is considered one of the most common gastrointestinal conditions in the world (Lerner 2010). Epidemiological studies have shown that 1% of people suffer from gluten intolerance. Such a rate establishes celiac disease as one of the most common food intolerances (Cranney et al. 2007; Kaplan 2005; Lerner 2010; Schmitz 2013). The gluten-free diet remains the only treatment for celiac disease that is a complete and definitive exclusion of gluten from food and its substitution by other cereals, mainly rice and corn (Matuchansky et al. 2004; Sciarini et al. 2010, 2012). However, gluten is an essential constituent of flours such as wheat, oats, barley and rye. It plays an important role in the quality of bakery products for its rheological and sensory properties.
Rice is the most consumed food in the world. It is one of the most suitable cereals for the preparation of gluten-free products thanks to its hypoallergenic properties, and high digestibility (Mancebo et al. 2015). However, rice proteins have relatively poor functional properties in bread making (Itthivadhanapong et al. 2016). They are unable to form a viscoelastic network necessary to retain the CO2 produced during the fermentation, which leads to a product with a low specific volume and a compact crumb not resembling the fine and open structure of the wheat bread. In addition, the protein content in white rice flour is relatively low to be considered as an important source of this essential nutrient (Gujral et al. 2003; He and Hoseney 1991). Despite the fact that several gluten-free products are now available on the market, gluten-free bakery products are generally of poor quality due to the absence of the gluten network. The development of gluten-free foods is therefore a challenge for the food industry. It is necessary to add to the formulations of these products ingredients capable of mimicking the functional properties of gluten, particularly with respect to the mass volume and the honeycomb structure of the final product (Arendt and Dal Bello 2011; Garcia et al. 2005).
Canola meal is considered an important source of protein, essential minerals, vitamins, carbohydrates and fiber. It contains about 40% protein on dry basis and its amino acid content is relatively well balanced. Canola proteins have been extensively studied for use in the food industry to replace conventional ingredients such as whey and egg yolk. In addition, it has been shown that canola proteins have good functional properties for use in various food matrices (Aider and Barbana 2011; Khattab and Arntfield 2009; Naczk et al. 1998a, b; Shahidi and Naczk 1992). However, even if canola is highly convenient to enhance the nutritional quality of gluten-free foods, its effect on the product quality during baking must be controlled. For example, adding canola extract may significantly increase the color of the crust so as it will be non-attractive for consumers. Thus, it is important to understand the extend of such reaction during baking by a mathematical approach in order to facilitate the prediction of such reactions. Moreover, in the literature, there is no studies on gluten-free bread formulations using a mixture of white rice flour and canola proteins.
Thus, the aim of this study is to develop a gluten-free bread by mixing rice flour with canola meal extract and to mathematically predict the reaction between these components.
Materials and methods
Raw materials and chemical
Wheat flour (Triticum aestivum) was used as a control and was purchased from the market (P&H Milllingroup, Montreal, Canada). White rice flour (Orysae sativa japonica) was purchased from Asian market (Erawan Brand, Thailand). Canola crude protein concentrate was extracted from a blend of Canadian varieties of canola meal (Bungee, Bcancour, Canada). The extraction of the canola crude proteins was carried out in a 10% canola meal suspension dispersed in water with adjusted pH to 12 by addition of aqueous NaOH solution. The suspension was mixed for 60 min and subsequently centrifuged using a CEPA TYPE TZ5 centrifuge and the supernatant was recovered and dried using a rotary disk atomizer dryer. All other ingredients and chemicals were of food or analytical grade.
Bread making process
The bread making process consisted of a sequential completion of the operations required to obtain bread at the laboratory scale. In order to compare the bread making results of the samples, the bread making protocol was developed as follows: Control-1: Bread from 100% wheat flour. Control-2: Bread from 100% white rice flour without additives. Mix of flours: white rice flour + canola proteins at different supplementation levels (3, 6 and 9%) (Table 1). The used bread making process was as follows: Dry ingredients were mixed for 15 s in a 100–200 g mixer (National Mfg Co, Lincoln, Neb, USA). Then water (37 °C) was added, and dough was mixed to optimum development (4 min). Dough was then proofed at 37 °C and 85% relative humidity for a total period of 120 min with periodical punches (flaps) of the dough after 69 min, then after 34 min. Then dough were put in moulds and proofed for another 17 min at 37 °C and 85% relative humidity and baked at 210 °C for 20 min in a revolving oven (Doyon, Quebec, Canada). After cooling for 1 h, loaf volume was measured by rapeseed displacement (National Mfg. Co., Lincoln, NE, U.S.A) (Gélinas et al. 2001).
Table 1.
Formulations of the produced breads
| Ingredients, g | 100% wheat bread* | 100% rice bread** | Rice bread + 3% canola protein concentrate | Rice bread + 6% canola protein concentrate | Rice bread + 9% canola protein concentrate |
|---|---|---|---|---|---|
| Flour | 300 | 300 | 291 | 282 | 273 |
| Water | 195 | 225 | 225 | 225 | 225 |
| Canola protein concentrate | 0 | 0 | 3 | 6 | 9 |
| Baker yeast | 3.6 | 3.6 | 3.6 | 3.6 | 3.6 |
| Sugar | 15 | 15 | 15 | 15 | 15 |
| Salt | 4.5 | 4.5 | 4.5 | 4.5 | 4.5 |
*Control bread-1
**Control bread-2
Analyzes
The pH measurements were carried out on 10 g of the dough before and after the fermentation by an automatic titrator (Mettler Toledo brand, model LD50). After a calibration of the electrode with two buffer solutions of pH 7 and 4, obligatory rinsing of the electrode is carried out before introducing it into a container containing the sample to be analyzed. At the end of the run, the pH results are displayed on the titrator screen.
The thermal variation was measured by thermo-buttons that are programmed by the OneWireViewer software using a pliers that reads the data recorded by each thermo-button. At the beginning, the software is open, the clamp is plugged into the computer that allows the programming of the thermo-button (temperature sampling every 5 min). Then, the thermo-button is inserted after kneading inside the dough during the manufacturing process, the recovery of the thermo-button data is possible once the bread is cooled.
The volume of the bread is measured by the method of displacement of the poppy seeds, the baked bread is put in a graduated container of known volume, the container is filled by the seeds of poppies until the bread is completely covered. After leveling these seeds with a metal spatula, the poppy seeds are transferred to a graduated container.
Measurement of trichromatic parameters.
Color parameters of the bread
The L*, a*, b* parameters were measured on control breads and gluten-free breads using a colorimeter (CR-300 colorimeter, Minolta Co. Osaka, Japan). This method of quantifying the parameters of the color in an objective way uses the space L*, a*, b* defined by the International Commission of the Lighting (CIE). In this system, L* represents brightness or luminance, a* the green–red scale, and b* the blue-yellow scale. A positive value of a* and b* is a mixture of red and yellow whose relative intensity depends on their values. The measurements of the color parameters L*, a*, b* were carried out on the obtained bread loaves. After a calibration of the device with a white plate supplied with this device, the cell of the device was directly applied to the bread. Measurements were made and L* a* b* values were recorded on the monitor. The browning index was determined according to the reference (Lunadei et al. 2010).
Texture profile analysis
The textural properties of the bread were evaluated using the TA.XT2i texture profile analyses (TPA) instrument (Texture Technologies Co. Scarsdale, NY, USA). The hardness of the bread was measured as follows: the bread samples were subjected to double compression (50% compression) using a 5 kg probe in strain target mode and a trigger force of 10 g. The maximum force for each of the two compression phases was considered to be the hardness (Force 1 and Force 2). Samples with dimensions of 30 × 30 × 30 mm were used. The TPA settings were defined as follows: cylinder probe of 30 mm ∅, pre-test speed of 2 mm/s, test speed of 2 mm/s, post speed of 2 mm/s and compression distance of 50% (Peng et al. 2017). After the calibration of the apparatus, the samples, all of which were cut uniformly, were analyzed by using 50 kg load cell at 50% compressing level.
Statistical analyzes
All experiments were carried out in triplicate and mean values ± std were used for comparisons. A complete random factorial design was used. A single-factor, repeated-measures analysis of variance (ANOVA) was performed on some measurements such as pH, mass volume, protein content, and texture, while a two-factor repeated-response ANOVA was used for the colorimetry analysis. Statistical analyzes were performed using SAS software (V9.4, SAS Institute Inc, Cary, NC, USA). Multiple comparisons of averages were made by the LSD method at a 95% confidence level (p < 0.05).
Results and discussion
Variation of the dough pH
Fermentation, a specific step in a bread making process which is characterized by obtaining an acid paste, has the role of enriching the matrix with carbon dioxide. Fermentation causes a loss in total matter (in the order of 2–3%) by the transformation of sugars into alcohol and carbonic acid (Chargelegue et al. 1994). This acidity improves the taste quality of breads. The obtained results showed only a slight decrease of the pH in all the doughs during the fermentation process. Moreover, there are no significant differences between the pH decreases of the different samples. The addition of different percentages of canola protein concentrate to the dough formulations did not significantly affect the decrease of the pH before and after the fermentation process. The pH values were in the range of 8.64 ± 0.04. This can be explained by the relatively short fermentation time used in the present bread making protocol.
Thermal variation during cooking and cooling
Figure 1 shows the evolution curves of the bread temperature during cooking and cooling. We note that the curves all remain very close to each other throughout the cooking and cooling phase. During the first few minutes of cooking, the temperature of the dough is constant with an average value of 34.58 ± 2.79 °C. This is probably the time needed for the heat exchange between the oven and the interior of the dough to be established. This step is followed by a linear and rapid increase in temperature, which starts 5 min after the products are loaded and ends after 18 min. Above 80 °C, under the effect of heat and humidity, sugars located on the surface of bread caramelize. Part of the water in the bread evaporates to give a resistant crust and a non-sticky crumb. The caramelization reaction (Maillard reaction) is the result of the reaction of sugars (simple and complex) with the amine functions of proteins. This phenomenon is accentuated by the presence of water and heat. The maximum temperature reached inside the bread is 95.31 ± 0.47 °C. Once the crumb reaches this temperature, all physical processes such as evaporation and coagulation of proteins are maximized. These results are consistent with the results described by Chhanwal et al. (2011) on the baking process of bread. In the case of 100% rice bread, the maximum temperature is reached before the other breads; which leaves us to conclude that the higher the protein content, the longer the time required to reach the maximum temperature. This phenomenon is probably related to complete coagulation of proteins that takes a certain time to be achieved (Chhanwal et al. 2011).
Fig. 1.
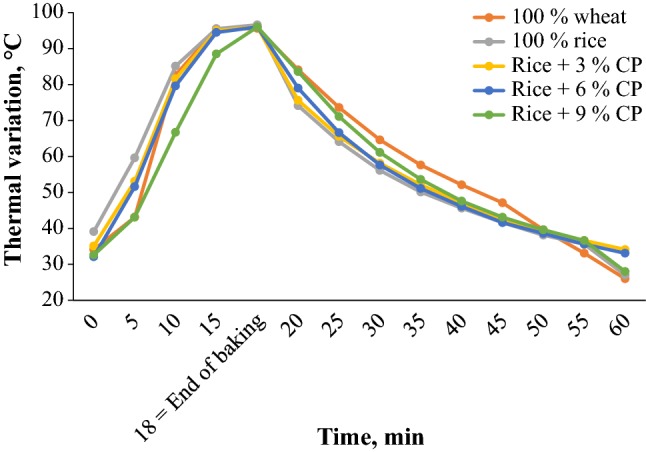
Thermal variation during baking and cooling of the breads. The values represent the mean ± SD (n = 6). In Time (min) axis, end of the baking procedure was set at 18 min. CP canola proteins
Mass volume variation
Figure 2 show the mass volume of experimental breads. This criterion is extremely important in bakery, because the bread volume is a crucial attribute that influences its acceptability by the consumer. It is strongly influenced by the amount of gas retained by the dough. The higher the gas holding capacity of the dough, the greater the volume of the final loaf (Balla et al. 1999). It can be seen that the lowest value of the mass volume is that of Control-2 (100% rice bread) which is 1.417 cm3/g. The mass volume of (rice + 6% canola proteins) bread is clearly higher with a value of 1.736 cm3/g compared to all other gluten-free breads produced by the combination of rice flour and canola protein. It is followed by bread (rice + 9% canola proteins) which has a mass volume value of 1.683 cm3/g. The 100% wheat flour control bread-1 exhibits a higher mass volume than all the other breads with a value of 2.518 cm3/g. A positive and significant correlation was found between canola protein content and the mass volume of gluten-free breads, which means that the total protein content exerts a considerable influence on the development of the mass volume of bread (Feillet et al. 1994). The significant value of the mass volume noted in the case of rice breads + 6% canola proteins and that of 9% canola proteins can be explained by the richness of the meal supplemented with canola protein. From the results of the baking test, it can be concluded that the bread obtained from 100% wheat flour (Control-1) is very satisfying because it has a sufficiently high mass volume, a crumb well developed and a fine and regular alveolar structure. Rice flour bread with 6% canola protein also showed a marked improvement in its mass and alveolar structure compared to 100% rice bread. This could open a way to satisfy gluten-free bread consumers.
Fig. 2.

Mass volumes of the obtained loaves (cm3/g) as a function of the formulation type and canola proteins supplementation level
According to (Calvel 1984), the carbon dioxide produced during the fermentation of soft wheat breads accumulates to exert an internal pressure on the impermeable three-dimensional network of gluten, which allows the dough to rise while maintaining an external structure. In the work of Chargelegue et al. (1994) (Chargelegue et al. 1994), the authors explain this phenomenon by the power take-off of the dough, which corresponds to a reduction in the tenacity of the gluten associated with an increase in its elastic resistance. Once the fermented dough is put into the oven, emphasizes that the bread volume increases sharply by the expansion of the gases contained in the cells, then gradually until the yeasts are inactivated at around 55 °C and enzymes (especially α-amylase) at 70 °C. As for the starch, it becomes gelatinized at a temperature of 65–80 °C, whereas proteins thermo-coagulate at 70–90 °C. The expansion of the gases continues above 70 °C since the stresses exerted by the dough do not prevent their expansion, even if the crumb begins to freeze only at a temperature of 100 °C. As a result, we can conclude that the complete absence of proteins forming an impermeable gluten network in rice flour can be the main cause of the escape of carbon dioxide during fermentation and cooking (Feillet 2000). Therefore, the baked breads are very little developed and their crumbs are compact and packed. The low quantity and quality of rice flour proteins are thought to be responsible for the low gas content of these pastes, leading to low mass bread and a compact structure (He and Hoseney 1991). The addition of the canola proteins in the formulations studied significantly favored the development of the bread volume and gave a better color of the crust.
Effect on bread colour variation
The colorimetric measurements of bread crusts and crumbs are important parameters for the accuracy of their color and confirm the visual observations (Fig. 3). The obtained data showed that the Control bread-2 (made with 100% rice flour) has the highest value of luminance, expressed by the L* parameter, for both the crust and the crumb, which explains its very white color which distinguishes it other breads. However, the value of the L* parameter was markedly, but gradually, decreased until it reached a very low level which corresponded to the L* value of the rice bread + 9% canola proteins, after adding the canola protein in the other three gluten-free breads. This result means that the appearance of the dark color in the crust is actually due to the very dark and dark color of the canola protein powder in an aqueous medium. As for the L* value of the crust of the control bread-1 (100% wheat), it is between those of rice bread + 3% canola proteins and rice + 6% canola proteins. As for the crumb, the value of the L* parameter of the crumb of the control bread-2 (100% rice) is close to the L* of the crumb of the rice bread + 3% canola proteins. The parameter a* denotes the balance between green (if negative value) and red (if positive value). Negative values were obtained for all breads and crumbs with the exception of rice flour bread with 9% canola protein that showed a shift to positive values for both crust and crust than for and the crumb. The parameter b* denotes the balance between blue (if negative value) and yellow (if positive value). For this parameter, all samples (crusts and crumb) were characterized by a predominance of yellow. The percentage increase in canola protein in the bread formulation caused a considerable rise in the b* parameter. The highest value recorded was that of rice bread + 9% canola proteins, while the lowest value was that of control bread-2 (100% rice). Finally, the browning index (BI*) shows a significant increase for the surfaces of gluten-free breads supplemented with canola protein. Rice bread + 9% canola proteins had the highest value (25.20 ± 0.001) because of its very dark and dark color, while the control bread-2 (100% rice) was characterized by a BI* value the highest low (1.29 ± 0.001); which explains its whitish color. These results showed that incorporation of canola protein into the rice flour-based gluten-free bread formulation at increasing percentages resulted in a significant increase in the BI* parameter.
Fig. 3.

Photographs of the obtained bread samples as a function of the used formulations (CP canola proteins)
Texture profile analysis
Table 2 shows the results obtained for the analysis of the texture profile of the different loaves studied in this project. The parameters that have been selected are the firmness of the crumb, its cohesion, elasticity, adhesion and chewability, its exfoliating power and its resilience. These parameters are best suited to express the mouth feel that a consumer experiences when eating a slice of bread. The data obtained clearly show that all the parameters evaluated were significantly affected by the type of basic matrix and the substitution rate of rice flour by canola proteins (p < 0.001).
Table 2.
Experimental average values of the texture parameters of the breads. The values represent the mean ± standard deviation (n = 6)
| Property | Type of bread formulation | ||||
|---|---|---|---|---|---|
| 100% wheat flour | 100% rice flour | Rice flour + 3% canola | Rice flour + 6% canola | Rice flour + 9% canola proteins | |
| Firmness | 17.33 ± 1.64 | 22.95 ± 2.017 | 18.20 ± 1.07 | 11.63 ± 1.35 | 9.08 ± 0.75 |
| Cohesiveness | 0.72 ± 0.06 | 0.68 ± 0.29 | 0.71 ± 0.07 | 0.72 ± 0.04 | 0.73 ± 0.05 |
| Elasticity | 1.03 ± 0.07 | 0.94 ± 0.02 | 1.05 ± 0.23 | 1.05 ± 0.22 | 1.12 ± 0.29 |
| Adherence | − 0.08 ± 0.01 | − 0.01 ± 0.01 | − 0.01 ± 0.01 | − 0.02 ± 0.02 | − 0.07 ± 0.01 |
| Masticability | 12.58 ± 1.56 | 19.26 ± 7.88 | 13.76 ± 2.46 | 8.71 ± 2.52 | 6.06 ± 0.92 |
| Gumminess | 12.52 ± 1.34 | 13.18 ± 1.77 | 16.64 ± 1.74 | 8.24 ± 0.75 | 6.40 ± 0.96 |
| Resilience | 0.52 ± 0.03 | 0.47 ± 0.01 | 0.51 ± 0.051 | 0.52 ± 0.03 | 0.52 ± 0.04 |
It is possible from the obtained results to observed that the Control-2 (100% rice) has the highest value of firmness (hardness) compared to other breads supplemented with canola protein as well as that made of 100% wheat flour. The results obtained showed that the addition of canola protein to rice flour reduced the hardness of the final product and that, in general, the increase in the amount of canola protein introduced into the rice flour made the breads less hard than the Control-2 made from 100% rice flour. Unlike proteins conventionally used in gluten-free bread formulations that give a hard texture, canola proteins make the product fluffier. In fact, the addition of soy protein or egg white resulted in a significant reduction in the functionality of the dough (Crockett et al. 2011). In the work reported by Crockett et al. (2011), gluten-free formulations were added with soy protein and egg white to improve their quality (Crockett et al. 2011). To determine the ability of these proteins to replace hydroxypropyl methylcellulose (HPMC), soy proteins were added at 1, 2 and 3%, while egg whites were added at 5, 10 and 15%. Pasta was analyzed using rheological techniques. Baked breads were measured for mass volume and tensile strength. The authors reported that the addition of soy protein and egg whites reduced dough stability by removing the functionality of HPMC, which reduces available water and weakens HPMC interactions with the matrix (starch). As a result, the stability of the foam that formed in the dough was significantly reduced.
In the present study, we observed that chewability is strongly influenced by the firmness of the breads (Boursier 2005). The addition of canola protein to the rice formulation resulted in an improvement in the cohesion, elasticity, exfoliating capacity and resilience of the breads compared to Control-2 made from 100% rice flour. This could be explained by the participation of canola proteins in the formation of a protein network leading to the creation of intra- and inter-molecular disulfide bonds (covalent bonds) that associate with the constituents of the pulp to form a more developed structure. This results is similar to that obtained by Meredith (1964) with wheat flour containing gluten (Meredith 1964). At the same time, it has been observed that the adhesion of the loaves decreases with the increase of the canola proteins in the formulation. Control-2 (100% rice bread) has the highest value of adhesion, which can be explained by its very high water content which has remained in its crumb after cooking because of the capacity starch to bind large amounts of water. Indeed, a crumb of a wet bread is responsible for the undesirable texture property of adhesion. As for the lowest value of the adherence of the crumb was that of the Control-1 (wheat 100%), which agrees with its good textural properties. Finally, the results obtained on the analysis of the texture of the final bread showed that the textural properties of the rice flour breads were positively influenced by the incorporation of the canola proteins at different percentages. The results also showed a decrease in firmness, chewability and adhesion as well as improved cohesion and elasticity of gluten-free breads.
Mathematical modeling of the baking process
Positioning of the problem
Bread is a complex medium in which many physical and chemical phenomena take place simultaneously. The medium studied herein consists of three phases: the solid phase (dough formulation), the liquid phase (water) and the gas phase composed of water vapour and carbon dioxide resulting from the fermentation of the dough under the action of baker’s yeasts. The main mechanisms of mass transfer within the studied medium involve diffusion phenomena (in liquid and vapour form), phenomena of mass transfer by capillarity and mass transfer due to temperature gradients. In terms of heat transfer, the medium is mainly dominated by convection (outside the bread) and conduction (inside the bread). The thermo-hydric behavior of the material is then described from the equations of conservation of mass and energy but supplemented by the diffusion laws (Nicolas et al. 2010) (Eq. 1) (Fig. 4).
Fig. 4.
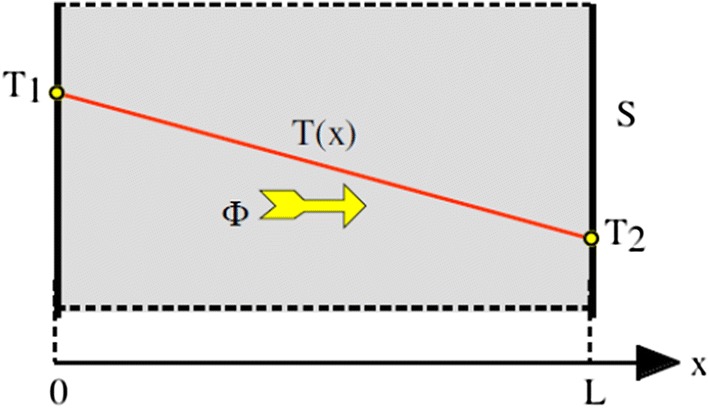
Schematic representation of the heat flow through a homogeneous wall
Mass balance
| 1 |
Water content (liquid or vapour), kg kg−1; time, s; Diffusion coefficient in the air, m2 s−1
The displacement of the water molecules inside the matrix depends on the intensity of the convection (Eq. 2).
| 2 |
with corrected mass transfer coefficient, kg Pa−1 m−2 s; Pressure (solid or surface), Pa; ∞: Pressure (ambient), Pa; Temperature (solid or surface), K; ∞: Temperature (ambient), K
Moreover, the pressure Ps and Pα can be expressed as follows:
where Water activity; Pressure at saturation, Pa; Relative humidity, %
Energy balance
The energy balance of the studied system can be described as follows (Eq. 3):
| 3 |
Density, kg m−3; Specific heat, J kg−1 K−1; Heat conductivity, W m−1 K−1
By accepting the aforementioned limiting conditions, the mode of the thermal transfer inside the bread matrix is governed by conduction (Bure 1979) (Eq. 4). Thus:
| 4 |
h: Heat transfer coefficient, W m−2 K−1; Emissivity coefficient; Stefan-Boltzmann constant, 5.67 × 10⁻⁸ W m−2 K−4.
At the air/bread interface, the mass flow by evaporation is equal to the sum of the liquid and vapour flows; the pressure corresponds to the atmospheric pressure; the surface of the bread receives two energy inputs (by convection and by radiation) and the normal stress takes the value of the atmospheric pressure (Eq. 5). Thus:
| 5 |
g = atm; n: Dynamics viscosity, Pa.s; l: liquid; v = water vapour; Fm = Evaporated water flow, kg m−2 s−1
Fourier related the conduction of heat to the flow of a fluid that takes place from warm regions to cold regions and whose only manifestations in the material are reflected in variations of temperature. Thus, by taking into account the dimensions of the baking dish and considering it as a homogeneous wall of thickness L, section S, with a thermal conductivity whose face at x = 0 is maintained at the temperature T1 and the face at x = L at a value T2(Sablani et al. 1998). Thus, the heat flow f (W) that cross this surface can be expressed as follows (Eq. 6):
| 6 |
f: Heat flow, W; Heat conductivity, W m−1 K−1; S: Section area, m2; dT/dx: Temperature gradient, K m−1.
By considering that the distribution of the temperature is linear, one can write the following equation (Eq. 7):
| 7 |
The temperature gradient is thus constant (Eqs. 8–9):
| 8 |
| 9 |
L: Thickness, m.
Thermal conductivity includes the evaporation–condensation mechanism and has been defined as a function of temperature (Purlis and Salvadori 2010). Since in this study the maximum temperature was below 100 °C, it can be calculated from the following equation (Eq. 10):
| 10 |
Bread is a material that is constantly evolving during baking. The pores of nanometric size at the beginning of baking, see their size increase until reaching the millimeter size at the end of baking. Porosity is an important parameter and it depends on the gas pressure and the rheological properties of the bread (Grenier et al. 2008) (Eq. 11).
| 11 |
g: Gas pressure, Pa; atm: Atmospheric pressure, Pa; e: Porosity.
The phenomenon of starch gelatinization can be used not only as a minimum cooking index in the industrial cooking process in order to know the time required for baking breads (Zanoni et al. 1995a, b), but also gives the bread its final structure and determines its organoleptic profile (Zanoni et al. 1991). The degree of gelatinization is described by the following equation (Eq. 12):
| 12 |
k: Constant of reaction kinetics (velocity, intensity).
In addition, according to the Arrhenius law, the rate constant of the reaction depends on the temperature and can be written in the following form (Eq. 13):
| 13 |
Ea = Activation energy calculated on the basis of differential scanning calorimetry data. A = 2.89·103 s−1; T: Temperature of the reaction, K; R: Gas constant (8.314 J·K−1 mol−1).
The rate of this chemical reaction produced by the proteins during cooking can be calculated and written in the following form (Eq. 14):
| 14 |
Assuming that the constant of the rate of this chemical reaction produced by the proteins during cooking is equal to the rate constant of the reaction obtained by Arrhenius’s law. We can write the following: V* = k.
The value of k was varied depending on the internal temperature of the dough during cooking the best formula obtained in the first stage of the project, namely rice bread + 6% PC.
K*: Constant (Quantitative coefficient proportional to the concentration of proteins).
| Time | t0 = 0 min | t1 = 18 min |
|---|---|---|
| Proteins concentration | 7.9097% | 9.6027% |
K* can be calculated by a simple equation of type y = a + bX.
K* = a = 0.0940; V*: Constant rate of reaction produced by the added proteins. T: Temperature during the baking process, K. t: Baking time, s.
In order to express the values of α and β which are relational coefficients between the speed of the protein reaction, the time and the temperature respectively, the following equation can be solved as expressed in Eq. 15 as follows:
| 15 |
Let the answer Yi = b0 + b1Xi1 obtained by a linear regression equals the logarithm of the constant of the speed of the reaction of the proteins (Table 3, Fig. 5):
Table 3.
Linear regression of the reaction rate according to the internal temperature of the bread formula consisted of bread made of rice flour supplemented with 6% canola proteins
| Experiment | % of added proteins | Internal temperature | Time, min | Log_K | Log_time |
|---|---|---|---|---|---|
| 1 | 6 | 51.024 | 5 | − 9.436 | 1.791 |
| 2 | 78.963 | 10 | − 5.315 | 2.397 | |
| 3 | 96.075 | 18 | − 3.098 | 2.944 | |
| 4 | 52.956 | 5 | − 9.129 | 1.791 | |
| 5 | 79.024 | 10 | − 5.306 | 2.397 | |
| 6 | 95.995 | 18 | − 3.108 | 2.944 | |
| 7 | 52.357 | 5 | − 9.224 | 1.791 | |
| 8 | 80.786 | 10 | − 5.068 | 2.397 | |
| 9 | 95.993 | 18 | − 3.108 | 2.944 |
Fig. 5.
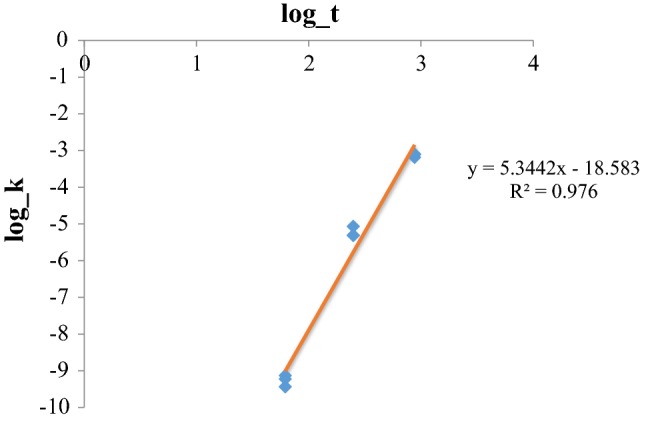
Linear regression of the reaction rate of the canola proteins incorporated to rice bread formulation at 6% supplementation level
From (Eq. 14) and by considering V* = k, one can obtain the following equations (Eqs. 16–19):
| 16 |
| 17 |
| 18 |
| 19 |
We obtain the final equation as follows (Eq. 20):
| 20 |
Finally, the rate of constant of the reaction produced by the incorporated canola proteins to the rice flour can be written in the following form (Eq. 21):
| 21 |
Conclusion
This study is a contribution to the development of new knowledge on gluten-free bread making. The technological feasibility of gluten-free bread making on the basis of white rice flour supplemented with canola protein extract was demonstrated. This study has shown that canola proteins can be added to white rice flour bread formulation as ingredient that can mimic the functional properties of gluten at concentrations up to 6%. At this supplementation level, the obtained results showed an improvement of the technological properties of the dough and the resulted bread. Moreover, the incorporation of canola protein into gluten-free formulations had a positive impact on the nutritive value of the end product, the functionality of the dough and the physico-chemical characteristics of the final bread. A mathematical modelling of the baking process revealed the impact of the baking time and temperature on the intensity of the chemical reactions that resulted from the incorporated canola protein concentrate (extract) into the bread formulation.
Acknowledgements
The authors thank Mrs. Melanie Martineau and Mr. Pascal Lavoie for the technical support.
Footnotes
Publisher's Note
Springer Nature remains neutral with regard to jurisdictional claims in published maps and institutional affiliations.
References
- Aaron L, Torsten M, Patricia W. Autoimmunity in celiac disease: extra-intestinal manifestations. Autoimmun Rev. 2019 doi: 10.1016/j.autrev.2018.09.010. [DOI] [PubMed] [Google Scholar]
- Aider M, Barbana C. Canola proteins: composition, extraction, functional properties, bioactivity, applications as a food ingredient and allergenicity: a practical and critical review. Trends Food Sci Technol. 2011;22:21–39. doi: 10.1016/j.tifs.2010.11.002. [DOI] [Google Scholar]
- Arendt E, Dal Bello F. Gluten-free cereal products and beverages. New York: Academic Press; 2011. [Google Scholar]
- Balla A, Blecker C, Oumarou M, Paquot M, Deroanne C. Mise au point de pains composites à base de mélanges de farines de sorgho-blé et analyse texturale. Biotechnologie, agronomie, société et environnement. 1999;3:69–77. [Google Scholar]
- Boursier B. Amidons natifs et amidons modifies alimentaires. Techniques de l’ingénieur F. 2005;4690:1–22. [Google Scholar]
- Bure J. Le pain Actes du colloque du. CNERNA. 1979;1:314–318. [Google Scholar]
- Calvel R (1984) La boulangerie moderne. EYROLLES, 10éme Édition edn., Paris
- Chargelegue A, Guinet R, Neyreneuf O, Onno B, Poitrenaud B (1994) Fermentation of bread FAO
- Chhanwal N, Indrani D, Raghavarao KSMS, Anandharamakrishnan C. Computational fluid dynamics modeling of bread baking process. Food Res Int. 2011;44:978–983. doi: 10.1016/j.foodres.2011.02.037. [DOI] [Google Scholar]
- Cranney A, et al. The Canadian celiac health survey. Dig Dis Sci. 2007;52:1087–1095. doi: 10.1007/s10620-006-9258-2. [DOI] [PubMed] [Google Scholar]
- Crockett R, Ie P, Vodovotz Y. Effects of soy protein isolate and egg white solids on the physicochemical properties of gluten-free bread. Food Chem. 2011;129:84–91. doi: 10.1016/j.foodchem.2011.04.030. [DOI] [Google Scholar]
- Feillet P (2000) Le grain de blé: composition et utilisation. Editions Quae
- Feillet P, Guinet R, Morel MH, Rouau X. La Pâte. Paris: Formation et développement La panification française Lavoisier; 1994. pp. 226–279. [Google Scholar]
- Garcia ME, Zaritzky NE, Califano AN (2005) Effect of composition on rheological properties of gluten-free dough disks for “empanadas”. In: Publicato en: Congreso Argentino de sciencia y technologia de Alimentos (X: 18AL20 DE MAYO 2005: Mar del Plata), Asociacion Argentina-de Technologia de Alimentos, AATA, CYTAL
- Gélinas P, Mckinnon CM, Rodrigue N, Montpetit D. Heating conditions and bread-making potential of substandard flour. J Food Sci. 2001;66:627–632. doi: 10.1111/j.1365-2621.2001.tb04612.x. [DOI] [Google Scholar]
- Grenier D, Vanin F, Lucas T, Doursat C, Flick D, Trystram G (2008) Multiphysics during bread making: numerical modelling and technological teachings from simulations. In: Proceedings of the fourth international symposium on applications of modelling as an innovative technology in the agri-food chain, pp 147–154
- Gujral HS, Guardiola I, Carbonell JV, Rosell CM. Effect of cyclodextrin glycosyl transferase on dough rheology and bread quality from rice flour. J Agric Food Chem. 2003;51:4846. doi: 10.1021/jf0304472. [DOI] [PubMed] [Google Scholar]
- He H, Hoseney RC. Gas retention of different cereal flours. Cereal Chem. 1991;68:334–336. [Google Scholar]
- Itthivadhanapong P, Jantathai S, Schleining G. Improvement of physical properties of gluten-free steamed cake based on black waxy rice flour using different hydrocolloids. J Food Sci Technol. 2016;53:2733–2741. doi: 10.1007/s13197-016-2245-5. [DOI] [PMC free article] [PubMed] [Google Scholar]
- Kahaly GJ, Frommer L, Schuppan D. Celiac disease and endocrine autoimmunity—the genetic link. Autoimmun Rev. 2018;17:1169–1175. doi: 10.1016/j.autrev.2018.05.013. [DOI] [PubMed] [Google Scholar]
- Kaplan M. Alimentation sans gluten ni laitages: sauvez votre santé! Saint-Julien-en-Genevois: Jouvence; 2005. [Google Scholar]
- Kaur R, Ahluwalia P, Sachdev PA, Kaur A. Development of gluten-free cereal bar for gluten intolerant population by using quinoa as major ingredient. J Food Sci Technol. 2018;55:3584–3591. doi: 10.1007/s13197-018-3284-x. [DOI] [PMC free article] [PubMed] [Google Scholar]
- Khattab RY, Arntfield SD. Functional properties of raw and processed canola meal LWT Food. Sci Technol. 2009;42:1119–1124. [Google Scholar]
- Lerner A. New therapeutic strategies for celiac disease. Autoimmun Rev. 2010;9:144–147. doi: 10.1016/j.autrev.2009.05.002. [DOI] [PubMed] [Google Scholar]
- Lunadei L, Galleguillos P, Diezma Iglesias B, Lleo Garcia L (2010) Evaluation of enzymatic browning in fresh-cut apple slices applying a multispectral vision system. In: Proceedings of the international conference on agricultural engineerig. AgEng 2010
- Malalgoda M, Simsek S. Celiac disease and cereal proteins. Food Hydrocolloids. 2017;68:108–113. doi: 10.1016/j.foodhyd.2016.09.024. [DOI] [Google Scholar]
- Mancebo CM, Merino C, Martínez MM, Gómez M. Mixture design of rice flour, maize starch and wheat starch for optimization of gluten free bread quality. J Food Sci Technol. 2015;52:6323–6333. doi: 10.1007/s13197-015-1769-4. [DOI] [PMC free article] [PubMed] [Google Scholar]
- Matuchansky C, Rousseau S, Morin MC. Maladie cœliaque de l’adulte: actualités du régime sans gluten. Cahiers de Nutrition et de Diététique. 2004;39:311–317. doi: 10.1016/S0007-9960(04)94468-9. [DOI] [Google Scholar]
- Meredith P. A theory of gluten structure. Cereal Sci Today. 1964;9:33–34. [Google Scholar]
- Naczk M, Amarowicz R, Shahidi F (1998a) Role of phenolics in flavor of rapeseed protein products. In: ET Contis CTHCJMTHPFS, Spanier AM (eds) Developments in food science, vol 40. Elsevier, Amsterdam, pp 597–613. 10.1016/S0167-4501(98)80080-0 [DOI]
- Naczk M, Amarowicz R, Shahidi F. Role of phenolics in flavor of rapeseed protein products. In: Contis ET, Ho CT, Mussinan CJ, Parliment TH, Shahidi F, Spanier AM, editors. Developments in food science. Amsterdam: Elsevier; 1998. pp. 597–613. [Google Scholar]
- Nicolas V, Salagnac P, Ploteau JP, Jury V, Glouannec P, Boillereaux L (2010) Étude numérique des transferts de masse et de chaleur dans le pain lors de la cuisson
- Peng B, Li Y, Ding S, Yang J. Characterization of textural, rheological, thermal, microstructural, and water mobility in wheat flour dough and bread affected by trehalose. Food Chem. 2017;233:369–377. doi: 10.1016/j.foodchem.2017.04.108. [DOI] [PubMed] [Google Scholar]
- Purlis E, Salvadori VO. A moving boundary problem in a food material undergoing volume change – Simulation of bread baking. Food Res Int. 2010;43(4):949–958. doi: 10.1016/j.foodres.2010.01.004. [DOI] [Google Scholar]
- Sablani SS, Marcotte M, Baik OD, Castaigne F. Modeling of simultaneous heat and water transport in the baking process LWT food. Sci Technol. 1998;31:201–209. [Google Scholar]
- Schmitz J. Le régime sans gluten chez l’enfant. Pathol Biol (Paris) 2013;61:129–133. doi: 10.1016/j.patbio.2011.04.001. [DOI] [PubMed] [Google Scholar]
- Sciarini LS, Ribotta PD, León AE, Pérez GT. Influence of gluten-free flours and their mixtures on batter properties and bread quality. Food Bioprocess Technol. 2010;3:577–585. doi: 10.1007/s11947-008-0098-2. [DOI] [Google Scholar]
- Sciarini LS, Ribotta PD, León AE, Pérez GT. Incorporation of several additives into gluten free breads: effect on dough properties and bread quality. J Food Eng. 2012;111:590–597. doi: 10.1016/j.jfoodeng.2012.03.011. [DOI] [Google Scholar]
- Shahidi F, Naczk M. An overview of the phenolics of canola and rapeseed: chemical, sensory and nutritional significance. J Am Oil Chem Soc. 1992;69:917–924. doi: 10.1007/BF02636344. [DOI] [Google Scholar]
- Zanoni B, Smaldone D, Schiraldi A. Starch gelatinization in chemically leavened bread baking. J Food Sci. 1991;56:1702–1706. doi: 10.1111/j.1365-2621.1991.tb08675.x. [DOI] [Google Scholar]
- Zanoni B, Peri C, Bruno D. Modelling of browning kinetics of bread crust during baking LWT Food. Sci Technol. 1995;28:604–609. [Google Scholar]
- Zanoni B, Peri C, Gianotti R. Determination of the thermal diffusivity of bread as a function of porosity. J Food Eng. 1995;26:497–510. doi: 10.1016/0260-8774(94)00073-I. [DOI] [Google Scholar]