

Abstract
Starch chemical modification can be used in order to obtain modified starches (MS) with low affinity to water. Acetylated and succinylated starches whose applications as food ingredient depend upon their degree of substitution (DS) may be produced by esterifying starch through the extrusion process (EP). The Food and Drug Administration recommends a DS of 0.2 and 0.05 for acetylated and succinylated starches, respectively. The objective of this study was to find mathematical models to obtain the optimum values of DS, Water absorption Index (WAI) and Water Solubility Index (WSI) for MS with safe-for-food-use DS and low affinity to water, modifying the starches by acetylation and succinylation using EP. The process variables were Barrel Temperature (BT, 80–160 °C), Screw Speed (SS, 100–200 rpm) and Reactant Concentration (RC, Acetylation, 0–13% and Succinylation, 0–3%). The best conditions to obtain acetylated starches were RC = 7.88%, BT = 80 °C and SS = 100 rpm, presenting values of DS = 0.2, WAI = 7.67 g/g and WSI = 6.15%. On the other hand, the optimum conditions to obtain succinylated starches were RC = 1.12%, BT = 80 °C and SS = 126 rpm, obtaining values of DS = 0.05, WAI = 3.40 g/g and WSI = 7.92%. These results showed that it is possible to obtain acetylated and succinylated MS with safe-for-food-use levels of DS and with low affinity to water, using EP.
Keywords: Modified starches, Acetylation, Succinylation, Degree of substitution, Extrusion process
Introduction
In the last decades, the environmental awareness has stimulated the development of biomaterials from renewable resources to replace non-biodegradable materials in diverse applications (Mendes et al. 2016). Starch is one of the most elaborate biopolymers owing to its biodegradability, renewability, low cost and availability. Recently, corn starch has become the predominant raw material in the biodegradable materials production. This probably occurs because corn is the main starch source commercially available (around 65%) followed per sweet potato (13%) and cassava (11%) (Luchese et al. 2017). Starch exhibits thermoplastic properties when disintegrated by the action of heat and shear in the presence of plasticizers. However, the thermoplastic starch presents certain disadvantages such as poor mechanical properties and high-water sensibility which limits its potential application. To overcome these drawbacks, further chemical modification is usually necessary (Babaee et al. 2015; Wang et al. 2017).
The most common starch chemical modification in the food industry is done by esterifying native starch with acetic and succinic anhydride to produce acetylated and succinylated starches, respectively. Acetyl or succinyl groups are formed by esterifying the available hydroxyl groups on C2, C3, and C6 carbons of the anhydroglucose units in the starch molecules so that theoretically, the highest DS is 3. However, Food and Drug Administration (FDA) allows an average DS of 0.2 for acetylated and 0.05 for succinylated starches, for food and pharmaceutical applications. The starch source, the reaction conditions of the modifying process (temperature, and reactant concentration), and the DS determine the functional properties of the chemically modified starch. MS with low DS may improve texture, stability, and consistency of food products and, therefore, are commonly used in the food industry. In the case of MS with high DS, they are used in the non-food industry to develop diverse products such as cigarette filters, coatings, adhesives, and tablet binders (Xu et al. 2004; Diop et al. 2011; Wu et al. 2014). It is accepted that the chemical modification may affect the interaction between water and processed starches, reducing its hydrophilicity as a consequence of the integration of hydrophobic groups, either acetyl or succinyl to the starch molecules. The extent of affectation to this interaction can be monitored by determining WAI and WSI. WAI is the quantity of water absorbed by a given amount of starch and an indicator of the extent of hydrophilicity for the MS, whereas WSI is associated to the extent of dextrinization and serves to assess the starch degradation. Reduced levels of WAI and WSI lead to enhanced stability and, as a consequence, improved suitability as packaging material (Xu et al. 2005). The process most commonly used for the industrial manufacture of modified starches is referred to as the wet process, whose requirement for excessive amounts of reagents is its main drawback. However, there is an effluent free, environmentally friendly, and energy efficient alternative known as the dry process, also called the extrusion process, based on the application of high temperatures for short times. During the extrusion process, the starch undergoes molecular changes due to the applied heating and the cutting forces developed on the material being transported by the rotational motion of a single or double screw within the barrel (Wu et al. 2014). The levels of screw speed and barrel temperature influence the functional features of the MS due to the mechanical disruption and transformation of the starch molecules (González-Seligra et al. 2017). DS, WAI and WSI are MS response variables that can be affected by multiple independent variables, whose impact can be assessed by the Response Surface Methodology (RSM). RSM can help to obtain mathematical models suitable for use in the process optimization (Wu et al. 2014; Abiddin et al. 2015). Therefore, the objective of this study was to find mathematical models to obtain the optimal values of DS, WAI and WSI for MS by acetylation and succinylation using EP with safe-for-food-use DS and low water affinity.
Materials and methods
Raw materials
As a raw material for starch modification, native food-grade corn starch (Ingredion, Jalisco, Mexico) was used. Acetic anhydride (JT Baker®, Pa., USA) and succinic anhydride (Sigma–Aldrich, St. Louis, MO, USA) of analytical grade, were used as reactants to obtain the MS by acetylation and succinylation, respectively.
Starch chemical modifications
The chemical modification (acetylation and succinylation) of corn starch was promoted employing the EP under the conditions given by the experimental designs presented in Tables 1 and 2. As can be seen the study factors were: Barrel Temperature (BT, 80–160 ± 1 °C), Screw Speed (SS, 100–200 rpm) and Reactant Concentration (RC, acetic anhydride, 0–13% and succinic anhydride, 0–3%). The RC was calculated in function of the starch total mass and was slowly added with respect to starch (dry basis) according to the experimental designs. The moisture content of the starch samples was adjusted to 20 ± 1%, and then extruded using an extruder Model LT32L (Shandong Light M&E, China) with an L/D ratio of 20:1, compression 2:1 and a circular die of 4 mm diameter. The feed rate was kept constant at 35 g/min. Extruded samples were dried in an oven (Yamato DKN402C, CA, USA) at 60 °C for 12 h, ground using a hammer mill (Pulvex model 200, Mexico City, Mexico) and sieved in a mesh of 200 μm particle size. The pH was adjusted to 5.0 employing an aqueous NaOH solution (5% w/v) and the slurry was centrifuged at 6000 rpm for 10 min; the pellet was washed and dried for 24 h at 45 °C. The dried powder was ground and sieved in a mesh of 200 μm opening size. MS were packed in polyethylene bags and stored at 25 °C and 53% of relative humidity, for further analysis.
Table 1.
Experimental design and results of the response variables to obtain different combinations of BT, SS and RC (acetic anhydride) for the preparation of MS by acetylation using EP
| Treatment | Independent variables | DS | WAI (g/g) | WSI (%) | |||||
|---|---|---|---|---|---|---|---|---|---|
| Codified | Decodified | ||||||||
| X1 | X2 | X3 | BT (°C) | SS (rpm) | RC (%) | ||||
| 1 | − 1.00 | − 1.00 | − 1.00 | 96 | 120 | 2.64 | 0.07 | 7.68 | 12.13 |
| 2 | 1.00 | 1.00 | 1.00 | 144 | 120 | 2.64 | 0.07 | 7.70 | 11.10 |
| 3 | − 1.00 | − 1.00 | − 1.00 | 96 | 180 | 2.64 | 0.07 | 8.05 | 14.28 |
| 4 | 1.00 | 1.00 | 1.00 | 144 | 180 | 2.64 | 0.10 | 8.10 | 11.29 |
| 5 | − 1.00 | − 1.00 | − 1.00 | 96 | 120 | 10.36 | 0.23 | 10.10 | 8.06 |
| 6 | 1.00 | 1.00 | 1.00 | 144 | 120 | 10.36 | 0.21 | 11.41 | 8.86 |
| 7 | − 1.00 | − 1.00 | − 1.00 | 96 | 180 | 10.36 | 0.22 | 11.32 | 8.11 |
| 8 | 1.00 | 1.00 | 1.00 | 144 | 180 | 10.36 | 0.22 | 11.61 | 7.76 |
| 9 | − 1.68 | 0.00 | 0.00 | 80 | 150 | 6.50 | 0.15 | 10.15 | 8.90 |
| 10 | 1.68 | 0.00 | 0.00 | 160 | 150 | 6.50 | 0.13 | 9.59 | 10.63 |
| 11 | 0.00 | − 1.68 | 0.00 | 120 | 100 | 6.50 | 0.16 | 8.53 | 10.22 |
| 12 | 0.00 | 1.68 | 0.00 | 120 | 200 | 6.50 | 0.16 | 9.81 | 9.94 |
| 13 | 0.00 | 0.00 | − 1.68 | 120 | 150 | 0.00 | 0.01 | 7.79 | 14.38 |
| 14 | 0.00 | 0.00 | 1.68 | 120 | 150 | 13.00 | 0.24 | 12.78 | 7.09 |
| 15 | 0.00 | 0.00 | 0.00 | 120 | 150 | 6.50 | 0.16 | 10.06 | 13.92 |
| 16 | 0.00 | 0.00 | 0.00 | 120 | 150 | 6.50 | 0.16 | 9.93 | 10.95 |
| 17 | 0.00 | 0.00 | 0.00 | 120 | 150 | 6.50 | 0.15 | 11.91 | 12.68 |
| 18 | 0.00 | 0.00 | 0.00 | 120 | 150 | 6.50 | 0.15 | 11.40 | 12.92 |
| 19 | 0.00 | 0.00 | 0.00 | 120 | 150 | 6.50 | 0.16 | 11.30 | 12.79 |
| 20 | 0.00 | 0.00 | 0.00 | 120 | 150 | 6.50 | 0.15 | 10.83 | 13.08 |
BT Barrel Temperature, SS Screw Speed, RC Reactant Concentration, DS Degree of Substitution, WAI Water Absorption Index and WSI Water Solubility Index
Table 2.
Experimental design and results of the response variables to obtain different combinations of BT, SS and RC (succinic anhydride) for the preparation of MS by succinylation using EP
| Treatment | Independent variables | DS | WAI (g/g) | WSI (%) | |||||
|---|---|---|---|---|---|---|---|---|---|
| Codified | Decodified | ||||||||
| X1 | X2 | X3 | BT (°C) | SS (rpm) | RC (%) | ||||
| 1 | − 1.00 | − 1.00 | − 1.00 | 96 | 120 | 0.61 | 0.034 | 7.92 | 13.52 |
| 2 | 1.00 | 1.00 | 1.00 | 144 | 120 | 0.61 | 0.039 | 8.39 | 14.37 |
| 3 | − 1.00 | − 1.00 | − 1.00 | 96 | 180 | 0.61 | 0.026 | 8.34 | 12.66 |
| 4 | 1.00 | 1.00 | 1.00 | 144 | 180 | 0.61 | 0.022 | 8.45 | 13.54 |
| 5 | − 1.00 | − 1.00 | − 1.00 | 96 | 120 | 2.39 | 0.071 | 7.18 | 9.19 |
| 6 | 1.00 | 1.00 | 1.00 | 144 | 120 | 2.39 | 0.070 | 7.48 | 9.23 |
| 7 | − 1.00 | − 1.00 | − 1.00 | 96 | 180 | 2.39 | 0.064 | 6.89 | 9.82 |
| 8 | 1.00 | 1.00 | 1.00 | 144 | 180 | 2.39 | 0.078 | 6.33 | 9.02 |
| 9 | − 1.68 | 0.00 | 0.00 | 80 | 150 | 1.50 | 0.059 | 4.34 | 11.86 |
| 10 | 1.68 | 0.00 | 0.00 | 160 | 150 | 1.50 | 0.062 | 4.45 | 16.92 |
| 11 | 0.00 | − 1.68 | 0.00 | 120 | 100 | 1.50 | 0.042 | 9.31 | 11.23 |
| 12 | 0.00 | 1.68 | 0.00 | 120 | 200 | 1.50 | 0.049 | 9.59 | 11.50 |
| 13 | 0.00 | 0.00 | − 1.68 | 120 | 150 | 0.00 | 0.011 | 7.79 | 14.38 |
| 14 | 0.00 | 0.00 | 1.68 | 120 | 150 | 3.00 | 0.080 | 7.13 | 8.90 |
| 15 | 0.00 | 0.00 | 0.00 | 120 | 150 | 1.50 | 0.048 | 8.43 | 16.08 |
| 16 | 0.00 | 0.00 | 0.00 | 120 | 150 | 1.50 | 0.048 | 7.92 | 14.12 |
| 17 | 0.00 | 0.00 | 0.00 | 120 | 150 | 1.50 | 0.049 | 7.52 | 14.79 |
| 18 | 0.00 | 0.00 | 0.00 | 120 | 150 | 1.50 | 0.053 | 7.39 | 14.65 |
| 19 | 0.00 | 0.00 | 0.00 | 120 | 150 | 1.50 | 0.047 | 7.21 | 14.36 |
| 20 | 0.00 | 0.00 | 0.00 | 120 | 150 | 1.50 | 0.048 | 7.93 | 14.00 |
BT Barrel Temperature, SS Screw Speed, RC Reactant Concentration, DS Degree of Substitution, WAI Water Absorption Index and WSI Water Solubility Index
Degree of substitution
Acetylated starches
The DS was determined according to the methodology proposed by Jeon et al. (1999). For this purpose, 1 g of the starch sample was dissolved in 10 mL of dimethyl sulphoxide (DMSO) by heating (70 °C, 10 min). After cooling, five or six drops of phenolphthalein were added. This solution was titrated with NaOH 0.05 M until obtain a pink color. The DS was obtained using the Eq. 1 described by Song et al. (2006).
| 1 |
where A is the volume of NaOH solution (mL), M is the concentration of NaOH solution and W is the dry weight (g) of the acetylated starch. The molecular weights of acetic anhydride (102 g/mol) and anhydroglucose (162 g/mol) are represented in Eq. 1. Three repetitions were made for every assay and the average value was reported.
Succinylated starch
The DS was determined using the methodology described by Jeon et al. (1999) and calculated employing the Eq. 1 with the molecular weight of succinic anhydride (100 g/mol) instead of acetic anhydride molecular weight.
Water absorption index (WAI) and water solubility index (WSI)
The WSI and WAI of the MS were determined following the methodology reported by Anderson et al. (1969). 2.5 g of MS sample was mixed in 30 mL of water in a 50 mL centrifuge tube. Subsequently, the mixture was centrifuged at 3000×g for 15 min. Then, the supernatant was decanted in a petri dish and the residue was weighted after drying it for 12 h at 105 °C. WSI was determined as the amount of solids in the dried supernatant regarding to the total dried solids in the original sample. WAI was calculated by the ratio of g of the absorbed water in the sediment after centrifugation and g of dry solids. Three replicates per treatment were made and the mean value was reported.
Experimental design
A central composite rotable model with α of 1.6817 and three numerical factors: Barrel Temperature (BT, 80–160 °C), Screw speed (SS, 100–200 rpm) and Reactant Concentration [(RC, acetic anhydride, 0–13% and succinic anhydride, 0–3%)], was used. The factorial design included 20 experiments. All assays were randomly performed (Tables 1, 2). The experimental behavior was predicted using a second order polynomial (Eq. 2):
| 2 |
where yi = experimental predicted response variable; b1…12 = regression coefficients; X1 = Barrel Temperature (BT), X2 = Screw Speed (SS) and X3 = Reactants Concentration (RC). The data were analyzed and adjusted to a regression model of second order, and the coefficients of regression were obtained. The response surface graphs were obtained with the RSM Design Expert ® Software Version 7 (Stat-Ease, Inc., Minn., USA). The significance of the models for each response was tested using variance analysis (ANOVA) (P value and F value at 95% confidence level). To relate each response with BT, SS, and RC, following response surface model with linear, quadratic, and interactions terms was used. Only the terms with significant effects (P < 0.05) were used in the fitted model. The regression coefficients were expressed as coded variables.
Optimization
The optimization process was carried out using the numerical method by means of the Design-Expert software (Stat-Ease, Inc., Minneapolis, MN, USA). The response variables used to optimize were DS, WAI and WSI. The aim of the optimization process was to find the better processing conditions (BT and SS) and RC to obtain modified starches with a safe-for-food levels of DS (≤ 0.2 and ≤ 0.05 for acetylated and succinylated starches) and low affinity to water (lowest WSI and WAI values) that can be employed as raw material for the fabrication of biodegradable products resistant to water. This data was utilized for assessing the desirability function, which is one of the most extensively used method for process optimization with multiple responses in the food industry, changing the desirability from 0 (lowest) to 1 (highest). The experimental values were compared with predicted values to validate the obtained model.
Microstructural characterization
Once the optimum treatment of each modified starch (acetylated and succinylated) was obtained, they were characterized according to their microstructural properties (XRD, SEM and FT-IR) to determine the structural change caused in the MS during EP and verify the chemical modification. The obtained results were compared with those of native starch.
X-ray diffraction
Samples at particle size of less than 200 μm were packed into a glass holder with a depth of 0.5 mm and placed on an X-ray diffractometer (Rigaku Model Last D/Max-2100, Rigaku Denki Co. Ltd., Japan). With a sweep angle of Bragg of 5°–50° over a scale of 2θ with intervals of 0.02, operating at 16 mA and 30 kV, with CuKα radiation and a wavelength λ = 1.5406 Å, the diffractograms were obtained. The percentage of relative crystallinity was calculated using the Herman’s method, as reported by Gomez et al. (1989) as crystalline area/total area × 100 (Aguilar-Palazuelos et al. 2007). Origin software 6.1 (OriginLab, Northampton, MA, USA) was used to analyze the spectra and determine the degree of crystallinity.
Scanning electron microscopy (SEM)
SEM study was carried out according to the method reported by Rodríguez-Castellanos et al. (2015). A Scanning Electron Microscope (Philips®, Model XL30 ESEM, Eindhoven, Holland) was employed, using a secondary electron detector with 10–15 kV of acceleration. The microphotographs were obtained by ESEM XL-30 software.
Infrared spectroscopy analysis (FT-IR)
The FT-IR patterns were registered using infrared spectroscopy (Perkin Elmer, Spectrum GX), following the methodology of Sandler et al. (1998). Infrared spectra of 4000–300 cm−1 were obtained. The diffuse reflectance angles were set at 5° and scans of 32° were acquired for each picture at a resolution of 4 cm−1.
Results and discussion
Acetylated starches
Degree of substitution (DS)
Table 1 appears the results of DS for the acetylated starches. DS showed a significant model of regression with values of , coefficient of variation (CV) = 4.21%, and P of F < 0.01, and did not show lack-of-fit. RC in its linear (P < 0.01) and quadratic (P = 0.01) terms was the factor that had the most effect on DS. BT and SS had not significant effect (P > 0.05) in their linear and quadratic terms. Therefore, only the terms with significant effects (P < 0.01) were maintained in the fitted model. The coefficients of the prediction model obtained for the variable DS are presented in the Eq. 3:
| 3 |
The behavior in relation to the factors BT and RC at 150 rpm of SS is shown in Fig. 1a. It was observed that by increasing RC from 0 to 13%, DS increased throughout the studied BT range (80–160 °C). This behavior could be due to that the esterification process in the elaboration of MS includes the making of new bonds. The BT and SS facilitate an effective collision between the RC, and the starch resulting in favorable conditions of speed, power, and strength to break the bonds between the starch molecules and allow the making of new bonds with the reagent (Lawal 2004). Similar behaviors have been detailed by some researchers. Han et al. (2013) mentioned that mixing starches with acetic anhydride under high temperature conditions, cause the crystalline regions to change into amorphous regions, contributing this to the contact between the acetyl groups of the reactant and the molecules of the starch, causing an increase of the DS. Singh et al. (2004) reported that the acetyl content (%) increased progressively, up to 10% amount of addition of acetic anhydride, in corn starch. This behavior has happened due to the input of acetyl groups in the starch molecule. Likewise, Colussi et al. (2015) evaluated the effect of the acetic anhydride concentration on the DS of acetylated rice starch utilizing diverse amounts of acetic anhydride (5, 10 and 20 g/100 starch dry basis), and reported that acetylated starches with the highest RC (20 g/100 g) presented the highest DS.
Fig. 1.

Effect of RC and BT on the response variables to a SS of 150 rpm. Acetylated starch: Degree of Substitution (a); Water Absorption Index (b); Water Solubility Index (c). Succinylated Starch: Degree of Substitution (d); Water Absorption Index (e); Water Solubility Index (f)
Water absorption index (WAI)
Table 1 shows the WAI of MS. The statistical analysis of the WAI data for the acetylated starches showed a significant regression model with , CV = 5.63%, and P of F < 0.01, and did not show lack-of-fit. RC was significant in the linear terms (P < 0.01). The quadratic terms of BT (P = 0.02) and SS (P < 0.01) had significant effect. The Eq. (4) shows the mathematical model used for this response:
| 4 |
Figure 1b shows the WAI of acetylated starches. It is observed that the WAI values were increased with the increase of the RC (from 0 to 13%) and BT (80 to 120 °C). This behavior could be due to the introduction of acetyl groups into the starch molecule that prevented the inter-chain association in the starch and enhance the access of water to the amorphous area, increasing thus, the WAI of the starch granule (Diop et al. 2011; Xu et al. 2005). Regarding the behavior of the BT effect on the WAI, the EP increased of WAI of the starch, this could be owing to the starch granules being disrupted by the thermal effect. Therefore, the fragmented starch granules presented more available hydroxyl groups that could retain water molecules by hydrogen bonds thus increasing the WAI (Sarifudin and Assiry 2014). Olu-Owolabi et al. (2014) reported enhanced swelling power for acetylated acha starch at increased temperature, due to the debilitation of the intra-granular binding forces inside the starch granule, which offered less restriction to swelling of the MS.
Water solubility index (WSI)
The statistical analysis of the WSI data for the acetylated starches showed a significant regression model with , CV = 7.02%, and P of F < 0.01, and did not show lack-of-fit. The RC in its quadratic (P < 0.01) and linear (P < 0.01) terms was significant for WSI.
The BT and SS in their quadratic terms (P < 0.01) had a significant effect on this response. The following Eq. (5) shows the mathematical model for WSI response:
| 5 |
The changes in WSI of acetylated starch are illustrated in Fig. 1c. It can be seen that as the BT increased (until 130 °C), the WSI values increased. This could be due to the severe conditions of the EP which can lead to an extensive dextrinization of the starch by the effect of the shearing and thermal conditions, resulting in an increased formation of water-soluble products (Fakhouri et al. 2013). On the other hand, it was also observed that as the RC was increased (0 to 13%), the WSI of the acetylated starch values decreased (Fig. 1c). The increase in RC led not only to an increase in acetyl groups but also to a decrease in O–H groups, resulting in a lower WSI as a consequence of the reduced movement of water into the starch molecules that became less-hydrophilic and more-hydrophobic (Diop et al. 2011). This behavior is in agreement with Xu et al. (2004) who considered that starch becomes resistant to water after acetylation (the higher the DS, the greater the hydrophobicity), as a consequence of the reduced possibility of forming hydrogen bonding between the O–H groups of starch and water. Shogren and Biswas (2006) as well reported a decrease in the solubility of starch in water due to an increase in DS. This behavior was attributed to the increase in hydrophobicity as a result of the incorporation of acetyl groups (acetylation) in the starch molecules.
Succinylated starch
Degree of substitution (DS)
Table 2 shows the DS values for the starches modified by succinylation. DS showed a significant model of regression with values of , CV = 6.43%, and P of F < 0.01, and did not show lack-of-fit. The linear terms of the RC (P < 0.05) and BT, and the quadratic term of the BT (P < 0.05) significantly influenced the DS of MS by succinylation using EP. The SS was not significant in any terms (P > 0.05). The Eq. (6) shows the final model for DS:
| 6 |
Figure 1d shows the behavior of the DS regarding BT and RC at a SS of 150 rpm. It is shown that the higher the RC, the higher the DS, obtaining the maximum DS when a BT of 120 °C was used. Similar behaviors have been reported by several researchers. Arueya and Oyewale (2015) reported that there was a general augment in the succinyl groups and DS when RC was increasingly added from 3 to 14% to native acha starch. The augment in the DS value might be owing to the processes of diffusion and retention of the reactants which could have enhanced the interactions between the esterifying agents and the starch. Concerning the effect of BT on DS, Tian et al. (2015) worked with corn-starch modified with dodecenyl succinic anhydride (DDSA) and mentioned that when BT was increased (up to 120 °C), DS also increased. This is because the starch quickly achieved a molten state that favored the expansion and rupture of starch granules, thus improving reactant interaction. As a result, starch granules were easily penetrated by water and anhydride molecules and improved the esterification rate. Likewise, they reported that when SS and shear force were increased, the DS increased also.
Water absorption index (WAI)
The statistical analysis of the WAI data for the succinylated starch showed a significant regression model with , CV = 6.12%, P of F < 0.01. The lack of fit of the regression model was not significant (P > 0.05). Both the linear term of RC and the quadratic term of BT were significant in this response variable (P < 0.01). The SS*RC (X2*X3) interaction term (P < 0.05) was significant. While SS had no significant effect on the linear and quadratic terms (P > 0.05). The prediction model obtained for WAI variable is presented in the Eq. (7):
| 7 |
Figure 1e shows the surface graph of the WAI of the succinylated starch. It was observed that the WAI increased in proportion to the BT (up to 130 °C); however, above 130 °C of BT, the WAI values began to decrease. The increase in BT promotes internal mixing and uniform heating, which enhances the gelatinization of starch and thus WAI increases. On the other hand, excessive BT significantly decreases the WAI which can be explained by prevalence of dextrinization over gelatinization (Gulati et al. 2016). Olayinka et al. (2011) mentioned that as the temperature of the medium increases, starch molecules become more thermodynamically activated, and the resultant augment in granular mobility improves diffusion of water which encourages swelling. On the other hand, it was observed that when the RC was increased (0 to 3%), the values of the WAI decreased (Fig. 1e). Regarding this behavior obtained, Viswanathan (1999) confirmed that the inclusion of succinyl groups on the molecules of starch reduced hydrophobicity. Likewise, Arueya and Oyewale (2015) reported that there was a decrease in swelling power of succinylated starches compared to the native acha starch, indicating higher molecular re-organization within the granules.
Water solubility index (WSI)
The WSI of the succinylated starch was influenced significantly by the linear terms of RC and BT and quadratic term of BT (P < 0.01). The WSI model showed values of , CV = 8.27%, and P of F < 0.01, and did not show lack-of-fit. The Eq. (8) shows the mathematical model for WSI.
| 8 |
Figure 1f shows that WSI values of succinylated starch increased in proportion of the BT (80–160 °C), while decreased with the increase of RC (0 to 3%). This is due to increased shearing of starch under severe operating conditions. WSI is a suitable indicator of starch change as well as the intensity of extrusion process conditions. Native starches do not absorb water, whereas extruded starches absorb water rapidly and form the gel. Olayinka et al. (2011) reported that as BT increased, high WSI values were observed due to the disruption by heating of the amylose chains whose derived fragments were leached and contributed to a greater solubility. Altan et al. (2008), reported that the higher the EP temperature, the greater the starch solubility due to an increase in the gelatinized starch and the soluble solids, accordingly. During the EP, the dough is subjected to temperatures and shearing forces high enough to break the hydrogen bonds of their crystalline regions as well as the covalent and non-covalent bonds of the starch molecules, thereby releasing water-soluble fragments. Murúa-Pagola et al. (2009) similarly reported an increased solubility in water of those starches succinylated by EP under conditions that caused an extensive dextrinization of biopolymers. Regarding the behavior of RC on WSI, Viswanathan (1999) mentioned that the starch succinylation could have conferred a certain hydrophobicity to the regularly hydrophilic starch chains. Also, Olu-Owolabi et al. (2014) showed that chemical modifications by succinylation reduced the solubility of native acha starch due to addition of succinyl groups.
Numerical optimization
According to the optimization for acetylation, the best process conditions were: BT = 80 °C and SS = 100 rpm and RC = 7.88%, with a global desirability value = 0.99. With these conditions the following values predicted by each of the corresponding mathematical models were obtained: DS = 0.2 ± 0.004, WAI = 7.67 ± 0.58 g/g and WSI = 6.15 ± 0.82%. The best processing conditions for succinylation design were: BT = 80 °C, SS = 126 rpm, and RC = 1.12%. A global desirability value = 1.00 was obtained. The above global desirability value corresponds to the conditions: DS = 0.05 ± 0.004, WAI = 3.40 ± 0.44 g/g and WSI = 7.92 ± 1.78%. Three experimental assays were carried out with the optimal conditions and, DS, WAI and WSI were evaluated. The following average values were obtained for the acetylation optimum treatment: DS = 0.2 ± 0.006, WAI = 8.37 ± 0.58 g/g and WSI = 6.4% ± 0.4. The following values were obtained from the optimal treatment of succinylated starches: DS = 0.05 ± 0.003, WAI = 4.0 ± 0.9 g/g and WSI = 7.4% ± 0.8. By comparing the experimental values with the predicted values by the mathematical models, there were no significant differences observed among them obtained (P < 0.05). Therefore, the model experimentally used demonstrated a good fit to find the best processing conditions of BT, SS and RC to obtain MS by acetylation and succinylation with safe-for-food-use DS and low affinity to water.
Microstructural characterization
X-ray diffraction (XRD)
XRD is a method utilized to examine the crystallinity of starch. XRD has been used to study the effect of EP on modified starch crystallinity. The results of the XRD analysis for native, acetylated, and succinylated corn starches are presented in Fig. 2. The XRD patterns of the native corn starch showed an A-type crystallinity pattern, characteristic of cereal starch, with values 2θ of ≈ 18.5° and ≈ 24°. These results are similar to those obtained by Fitch-Vargas et al. (2016) who reported values 2θ of ≈ 18.5° and ≈ 23.2° for corn starch. For the MS (acetylated and succinylated), the patterns of X-ray diffraction were completely changed, showing lower intensity than the native starch, with values of 2θ of ≈ 13.5° and ≈ 19°. The MS showed a combination of Type A and Type V crystallinity patterns, indicating that MS were not completely degraded. The association of the amylose chains with the acetyl groups or succinyl groups can result in these structures (Diop et al. 2011). Bajaj et al. (2019) reported that an increased in the degree of esterification could lead changes in morphology, composition and structure of starch.
Fig. 2.
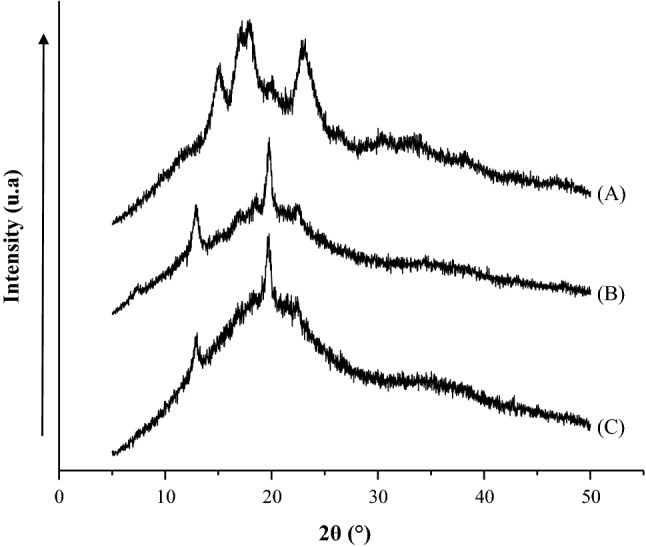
Change in X-ray diffraction patterns of native starch (a) and MS by acetylation (b) and succinylation (c) using the EP
An important loss of crystallinity was detected compared with the native starch and MS after the esterification by the EP. The relative crystallinity was 16.14 ± 1.4% for native starch and decreased to 6.09 ± 0.9% and 3.83 ± 0.4% for acetylated and succinylated starches, respectively. This indicated that, with the chemical modification, the native starch crystalline structure was destroyed. Zhang et al. (2009) reported that acetic acid had an influence on the crystalline structure of the modified yellow ginger starch due to the replacement of a number of hydroxyl groups on starch by the acetyl groups, lessening the arrangement of inter and intramolecular hydrogen bonds. On the other hand, the EP had effect in the starch crystallinity loss; causing a partial fragmentation and gelatinization of the starch granules, contributing to the formation of amorphous regions. According to Singh et al. (1998), the extrusion destroys the crystal structure of starch, either partially or completely, depending on the amylose/amylopectin ratio and process conditions such as shear strength, temperature and moisture.
Scanning electron microscopy (SEM)
SEM was used to identify structural changes occasioned by chemical modification and, the substituted regions in the starch granules. Figure 3 shows the granular morphology of native, acetylated and succinylated starches. It was observed that the gelatinization, fracture and plasticization were the principal changes in MS. The native corn starch granules had spherical and polygonal shapes and diameters ranging between 5 and 25 μm (Fig. 3a), which is in agreement with the results reported by Fitch-Vargas et al. (2016). Figure 3b, c show the microphotographs of the MS by acetylation and succinylation (optimal treatments), respectively. It can be seen that starch granules were partially fragmented and plasticized. In addition, certain channels and perforations were observed on the surface. These morphological changes could be ascribed to the fusion of granules derived from starch disruption as a result of chemical modification during the EP. Aguilar-Palazuelos et al. (2007) observed that a fragmentation of the granular structure took place, in addition to a partial plasticization during the preparation by EP of pellets composed of corn starch, fiber and glycerol. Diop et al. (2011) reported that, after starch acetylation, the morphology of the granule surface was completely changed due to an augmented molecular conglomerations and porosity, in comparison to the native starch. Song et al. (2006) reported that the succinylation caused some changes in the structure of starch granules (porous and with many cavities) as compared with those of native starch. This may because the reagent attacked the surface and formed pores. Bajaj et al. (2019) reported that the SEM of modified starches with octenyl succinic anhydride (OSA) showed structural level changes (surface and edges were lost with presence of superficial pores). Likewise, MS showed pronounced surface depression for all starches, particularly in starches with a higher DS value (DS with 0.06).
Fig. 3.
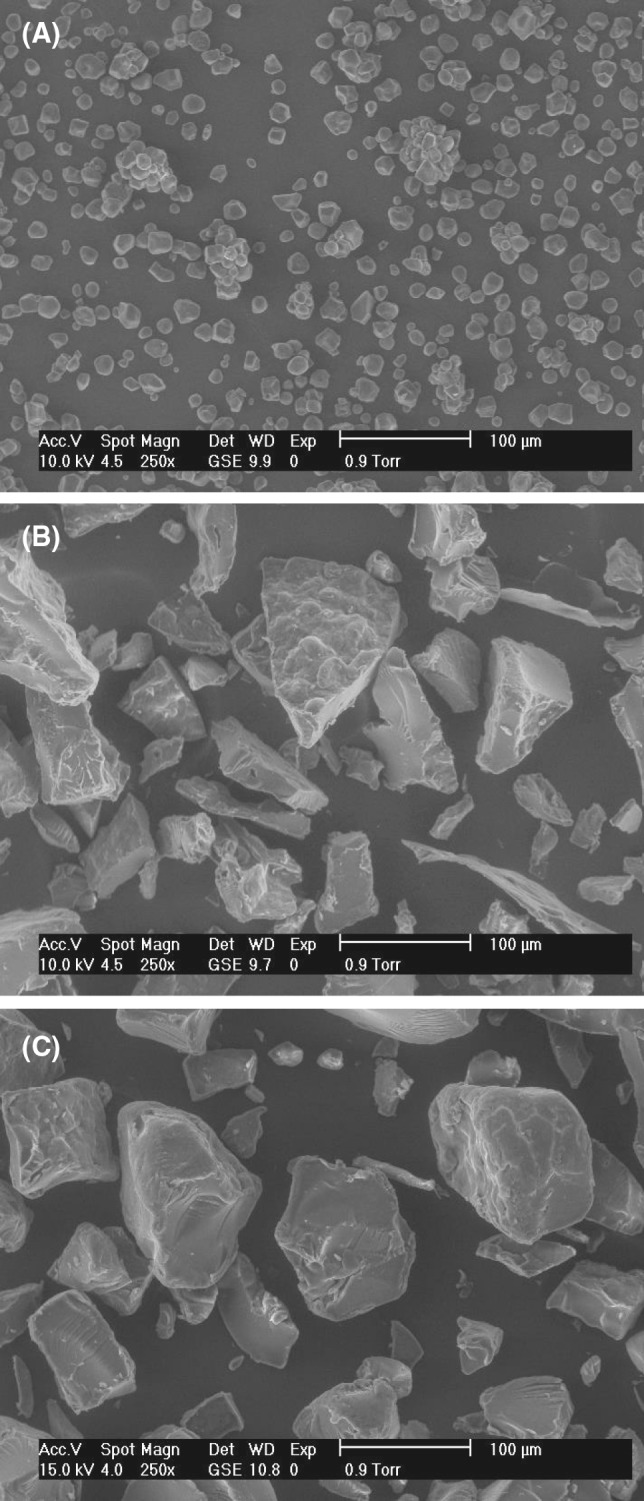
Scanning electron micrographs of: native corn starch (a), acetylated starch (b) and succinylated starch (c)
Infrared spectroscopy analysis (FT-IR)
FT-IR spectroscopy confirmed structural modifications of starch molecules as a result of the acetylation and succinylation processes. Figure 4 shows the FT-IR spectra for native, acetylated and succinylated starches. The peaks at 1000 and 1350 cm−1 are for native starch and correspond to the C–O bond stretching in the FT-IR spectrum. Other characteristic bonds of absorption were those water-related observed at approximately 1660 cm−1 and a band related to the O–H group vibration at approximately 3180 cm−1 and that related to the C–H vibration stretch at around 2100 cm−1. After the chemical modifications starch (acetylation or succinylation), the intensity of the peaks was reduced, possibly due to the breaking of the bonding by effect of the EP variables (Aguilar-Palazuelos et al. 2007). Nevertheless, new absorption bands appeared at 1715 cm−1 and 1150 cm−1, which were assigned to the carbonyl C=O and carbonyl C–O stretch vibration, respectively (Diop et al. 2011). On the other hand, FT-IR spectra of the acetylated and succinylated starches presented peaks with values of approximately at 3240–3640 cm−1, which are related to the O–H groups of water and carbohydrates (Mendes et al. 2016).
Fig. 4.
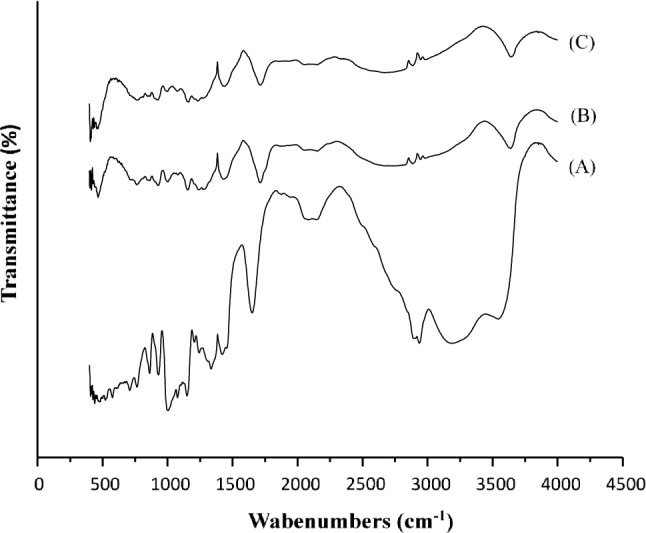
FT-IR spectra of native corn starch (a), acetylated starch (b) and succinylated starch (c)
Conclusion
The mathematical models used to analyze the data from the DS, WAI and WSI of the MS were satisfactory, with adjusted values > 0.83, CV < 8.27% and P < 0.01. The mathematical models showed a good fit to find the best conditions of BT, SS and RC to obtain MS by acetylation or succinylation using EP with the safe-for-food-use levels of DS (0.2 and 0.05, respectively) and low affinity to water (the lowest values of WSI and WAI). The best conditions to obtain acetylated starches were RC = 7.88%, BT = 80 °C and SS = 100 rpm. The optimum conditions to obtain succinylated starches were RC = 1.12%, BT = 80 °C and SS = 126 rpm. The microstructural analysis confirmed the chemical modification of corn starch using the EP.
Footnotes
Publisher's Note
Springer Nature remains neutral with regard to jurisdictional claims in published maps and institutional affiliations.
References
- Abiddin NF, Yusoff A, Ahmad N. Optimization of reaction conditions of octenyl succinic anhydride (OSA) modified sago starch using response surface methodology (RSM) Int Food Res J. 2015;22(3):930–935. [Google Scholar]
- Aguilar-Palazuelos E, Martínez-Bustos F, Jiménez-Arévalo O, Galicia-García T, Delgado-Rangel J. Potentiality of some natural fibers and native starch for making biodegradable materials. In: Klening TP, editor. Food engineering research developments. New York: Nova Science Publishers Inc; 2007. pp. 279–294. [Google Scholar]
- Altan A, McCarthy KL, Maskan M. Evaluation of snack foods from barley tomato pomace blends. J Food Eng. 2008;84:231–242. doi: 10.1016/j.jfoodeng.2007.05.014. [DOI] [Google Scholar]
- Anderson RA, Conway HF, Pfeife FF, Griffin EL., Jr Gelatinization of corn grits by roll-and extrusion-cooking. Cereal Sci Today. 1969;14(4–7):11–12. [Google Scholar]
- Arueya GL, Oyewale TM. Effect of varying degrees of succinylation on the functional and morphological properties of starch from acha (Digitaria exilis Kippis Stapf) Food Chem. 2015;177:258–266. doi: 10.1016/j.foodchem.2015.01.019. [DOI] [PubMed] [Google Scholar]
- Babaee M, Jonoobi M, Hamzeh Y, Ashori A. Biodegradability and mechanical properties of reinforced starch nanocomposites using cellulose nanofibers. Carbohyd Polym. 2015;132:1–8. doi: 10.1016/j.carbpol.2015.06.043. [DOI] [PubMed] [Google Scholar]
- Bajaj R, Singh N, Kaur A. Properties of octenyl succinic anhydride (OSA) modified starches and their application in low fat mayonnaise. Int J Biol Macromol. 2019 doi: 10.1016/j.ijbiomac.2019.03.054. [DOI] [PubMed] [Google Scholar]
- Colussi R, El Halal SLM, Pinto VZ, Bartz J, Gutkoski LC, da Rosa Zavareze E, Dias ARG. Acetylation of rice starch in an aqueous medium for use in food. LWT-Food Sci Technol. 2015;62(2):1076–1082. doi: 10.1016/j.lwt.2015.01.053. [DOI] [Google Scholar]
- Diop CIK, Li HL, Xie BJ, Shi J. Effects of acetic acid/acetic anhydride ratios on the properties of corn starch acetates. Food Chem. 2011;126(4):1662–1669. doi: 10.1016/j.foodchem.2010.12.050. [DOI] [PubMed] [Google Scholar]
- Fakhouri FM, Costa D, Yamashita F, Martelli SM, Rodolfo C, Alganer K, Collares-Queiroz FP, Innocentini-Mei LH. Comparative study of processing methods for starch/gelatin films. Carbohydr Polym. 2013;95:681–689. doi: 10.1016/j.carbpol.2013.03.027. [DOI] [PubMed] [Google Scholar]
- Fitch-Vargas PR, Aguilar-Palazuelos E, Jesús Zazueta-Morales J, Vega-García MO, Valdez-Morales JE, Martínez-Bustos F, Jacobo-Valenzuela N. Physicochemical and microstructural characterization of corn starch edible films obtained by a combination of extrusion technology and casting technique. J Food Sci. 2016;81(9):E2224–E2232. doi: 10.1111/1750-3841.13416. [DOI] [PubMed] [Google Scholar]
- Gomez M, McDonough C, Rooney L, Waniska R. Changes in corn and sorghum during nixtamalization and tortilla baking. J Food Sci. 1989;54(2):330–336. doi: 10.1111/j.1365-2621.1989.tb03074.x. [DOI] [Google Scholar]
- González-Seligra P, Guz L, Ochoa-Yepes O, Goyanes S, Famá L. Influence of extrusion process conditions on starch film morphology. LWT-Food Sci Technol. 2017;84:520–528. doi: 10.1016/j.lwt.2017.06.027. [DOI] [Google Scholar]
- Gulati P, Weier SA, Santra D, Subbiah J, Rose DJ. Effects of feed moisture and extruder screw speed and temperature on physical characteristics and antioxidant activity of extruded proso millet (Panicum miliaceum) flour. Int J Food Sci Technol. 2016;51(1):114–122. doi: 10.1111/ijfs.12974. [DOI] [Google Scholar]
- Han F, Gao C, Liu M, Huang F, Zhang B. Synthesis, optimization and characterization of acetylated corn starch with the high degree of substitution. Int J Biol Macromol. 2013;59:372–376. doi: 10.1016/j.ijbiomac.2013.04.080. [DOI] [PubMed] [Google Scholar]
- Jeon YS, Viswanathan A, Gross RA. Studies of starch esterification: reaction with alkenyl-succinates in aqueous slurry system. Starch-Stärke. 1999;51:90–93. doi: 10.1002/(SICI)1521-379X(199903)51:2<90::AID-STAR90>3.0.CO;2-M. [DOI] [Google Scholar]
- Lawal OS. Succinyl and acetyl starch derivatives of a hybrid maize: physicochemical characteristics and retrogradation properties monitored by differential scanning calorimetry. Carbohyd Res. 2004;339(16):2673–2682. doi: 10.1016/j.carres.2004.08.015. [DOI] [PubMed] [Google Scholar]
- Luchese CL, Spada JC, Tessaro IC. Starch content affects physicochemical properties of corn and cassava starch-based films. Ind Crops Prod. 2017;109:619–626. doi: 10.1016/j.indcrop.2017.09.020. [DOI] [Google Scholar]
- Mendes JF, Paschoalin RT, Carmona VB, Neto ARS, Marques ACP, Marconcini JM, Oliveira JE. Biodegradable polymer blends based on corn starch and thermoplastic chitosan processed by extrusion. Carbohyd Polym. 2016;137:452–458. doi: 10.1016/j.carbpol.2015.10.093. [DOI] [PubMed] [Google Scholar]
- Murúa-Pagola B, Beristain-Guevara CI, Martinez-Bustos F. Preparation of starch derivatives using reactive extrusion and evaluation of modified starches as shell materials for encapsulation of flavoring agents by spray drying. J Food Eng. 2009;91(3):380–386. doi: 10.1016/j.jfoodeng.2008.09.035. [DOI] [Google Scholar]
- Olayinka OO, Olu-Owolabi BI, Adebowale KO. Effect of succinylation on the physicochemical, rheological, thermal and retrogradation properties of red and white sorghum starches. Food Hydrocoll. 2011;25(3):515–520. doi: 10.1016/j.foodhyd.2010.08.002. [DOI] [Google Scholar]
- Olu-Owolabi BI, Olayinka OO, Adegbemile AA, Adebowale KO. Comparison of functional properties between native and chemically modified starches from acha (Digitaria stapf) grains. Food Nutr Sci. 2014;5(02):222. [Google Scholar]
- Rodríguez-Castellanos W, Rodriguez D, Martínez-Bustos F, Jiménez-Arévalo O, Stevanovic T. Production and characterization of gelatin-starch polymer matrix reinforced with cellulose fibers. Polym Renew Resour. 2015;6(3):105–118. [Google Scholar]
- Sandler SR, Karo W, Bonestel JA, Pearce EM. Polymer synthesis and characterization. A laboratory manual. New York: Academic Press; 1998. [Google Scholar]
- Sarifudin A, Assiry AM. Some physicochemical properties of dextrin produced by extrusion process. J Saudi Soc Agric Sci. 2014;13(2):100–106. [Google Scholar]
- Shogren RL, Biswas A. Preparation of water soluble and water-swellable starch acetates using microwave heating. Carbohyd Polym. 2006;64:16–21. doi: 10.1016/j.carbpol.2005.10.018. [DOI] [Google Scholar]
- Singh N, Cairns P, Morris V, Smith A. Physical properties of extruded wheat starch additive mixtures. Cereal Chem. 1998;75(3):325–330. doi: 10.1094/CCHEM.1998.75.3.325. [DOI] [Google Scholar]
- Singh N, Chawla D, Singh J. Influence of acetic anhydride on physicochemical, morphological and thermal properties of corn and potato starch. Food Chem. 2004;86(4):601–608. doi: 10.1016/j.foodchem.2003.10.008. [DOI] [Google Scholar]
- Song X, He G, Ruan H, Chen Q. Preparation and properties of octenyl succinic anhydride modified early indica rice starch. Starch-Stärke. 2006;58(2):109–117. doi: 10.1002/star.200500444. [DOI] [PMC free article] [PubMed] [Google Scholar]
- Tian Y, Zhang X, Sun B, Jin Z, Wu S. Starch sodium dodecenyl succinate prepared by one-step extrusion and its properties. Carbohyd Polym. 2015;133:90–93. doi: 10.1016/j.carbpol.2015.06.085. [DOI] [PubMed] [Google Scholar]
- Viswanathan A. Effect of degree of substitution of octenyl succinate starch on the emulsification activity on different oil phases. J Polym Environ. 1999;7(4):191–196. doi: 10.1023/A:1022830715565. [DOI] [Google Scholar]
- Wang DW, Kuo MC, Yang L, Huang CY, Wei W, Huang CM, Yeh JT. Strength retention and moisture resistant properties of citric acid modified thermoplastic starch resins. J Polym Res. 2017;24(12):234. doi: 10.1007/s10965-017-1397-y. [DOI] [Google Scholar]
- Wu X, Liu P, Ren L, Tong J, Zhou J. Optimization of corn starch succinylation using response surface methodology. Starch-Stärke. 2014;66(5–6):508–514. doi: 10.1002/star.201300194. [DOI] [Google Scholar]
- Xu Y, Miladinov V, Hanna MA. Synthesis and characterization of starch acetates with high substitution 1. Cereal Chem. 2004;81(6):735–740. doi: 10.1094/CCHEM.2004.81.6.735. [DOI] [Google Scholar]
- Xu YX, Dzenis Y, Hanna MA. Water solubility, thermal characteristics and biodegradability of extruded starch acetate foams. Ind Crops Prod. 2005;21(3):361–368. doi: 10.1016/j.indcrop.2004.05.004. [DOI] [Google Scholar]
- Zhang LM, Xie WG, Zhao X, Liu Y, Gao W. Study on the morphology, crystalline structure and thermal properties of yellow ginger starch acetates with different degrees of substitution. Thermochim Acta. 2009;495:57–62. doi: 10.1016/j.tca.2009.05.019. [DOI] [Google Scholar]