

Abstract
The reduction of alcohol content in wines has two main objectives, the former is decreasing the wines’ strength and the latter is producing new low alcohol beverages. To accomplish the latter, in this study, we focused on the dealcoholization of a white wine (cv Falanghina, 12.5 vol%) obtained from an ancient Italian grape variety that has recently aroused a renewed interest. It was dealcoholized at various alcohol content levels ranging from 9.8 to 0.3 vol% through the osmotic distillation process, and the main quality parameters of the obtained dealcoholized samples were evaluated. No significant differences (p < 0.05) in total phenols, flavonoids, organic acids and total acidity were observed among the wine samples at different alcohol content levels. On the contrary, the volatile compounds content decreased with increasing alcohol removal. Specifically, almost 50% of higher alcohols with acids and lactones were preserved in dealcoholized wine at 9.8 vol% alcohol content, but this percentage reduced to 30% in the sample at 6.8 vol%, and was even lower in the dealcoholized wine with lower alcohol content. It was argued that the transport of volatile compounds through the membrane, beside the membrane selectivity, is highly correlated with the Henry constant (R2 > 0.8021 for 9.8 vol% of dealcoholized wine). Moreover, results of the sensory evaluation indicated a significant change in terms of acidity, odour, sweetness and body taste in dealcoholized wine (0.3 vol%), giving an overall perceived imbalance and unacceptable taste with respect to the original wine. Therefore, in order to balance acid sensation and enhance body and aftertaste, an attempt was made to formulate an alcohol-free wine-based beverage with enhanced odour and sweetness, by adding some floral wine flavours, up to the amount present in the original wine.
Keywords: Low alcohol content, Wine, Osmotic distillation, Membrane, Dealcoholization, Aroma
Introduction
In recent years, an increase of the alcohol content in wine has been observed, primarily determined by an improvement in wine quality and by climatic condition changes (Catarino and Mendes 2011). A compromise has been noted between wine makers and consumers, about the production and marketing of wines with or without reduced alcohol content, to reduce alcohol consumption. In fact, the Regulation (EC) n. 606/2009 and its amendments (Commission Implementing Regulation (EU) 144/2013) have authorized a slight correction of the alcoholic content up to a 20% maximum reduction of the initial content in wines. This has produced financial benefits for the wine industry and for wines themselves in terms of taxes and the balance of its components, respectively (Motta et al. 2017). Nowadays, there is no definition of sale denominations, and the use of denominations “dealcoholized wine” and “partially dealcoholized wine” depends on the legislation of each state. Since 2012, the OIV (Organisation Internationale de la Vigne et du Vin) has adopted two definitions: “Beverages obtained by wine dealcoholization” for those beverages with an alcohol content lower than 0.5 vol%; and “Beverages obtained by partial wine dealcoholization” for those in the range of 0.5–8.5 vol%, respectively (OIV-ECO 432-2012, OIV-ECO 433-2012 Resolutions).
The production of dealcoholized wines or beverages obtained by wine dealcoholization may represent a valid alternative for limiting alcohol consumption or for introducing new products into the market for people who cannot drink alcohol for various reasons (i.e. religion, diet, at work, etc.) (Liguori et al. 2018a).
The main technological issue when reducing the alcohol content in wines is the removal of ethanol without affecting the other wine components. Because of this, an efficient strategy for producing wine with reduced or low alcohol concentration involves a compromise between ethanol removal, energy demand and potential impact on wine composition and sensory quality (Varela et al. 2015).
Various techniques for limiting ethanol content in wines are available, such as those based on the reduction of the sugar level of the grape in the vineyard, restricting ethanol formation or removing it after fermentation (Varela et al. 2015; Longo et al. 2017; Mangindaan et al. 2018; Catarino and Mendes 2011; Schmidtke et al. 2012). Among these latter, the membrane processes seem to be more promising than thermal ones, because of the low operating temperatures (generally room temperature) and of high selectivity of membrane towards ethanol, which preserves the other volatile compounds in wine (Catarino and Mendes 2011). In addition to wine, various beverages were dealcoholized through membrane processes such as: alcoholic apple cider by reverse osmosis (RO) (López et al. 2002); beer by osmotic distillation (OD) (Liguori et al. 2016, 2018b; De Francesco et al. 2015) and by RO (Catarino et al. 2007). Reverse osmosis was applied to wines, but it resulted not economically sustainable to reach high levels of dealcoholization (< 0.5 vol%), also because it negatively affected odour sensations (Meillon et al. 2009). On the contrary, osmotic distillation (OD) was used for partial and total dealcoholization of wine, and the effects of process conditions on the quality characteristics of the dealcoholized wines were evaluated. In particular, Lisanti et al. (2013), Liguori et al. (2010, 2013a) and Fedrizzi et al. (2014) characterized chemical, physical and sensory profile of dealcoholized red wines, and found that their main quality parameters, at different alcohol contents, do not change with respect to the original ones, except volatile compounds for which a decrease was observed. Moreover, theoretical correlations for the prediction of ethanol and aroma compounds evolution during the osmotic distillation, were also developed (Diban et al. 2013; Liguori et al. 2013b).
On the contrary, only few papers in literature deal with dealcoholization of white wines. Meillon et al. (2010) the sensory profile of partially dealcoholized white wine by RO, whilst King and Hildegarde (2014) investigated the spinning cone column. Fedrizzi et al. (2014) analyzed aroma profile and isotopic composition of white and red wines which had been dealcoholized in pilot- and industrial-scale plants by OD; while Taran et al. (2014) evaluated some chemical properties (i.e. acids, residual sugars, pH) of dealcoholized white and red wines obtained by rotary evaporator.
From the literature review, dealcoholization process appeared to be mainly applied to red wines and only rarely to white wines. Aiming to contribute to filling this gap, the present study investigates the impact of OD on the evolution of oenological parameters and volatile compounds in white wine at different levels of alcohol, up to a content lower than 0.5 vol%. The wine used was a typical young white wine (i.e. cv. Falanghina), which is characterized by intense fruit and balsamic scents, moderately fruity aroma and dry, fresh and slightly acidic taste. Moreover, the loss of volatile compounds and the classes of volatiles that were removed by osmotic distillation were correlated with Henry’s Law constant. Finally, the dealcoholized wine was used for the development of an alcohol-free wine-based beverage.
Materials and methods
Experimental set up and dealcoholization conditions
Falanghina white wine with an alcohol content of 12.5 vol% was used for dealcoholization tests
The study was performed on Falanghina wine dealcoholization. Vitis vinifera L. cv. Falanghina is a white berry grape widely grown in several DOC areas of Campania, as well as in other regions of southern Italy. The wines obtained with this grape are characterized by intense fruit and balsamic scents, moderately fruity aroma and dry, fresh and slightly acidic taste (Moio et al. 2004).
The lab scale plant was equipped with the 1 × 5.5 minimodule (Liqui-cel) (Liguori et al. 2013a). The minimodule was made of a microporous hydrophobic polypropylene membrane, with a 1800 cm2 surface area, 42 μm thickness and 14 cm length, 40% porosity and 0.03 μm membrane pore diameter. The membrane module consisted of 2300 hollow fibers with dimensions of 11.5 cm length, 220 μm inner diameter and 300 μm outer diameter. Inside the module, the hollow fibres were wrapped around a central tube. This geometry allows high compactness, a very large contact area with a minimal volume. The feed (wine) and stripper (distilled water) streams flowed into the module in recycling and counter-current mode. According to our previous studies (Liguori et al. 2013b, 2015b) the wine (0.5 L) with a flow rate of 70 mL/min was fed to the module in the lumen side, while the distilled water (1 L) was fed at 140 mL/min in the tube side. The dealcoholization process was set up in cycles, with the final alcohol content being lower than 0.5 vol%. At the start of each cycle, fresh distilled water was used as stripper. Each cycle lasted 30 min. The dealcoholized wine collected at the end of each cycle was codified as W1–W8 corresponding to the cycle of the dealcoholization process. The process temperature was 10 °C, needed to reduce the volatility and hence the loss of volatile compounds.
Quality analyses
Analytical methods
Alcohol content, pH and total acidity were measured according to the OIV Compendium of International Methods of Analysis of Wine and Musts (2007).
Folin–Ciocalteu assay was used to determine the phenolic compounds concentration in wine samples (Singleton and Rossi 1965; Liguori et al. 2015a; Russo et al. 2013). The absorbance of solutions was read at 765 nm using a UV–vis spectrophotometer (Lambda Bio 40; PerkinElmer, Waltham, MA, USA) after 2 h of incubation in the dark. Gallic acid was used to obtain the calibration curve and the results were expressed as gallic acid equivalents (GAE mg/L).
The colour and flavonols analyses were performed by spectrophotometric measurements at 420 nm and 360 nm respectively, using a 1 cm optical path. In particular, for flavonols content, the samples (0.25 mL), diluted 10-fold by ethanol solution (10 vol%), were vortexed with 0.25 mL of 0.1% HCl (in 95% ethanol) and 4.55 mL of 2% HCl; the absorbance was read after 15 min. The calibration curves were constructed using diluted solutions of quercetin (in 95% ethanol) and results expressed as mg/L (Cliff et al. 2007).
Ion exchange chromatography was used to determine the organic acids content by means of the apparatus (Dionex Corporation, USA) equipped with an ED 50 electrochemical detector, Ionpac AS11 column (250 × 4 mm) and Ionpac AS11 Guard (50 × 4 mm). The wine samples were diluted and filtered through 0.22 μm pore size filters (MF-Millipore, USA). Standards of the organic acids were injected to obtain the retention time for each compound. The analytical procedure was performed applying the chromatographic conditions previously described by Liguori et al. (2013a).
Volatile compounds analysis
The volatile compounds of wine and dealcoholized wine samples were extracted with dichloromethane and ultrasound treatments at 20 °C for 10 min, according to Cocito et al. (1995) (Liguori et al. 2013a). The extraction was performed three times and, after separation, the organic layers were collected and dried on anhydrous sodium sulphate; then concentrated to a final volume of about 100 μl.
The volatile compounds were determined by GC–MS (Trace MS plus, Thermo Finnigan, USA) and by GC–FID (HP 6890, Agilent), both apparatuses equipped with a capillary column (Supelcowax 10; 60 m × 0.25 mm × 0.25 μm, Supelco, USA). The gas chromatographic conditions were in accordance with Liguori et al. (2013a). The volatile compounds were identified by comparison of the mass spectra obtained for each compound with those reported in NIST and Wiley libraries. Relative concentrations of isolated compounds were expressed as the ratio between peak area of the compound and that of the internal standard (2-octanol).
Statistical analysis
Dealcoholization trials and analytical measurements were carried out in triplicate and mean values and standard deviation values were reported. Monofactorial variance analysis was used to determine significant differences (p < 0.05) among Falanghina (control) wine and dealcoholized samples by Analysis Lab software.
Beverage formulation
The alcohol-free wine-based beverage was prepared by adding a must solution (2 vol%) and sodium bicarbonate (0.5 vol%) to the total dealcoholized wine (< 0.5 vol%). These substances were added to give body to the beverage and to reduce the acid and astringent tastes, which were detected during the tasting as defects of the dealcoholized wine. The aroma of alcohol free wine-based beverage was reconstituted by the addition of some floral wine flavours (i.e. 2-phenylethanol, ethyl decanoate and geraniol) up to the amount present in the original wine. Finally, the beverage was stabilized by microbial filtration.
Sensory evaluation
The quality assessment of alcohol-free wine-based beverage was performed by 25 untrained panelists recruited at University of Salerno. People were both Italian and of foreign nationality, alcohol-drinkers and teetotalers. The choice to recruit teetotalers was taken to get an evaluation by possible future consumers of the product. The panelists were asked to evaluate appearance, odour, sweetness, acidity, body, aftertaste, overall acceptability on a 9-point hedonic scale, anchored on the left by “dislike extremely” and on the right by “like extremely”. Beside the wine-based beverage, the panelists also tasted the original wine, and the total dealcoholized wine, with the exception the teetotalers panelists, who tasted only the dealcoholized wine.
Results and discussion
Wine dealcoholization
In wine dealcoholization by OD, the hydrophobic membrane prevents the penetration of aqueous solutions (wine and water) into the pores of membrane and hence, the selective separation mechanism of volatile compounds (mainly ethanol) from the wine depends on the vapor pressure difference between wine and water across the wall of the membrane.
The reduction of alcohol content in Falanghina wine was performed in 8 dealcoholization cycles. Each cycle lasted 30 min. In these conditions, kinetic tests on hydroalcoholic solutions (data not reported) showed that at the end of each cycle the alcohol reduction was about 30% of the initial value.
The alcohol concentrations in the wine samples (W0–W8) and in the strippers during dealcoholization tests were shown in Fig. 1. In W8 sample, the process allowed to obtain an alcohol content of 0.3 vol% starting from an initial alcoholic degree in Falanghina (W0) of 12.5 vol%. The decrease in alcohol content was higher in the first three cycles, where the concentration of alcohol in wine reduced up to 1/3, and lower in the subsequent cycles. Correspondingly, distilled water (stripper) was enriched with ethanol during each cycle, but to a higher extent in the early cycles of the process; subsequently, the amount of alcohol in the stripper decreased as much as the alcoholic concentration in the wine.
Fig. 1.
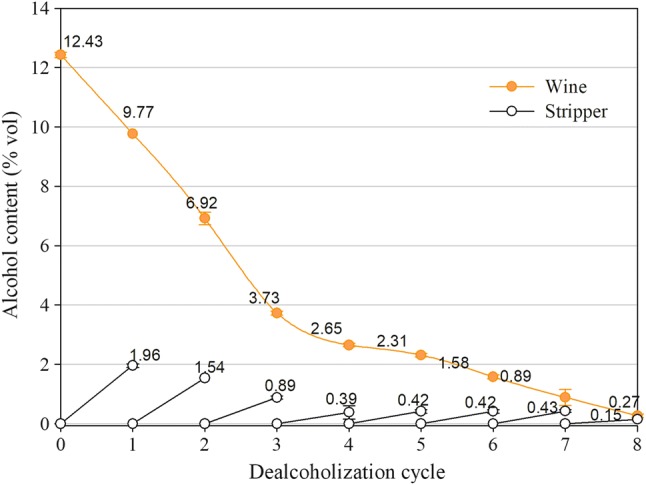
Alcohol content (% vol) in Falanghina wine (W0) and dealcoholized wine samples (W1–W8) and in the stripper at each cycle of dealcoholization process
Effect of dealcoholization on wine’s volatiles
Volatile compounds
A total of 52 compounds (Table 1) were identified in the volatile fraction of Falanghina wine belonging to the following chemical classes: higher alcohols, esters, acids, ketones, lactones, phenols, and sulphur compounds. These compounds have different origins: varietal, pre-, during and post-fermentative. Volatiles identified in wines are primary constituents of fermentation products, which are present in the highest concentration (Lambrechts and Pretorius 2000).
Table 1.
Volatile compounds content (mg/L; mean values ± standard deviation) in Falanghina (W0) and dealcoholized wine samples (W1–W8)
| Ret. time (min) | Higher alcohols | W0 | W1 (− 2.7) | Loss (%) | W2 (− 5.5) | Loss (%) | W3 (− 8.7) | Loss (%) | W4 (− 9.8) | Loss (%) |
|---|---|---|---|---|---|---|---|---|---|---|
| 14.12 | 1-Propanol | 1.38 ± 0.10A | 0.60 ± 0.02B | 56.2 | 0.03 ± 0.01C | 97.6 | nd | nd | ||
| 15.91 | 2-Methyl-1-propanol | 1.02 ± 0.24A | 0.65 ± 0.05B | 45.8 | 0.05 ± 0.01C | 95.2 | nd | nd | ||
| 17.88 | 1-Butanol | 0.12 ± 0.07A | 0.05 ± 0.01A | 55.8 | nd | 100.0 | nd | nd | ||
| 20.32 | Isoamyl alcohols | 59.78 ± 1.53A | 27.49 ± 1.83B | 54.0 | 8.91 ± 0.61C | 85.1 | 0.27 ± 0.02D | 99.5 | 0.09 ± 0.02E | 99.9 |
| 25.53 | 1-hexanol | 0.52 ± 0.18A | 0.26 ± 0.06A | 50.0 | 0.15 ± 0.02B | 70.3 | nd | nd | ||
| 25.75 | 2-Penten-4-ol | 0.10 ± 0.01A | 0.09 ± 0.02A | 10.5 | 0.03 ± 0.003B | 68.5 | nd | nd | ||
| 26.01 | Trans-3-Hexen-1-ol | 0.02 ± 0.01AB | 0.03 ± 0.001A | − 56.0 | 0.01 ± 0.002B | 50.7 | nd | nd | ||
| 26.6 | 3-Ethoxy-1-propanol | 0.14 ± 0.02A | 0.12 ± 0.01A | 11.6 | 0.08 ± 0.01B | 42.0 | nd | nd | ||
| 26.81 | Cis-3-hexen-1-ol | 0.006 ± 0.002A | 0.01 ± 0.004A | 56.8 | 0.01 ± 0.001A | − 15.4 | nd | nd | ||
| 29.21 | 1-Heptanol | 0.09 ± 0.02A | 0.05 ± 0.01B | 47.5 | 0.02 ± 0.001C | 80.5 | nd | nd | ||
| 30.23 | 2-Ethyl-1-hexanol | 0.05 ± 0.03A | 0.01 ± 0.01A | 73.4 | 0.01 ± 0.01A | 83.0 | nd | nd | ||
| 32.73 | 1-Octanol | 3.00 ± 0.05A | 1.47 ± 0.11B | 51.0 | 0.13 ± 0.05C | 95.8 | 0.06 ± 0.02C | 97.9 | nd | |
| 40.11 | 2-(2-Butoxyethoxy) ethanol | 0.03 ± 0.001A | 0.01 ± 0.003B | 53.6 | nd | 100.0 | nd | nd | ||
| 42.47 | Benzyl alcohol | 0.14 ± 0.03A | 0.07 ± 0.001B | 49.4 | 0.05 ± 0.01B | 64.1 | 0.02 ± 0.01C | 87.0 | nd | |
| 43.53 | Phenylethyl alcohol | 52.71 ± 1.22A | 29.36 ± 0.76B | 44.0 | 22.97 ± 0.22C | 56.4 | 5.10 ± 0.20D | 91.2 | 1.86 ± 0.33E | 96.8 |
| 44.54 | 1-Nonanol | 0.03 ± 0.02A | 0.02 ± 0.01A | 43.3 | nd | 100.0 | ||||
| Sum of higher alcohols | 123.52 ± 9.79A | 60.29 ± 2.91B | 49.5 | 32.45 ± 0.94C | 72.80 | 5.46 ± 0.25D | 95.6 | 1.95 ± .34E | 98.4 | |
| Esters | ||||||||||
| 14.15 | Ethyl butyrate | 0.15 ± 0.03A | nd | 100.0 | nd | 100.0 | nd | nd | ||
| 17.22 | Isoamyl acetate | 6.14 ± 0.24A | 0.47 ± 0.01B | 92.3 | 0.047 ± 0.008C | 99.2 | nd | nd | ||
| 21.32 | Ethyl hexanoate | 0.61 ± 0.04A | 0.06 ± 0.001B | 90.3 | 0.014 ± 0.001C | 97.6 | nd | nd | ||
| 22.79 | Hexyl acetate | 0.16 ± 0.02A | 0.02 ± 0.001B | 89.3 | nd | 100.0 | nd | nd | ||
| 25.48 | Ethyl lactate | 2.12 ± 0.36A | 1.89 ± 1.04A | 10.9 | 1.02 ± 0.06AB | 51.8 | 0.08 ± 0.01B | 96.3 | nd | |
| 28.56 | Ethyl octanoate | 0.58 ± 0.35A | 0.10 ± 0.004B | 83.1 | 0.06 ± 0.01B | 89.5 | 0.02 ± 0.004B | 96.2 | nd | |
| 31.59 | Ethyl-3-hydroxybutyrate | 0.17 ± 0.001A | 0.13 ± 0.003B | 23.7 | 0.07 ± 0.01C | 57.5 | nd | nd | ||
| 35.2 | Ethyl decanoate | 1.60 ± 0.10A | 0.23 ± 0.01B | 85.6 | 0.10 ± 0.01C | 93.8 | 0.02 ± 0.001D | 98.8 | nd | |
| 36.48 | Diethyl succinate | 1.29 ± 0.13A | 0.51 ± 0.03B | 60.4 | 0.31 ± 0.01C | 76.0 | 0.03 ± 0.002D | 97.6 | nd | |
| 40.26 | Ethyl-4-hydroxybutanoate | 0.36 ± 0.03A | 0.17 ± 0.001B | 53.5 | 0.11 ± 0.01C | 69.7 | nd | nd | ||
| 40.87 | 2-Phenylethyl acetate | 1.35 ± 0.08A | 0.31 ± 0.01B | 77.0 | 0.13 ± 0.002C | 90.3 | 0.006 ± 0.004D | 99.6 | nd | |
| 46.87 | Diethyl malate | 3.90 ± 0.18A | 1.40 ± 0.10B | 64.1 | 1.00 ± 0.05C | 74.3 | 0.35 ± 0.05D | 91.1 | 0.31 ± 0.007D | 92.1 |
| 48.23 | Ethyl-3-hydroxy-tridecanoate | 0.12 ± 0.01A | 0.01 ± 0.01B | 92.7 | nd | 100.0 | nd | nd | ||
| 49.17 | Diethyl oxaloproprionate | 0.22 ± 0.01A | 0.06 ± 0.01B | 72.6 | 0.04 ± 0.01C | 79.9 | 0.008 ± 0.002D | 96.3 | 0.02 ± 0.003E | 90.4 |
| 52.06 | Ethyl-5-oxotetrahydro-2-furancarboxylate | 1.81 ± 0.04A | 0.62 ± 0.11B | 65.7 | 0.44 ± 0.01C | 75.8 | 0.25 ± 0.04D | 86.4 | 0.34 ± 0.04DE | 81.2 |
| 56.13 | Ethyl hydrogen succinate | 7.93 ± 0.88A | 2.16 ± 0.54B | 72.7 | 1.33 ± 0.010C | 83.2 | 1.23 ± 0.02C | 84.4 | 2.00 ± 0.10BD | 74.7 |
| Sum of esters | 28.51 ± 2.58A | 8.14 ± 1.88B | 71.5 | 4.69 ± 0.18C | 83.6 | 1.99 ± 0.14D | 93.0 | 2.67 ± 0.16E | 90.6 | |
| Acids | ||||||||||
| 29.97 | Acetic acid | 0.04 ± 0.02A | 0.01 ± 0.005B | 75.5 | 0.003 ± 0.002B | 93.2 | nd | nd | ||
| 33.23 | Isobutyric acid | 0.04 ± 0.01A | nd | 100.0 | nd | nd | nd | |||
| 36.36 | Pentanoic acid | 0.08 ± 0.02A | 0.10 ± 0.02A | − 23.6 | 0.069 ± 0.005A | 16.5 | nd | nd | ||
| 41.45 | Hexanoic acid | 14.56 ± 0.66A | 6.29 ± 0.18B | 56.8 | 4.54 ± 0.54C | 68.8 | 0.36 ± 0.08C | 97.5 | 0.31 ± 0.23C | 97.9 |
| 47.12 | Octanoic acid | 6.27 ± 0.97A | 2.05 ± 0.18B | 67.3 | 1.53 ± 0.03C | 75.6 | 1.52 ± 0.25C | 75.8 | 1.04 ± 0.01DE | 83.4 |
| 49.83 | Nonanoic acid | 0.27 ± 0.06A | 0.07 ± 0.02B | 74.4 | 0.03 ± 0.01C | 87.2 | nd | 100.0 | 0.02 ± 0.02 | 94.3 |
| 49.94 | 5-Oxotetrahydro furan 2 carboxylic acid | 0.83 ± 0.23A | 0.23 ± 0.05B | 72.9 | 0.15 ± 0.01C | 81.7 | 0.10 ± 0.03D | 87.9 | 0.10 ± 0.02D | 88.1 |
| 52.3 | Decanoic acid | 8.95 ± 0.92A | 1.52 ± 0.14B | 83.0 | 0.80 ± 0.01C | 91.1 | 0.54 ± 0.18D | 94.0 | 0.44 ± 0.11D | 95.1 |
| 53.84 | 9-decenoic acid | 0.81 ± 0.04A | 0.23 ± 0.04B | 71.3 | 0.13 ± 0.01C | 83.7 | 0.04 ± 0.03D | 95.3 | 0.03 ± 0.02D | 96.3 |
| 57.24 | Dodecanoic acid | 0.53 ± 0.04AB | 0.58 ± 0.03A | − 9.1 | 0.46 ± 0.25 AB | 14.6 | 0.33 ± 0.02AB | 39.1 | 0.42 ± 0.02AB | 21.5 |
| Sum of acids | 32.41 ± 2.97A | 11.08 ± 0.65A | 60.5 | 7.71 ± 0.86C | 73.60 | 2.88 ± 0.59D | 91.1 | 2.49 ± 0.58D | 92.3 | |
| Ketones | ||||||||||
| 57.36 | 4-Sec-butoxy-2-butanone | 1.79 ± 0.27A | 0.36 ± 0.52B | 79.6 | 0.06 ± 0.02C | 96.4 | nd | nd | ||
| 23.76 | Acetoin | 0.02 ± 0.01A | 0.03 ± 0.00A | − 25.2 | 0.02 ± 0.003A | − 7.9 | nd | nd | ||
| 50.36 | Pentadecane-2,4-dione | 0.63 ± 0.07A | 0.41 ± 0.02B | 34.5 | 0.44 ± 0.16B | 30.0 | 0.05 ± 0.01C | 92.0 | 0.04 ± 0.01D | 93.0 |
| Sum of ketones | 2.44 ± 0.37A | 0.50 ± 0.11B | 67.1 | 0.52 ± 0.18B | 78.44 | 0.05 ± 0.01C | 97.9 | 0.04 ± 0.01C | 98.19 | |
| Lactones | ||||||||||
| 35.88 | γ-Butyrolactone | 1.21 ± 0.14A | 1.12 ± 0.04A | 7.4 | 0.72 ± 0.04B | 40.4 | 0.12 ± 0.01C | 90.1 | 0.04 ± 0.001D | 97.0 |
| 47.01 | Pantolactone | 0.09 ± 0.03A | 0.03 ± 0.02B | 66.7 | 0.04 ± 0.001B | 53.2 | nd | nd | ||
| 45.25 | 5-Butyl-4-methyldihydro-2(3H)-furanone | 0.12 ± 0.06A | 0.05 ± 0.01B | 57.6 | 0.03 ± 0.007B | 75.3 | 0.03 ± 0.02B | 78.3 | 0.05 ± 0.02B | 58.3 |
| 46.15 | 2H-Pyran-2,6(3H)-dione | 0.44 ± 0.09A | 0.25 ± 0.05B | 44.1 | 0.15 ± 0.006C | 65.3 | nd | nd | ||
| 55.23 | 2,3-Dihydrobenzofuran | 0.23 ± 0.12A | 0.13 ± 0.02A | 45.9 | 0.03 ± 0.00C | 85.7 | 0.01 ± 0.01D | 96.9 | nd | |
| Sum of lactones | 2.10 ± 0.44A | 1.58 ± 0.16A | 24.8 | 0.98 ± 0.05B | 53.2 | 0.16 ± 0.04C | 92.7 | 0.09 ± 0.02C | 95.9 | |
| Phenol | ||||||||||
| 50.84 | 2-Methoxy-4-vinylphenol | 0.42 ± 0.003A | 0.11 ± 0.01A | 73.6 | 0.02 ± 0.001B | 95.1 | nd | |||
| Sulphur compounds | ||||||||||
| 37.86 | Methionol | 0.26 ± 0.03A | 0.18 ± 0.02A | 32.8 | 0.04 ± 0.00B | 84.9 | Nd | |||
| Ret. time (min) | Higher alcohols | W5 (− 10.1) | Loss (%) | W6 (− 10.8) | Loss (%) | W7 (− 11.5) | Loss (%) | W8 (− 12.2) | Loss (%) |
|---|---|---|---|---|---|---|---|---|---|
| 14.12 | 1-Propanol | nd | nd | nd | nd | ||||
| 15.91 | 2-Methyl-1-propanol | nd | nd | nd | nd | ||||
| 17.88 | 1-Butanol | nd | nd | nd | nd | ||||
| 20.32 | Isoamyl alcohols | 0.07 ± 0.01E | 99.9 | 0.14 ± 0.02F | 99.8 | 0.01 ± 0.005G | nd | ||
| 25.53 | 1-hexanol | nd | nd | nd | nd | ||||
| 25.75 | 2-Penten-4-ol | nd | nd | nd | nd | ||||
| 26.01 | Trans-3-Hexen-1-ol | nd | nd | nd | nd | ||||
| 26.6 | 3-Ethoxy-1-propanol | nd | nd | nd | nd | ||||
| 26.81 | Cis-3-hexen-1-ol | nd | nd | nd | nd | ||||
| 29.21 | 1-Heptanol | nd | nd | nd | nd | ||||
| 30.23 | 2-Ethyl-1-hexanol | nd | nd | nd | nd | ||||
| 32.73 | 1-Octanol | nd | nd | nd | nd | ||||
| 40.11 | 2-(2-Butoxyethoxy) ethanol | nd | nd | nd | nd | ||||
| 42.47 | Benzyl alcohol | nd | nd | nd | nd | ||||
| 43.53 | Phenylethyl alcohol | 0.86 ± 0.15F | 98.5 | 1.21 ± 0.06FG | 97.9 | 0.83 ± 0.05F | 98.6 | 1.35 ± 0.08G | 97.7 |
| 44.54 | 1-Nonanol | ||||||||
| Sum of higher alcohols | 0.93 ± .16F | 99.2 | 1.35 ± 0.08G | 98.9 | 0.84 ± 0.05F | 99.3 | 1.35 ± 0.08G | 98.9 | |
| Esters | |||||||||
| 14.15 | Ethyl butyrate | nd | nd | nd | nd | ||||
| 17.22 | Isoamyl acetate | nd | nd | nd | nd | ||||
| 21.32 | Ethyl hexanoate | nd | nd | nd | nd | ||||
| 22.79 | Hexyl acetate | nd | nd | nd | nd | ||||
| 25.48 | Ethyl lactate | nd | nd | nd | nd | ||||
| 28.56 | Ethyl octanoate | nd | nd | nd | nd | ||||
| 31.59 | Ethyl-3-hydroxybutyrate | nd | nd | nd | nd | ||||
| 35.2 | Ethyl decanoate | nd | nd | nd | nd | ||||
| 36.48 | Diethyl succinate | nd | nd | nd | nd | ||||
| 40.26 | Ethyl-4-hydroxybutanoate | nd | nd | nd | nd | ||||
| 40.87 | 2-Phenylethyl acetate | nd | nd | nd | nd | ||||
| 46.87 | Diethyl malate | 0.23 ± 0.03E | 94.1 | 0.12 ± 0.001FG | 96.9 | 0.14 ± 0.03F | 96.4 | 0.07 ± 0.02G | 98.2 |
| 48.23 | Ethyl-3-hydroxy-tridecanoate | nd | 100.0 | nd | nd | nd | |||
| 49.17 | Diethyl oxaloproprionate | 0.02 ± 0.001E | 88.3 | nd | nd | nd | |||
| 52.06 | Ethyl-5-oxotetrahydro-2-furancarboxylate | 0.32 ± 0.02E | 82.4 | 0.08 ± 0.03F | 95.8 | 0.13 ± 0.01G | 92.7 | 0.04 ± 0.01H | 97.8 |
| 56.13 | Ethyl hydrogen succinate | 1.82 ± 0.28B | 77.1 | 0.94 ± 0.03C | 88.1 | 0.46 ± 0.01C | 94.2 | 0.19 ± 0.02CD | 97.6 |
| Sum of esters | 2.39 ± 0.34E | 91.6 | 1.14 ± 0.06F | 96.0 | 0.73 ± 0.05G | 97.4 | 0.30 ± 0.05H | 99.0 | |
| Acids | |||||||||
| 29.97 | Acetic acid | nd | nd | nd | nd | ||||
| 33.23 | Isobutyric acid | nd | nd | nd | nd | ||||
| 36.36 | Pentanoic acid | nd | nd | nd | nd | ||||
| 41.45 | Hexanoic acid | 0.24 ± 0.22C | 98.4 | 0.24 ± 0.14C | 98.3 | 0.11 ± 0.003C | 99.3 | 0.21 ± 0.04C | 98.6 |
| 47.12 | Octanoic acid | 1.33 ± 0.45 cd | 78.7 | 0.87 ± 0.04E | 86.2 | 0.21 ± 0.02F | 96.6 | 0.19 ± 0.03F | 97.0 |
| 49.83 | Nonanoic acid | nd | nd | nd | nd | ||||
| 49.94 | 5-Oxotetrahydro furan 2 carboxylic acid | 0.09 ± 0.01D | 89.4 | 0.04 ± 0.01E | 95.5 | 0.032 ± 0.01F | 96.2 | 0.014 ± 0.01G | 98.3 |
| 52.3 | Decanoic acid | 0.36 ± 0.08D | 96.0 | 0.16 ± 0.004E | 98.2 | 0.08 ± 0.02E | 99.1 | 0.03 ± 0.001E | 99.7 |
| 53.84 | 9-decenoic acid | 0.04 ± 0.001D | 94.7 | 0.02 ± 0.001D | 97.8 | nd | nd | ||
| 57.24 | Dodecanoic acid | 0.33 ± 0.12AB | 39.1 | 0.39 ± 0.10AB | 26.9 | 0.25 ± 0.01B | 53.8 | nd | |
| Sum of acids | 2.39 ± 0.87D | 92.6 | 1.72 ± 0.29E | 94.7 | 0.68 ± 0.06F | 97.9 | 0.44 ± 0.08G | 98.7 | |
| Ketones | |||||||||
| 57.36 | 4-Sec-butoxy-2-butanone | nd | nd | nd | nd | ||||
| 23.76 | Acetoin | nd | nd | nd | nd | ||||
| 50.36 | Pentadecane-2,4-dione | 0.02 ± 0.01E | 96.8 | 0.008 ± 0.011F | 98.7 | 0.02 ± 0.003G | 96.5 | 0.002 ± 0.001H | 99.7 |
| Sum of ketones | 0.02 ± 0.01C | 99.2 | 0.008 ± 0.01C | 99.67 | 0.02 ± 0.003C | 99.1 | 0.002 ± 0.001C | 99.9 | |
| Lactones | |||||||||
| 35.88 | γ-Butyrolactone | 0.05 ± 0.02D | 96.0 | 0.029 ± 0.027D | 97.6 | 0.03 ± 0.01D | 97.5 | 0.04 ± 0.01D | 97.0 |
| 47.01 | Pantolactone | nd | nd | nd | nd | ||||
| 45.25 | 5-Butyl-4-methyldihydro-2(3H)-furanone | 0.04 ± 0.01B | 70.0 | nd | nd | nd | |||
| 46.15 | 2H-Pyran-2,6(3H)-dione | nd | nd | nd | nd | ||||
| 55.23 | 2,3-Dihydrobenzofuran | nd | nd | nd | nd | ||||
| Sum of lactones | 0.08 ± 0.01C | 96.0 | 0.03 ± 0.03DD | 98.6 | 0.03 ± 0.01D | 98.5 | 0.04 ± 0.01D | 98.2 | |
Different letters mean values significantly different (p < 0.05)
In Falaghina wine, higher alcohols represent the 64% of total volatile compounds and most of them are by-products of fermentation by yeasts. The C6 alcohols, cis-3-hexen-1-ol and trans-3-hexen-1-ol, showed comparable properties (i.e. hydrophobic constants log P = 1.61 and 2.03, respectively) (Rodriguez-Bencomo et al. 2011) and similar behaviour, remaining unchanged in W1 sample, together with 3-ethoxy-1-propanol. Other higher alcohols suffered a 50% loss or over, when increasing alcohol removal (W2–W8). Isoamyl alcohols and 2-phenylethanol, the main fermentation-derived compounds, were present in high amount; their losses were 54 and 44%, respectively, after the 1st cycle, and then decreased as alcohol reduction increased. As previously observed for dealcoholized (− 2/− 6.5 vol%) red wines (Liguori et al. 2013a; Lisanti et al. 2013), 2-phenylethanol remained almost unchanged because of its low volatility and high solubility in water (vapor pressure = 0.10 hPa at 20 °C; H value = 0.24 Pa m3 mol−1) and of the π–π interactions with polyphenols. In white wines, its concentration decreased during dealcoholization because of the low amount of the polyphenol compounds. In fact, in W1 and W2 samples, corresponding to − 2.7 and − 5.5 vol% dealcoholization levels, the loss of 2-phenylethanol was of 44 and 56%, respectively. Lower losses (up to 35%) were detected by Fedrizzi et al. (2014) for white wines Verdicchio and Soave (white grape cv) dealcoholized up to − 4 vol%.
With regards to esters, they have different origins: some compounds (i.e. ethyl hexanoate, ethyl octanoate, ethyl decanoate) have fermentative origin, while diethyl succinate and ethyl lactate can be also formed during storage by chemical esterification. Generally, esters have hydrophobic character, therefore their losses were expected during dealcoholization tests, in different amount depending on their physical and chemical properties. After the 1st cycle of dealcoholization, it was observed that they suffered a higher (73%) depletion than higher alcohols. This decrease of esters was in agreement with what reported by other authors in dealcoholized white (Fedrizzi et al. 2014) and red wines (Liguori et al. 2013a; Lisanti et al. 2013).
With regards to acids, the most abundant acids detected in Falanghina were decanoic and hexanoic acids. The fatty acids decreased by 60% in W1 sample with a progressive reduction in the further dealcoholized samples. This acid loss was similar to that found in red wines at a higher dealcoholization level (Liguori et al. 2013a; Lisanti et al. 2013), but higher than that for Verdicchio and Soave wines at dealcoholized levels of − 2 and − 3 vol% (Fedrizzi et al. 2014).
Three ketones, five lactones, one phenol and one sulphur compound were also identified in Falanghina wine (Table 1). They presented a consistent loss after the 3rd cycle corresponding to − 8.7 vol% of alcohol removal. These losses were in the same amount as those found by Fedrizzi et al. (2014), but higher than those found in red wines, where the π–π interactions with polyphenols and aromatic ring may be responsible of the higher retention (Rodriguez-Bencomo et al. 2011).
In summary, the volatile compounds progressively decreased during the dealcoholization, but to a different extent, depending on the chemical class to which they belong. In particular, the main losses were observed at the end of the second cycle (− 5.5 vol%): about 53% for lactones, 72% for higher alcohols and almost 84% for esters and phenols (Table 1). In the subsequent cycles, the volatiles continued to decrease up to an overall volatile loss of 96%.
Correlation of volatile compounds loss and Henry’s law constant
Both process conditions and physical properties influence the decrease of volatile compounds in wine during the dealcoholization process. In particular, when using distilled water as stripper, the volatile transfer is encouraged across the membrane due to the high difference in volatile concentration between the two sides of the membrane itself. Other effects such as interaction with wine matrix, concentration and affinity to the membrane should be considered. For the OD process (Hogan et al. 1998), the loss of volatiles may be evaluated considering that the amount of dissolved gas in the wine is proportional to its partial pressure in the gas phase. The proportionality factor is called the Henry’s law constant (Sander 2015).
For the main volatile compounds present in Falanghina wine, the loss of volatile compounds was here correlated to the Henry’s law constant (in water) (Table 2). For each class of volatile compounds, only the first two dealcoholization cycles (W1 and W2 samples) were considered, since these are the cycles where most of the loss occurs. Correlations were tested for some of the volatile compounds belonging to higher alcohols, esters and acids. The Henry’s law constants were those obtained from literature (Sander 2015). It was found that Henry’s law constant is well correlated with the loss of volatiles compounds as reported in Fig. 2a, b. The correlation for higher alcohols loss has R2 equals to 0.8115 and 0.7397, for the two levels of dealcoholization − 2.7 and − 5.5 vol%, respectively.
Table 2.
Henry’s law constant (H) of volatile compounds (Sander 2015) and loss of volatile compounds in W1 (− 2.7 vol%) and W2 (− 5.5 vol%) wine samples
| H (mol/(m3*Pa)) | log H | W1 loss (%) | W2 loss (%) | |
|---|---|---|---|---|
| Higher alcohols | ||||
| 1-Propanol | 1.4 | 0.146 | 56.0 | 97.6 |
| 2-Methyl-1-propanol | 0.51 | − 0.292 | 45.8 | 95.2 |
| 3-Methyl-1-butanol | 0.69 | − 0.161 | 54.0 | 85.1 |
| 1-Butanol | 1.2 | 0.079 | 55.8 | 100.0 |
| 2-Phenylethanol | 0.24 | − 0.620 | 44.0 | 56.0 |
| 1-Hexanol | 0.37 | − 0.432 | 50.0 | 70.3 |
| 1-Heptanol | 0.38 | − 0.420 | 47.5 | 80.5 |
| 1-Octanol | 0.65 | − 0.187 | 51.0 | 95.8 |
| Esters | ||||
| Isoamyl acetate | 2.60 × 10⁻² | − 1.59 | 92.29 | 99.23 |
| Ethyl hexanoate | 1.40 × 10⁻² | − 1.85 | 90.33 | 97.65 |
| Ethyl octanoate | 1.03 × 10⁻² | − 1.99 | 83.11 | 89.46 |
| Ethyl decanoate | 1.40 × 10⁻² | − 1.85 | 85.57 | 93.76 |
| Ethyl butyrate | 2.90 × 10⁻² | − 1.54 | 100 | 100 |
| Hexyl acetate | 1.40 × 10⁻² | − 1.85 | 89.3 | 100 |
| Acids | ||||
| Acetic acid | 8.20 | 0.91 | 75.5 | 93.2 |
| Hexanoic acid | 1.20 × 10⁻¹ | − 0.92 | 56.8 | 68.8 |
| Octanoic acid | 1.50 × 10⁻¹ | − 0.82 | 67.3 | 75.6 |
| Decanoic acid | 6.5 | 0.81 | 83.2 | 91.5 |
| Isobutyric acid | 5.60 × 101 | 1.75 | 100 | 100 |
| Nonanoic acid | 3.8 | 0.58 | 74.4 | 87.2 |
Fig. 2.

Correlation between H constant (log H) and volatile compounds for an alcohol reduction of a − 2.7 vol% (W1 sample) and b − 5.5 vol% (W2 sample)
Similar correlation coefficients were found for esters (R2 = 0.8021 and 0.5190 at − 2.7 and − 5.5 vol%, respectively). The observed loss of esters may be explained by the interaction of two mechanisms: their hydrophobic character and hence affinity to the membrane, and by low values of Henry’s law constants (Table 2).
Higher correlation coefficients were found for fatty acids: it was found higher (R2 = 0.9698) for the higher dealcoholization level (− 5.5 vol%) than that for the lower one (− 2.6 vol%) (R2 = 0.8443).
The correlation proposed here can be used to predict the losses of volatiles during dealcoholization process. Further studies will be performed to confirm the validity of this correlation also for other wines.
Wine quality parameters
Total acidity, pH, organic acids
Acidity is related to wine quality: low values create flat wines in terms of taste, while high values originate sour wines. In white wine, normal values of total acidity range between 3.3 and 6.9 tartaric acid g/L (Darias-Martín et al. 2003). The value of total acidity of Falanghina wine was 5.8 g/L and remains almost unchanged (p < 0.05) during the dealcoholization cycles (Table 3).
Table 3.
Total acidity, pH, colour, polyphenols amount, flavonols content and organic acids profile in Falanghina (W0) and dealcoholized wine samples (W1–W8) corresponding to each cycle
| Wine sample | Total acidity (tartaric acid g/L) | pH | Colour (nm) | Polyphenols (mg GAE/L) | Flavonols (Quercitin mg/L) | Lactic acid (mg/L) | Acetic acid (mg/L) |
|---|---|---|---|---|---|---|---|
| W0 | 5.81 ± 0.19A | 3.22 ± 0.02A | 0.1272 ± 0.008A | 223.83 ± 10.51A | 30.87 ± 0.26A | 984.8 ± 17.4A | 262.6 ± 18.4A |
| W1 | 5.91 ± 0.05A | 3.20 ± 0.04A | 0.1268 ± 0.006A | 232.90 ± 22.70A | 30.75 ± 0.91A | 985.4 ± 14.4A | 234.1 ± 21.4A |
| W2 | 5.94 ± 0.01A | 3.18 ± 0.03A | 0.1342 ± 0.001A | 238.91 ± 22.50A | 30.65 ± 0.66A | 971.8 ± 5.7A | 234.2 ± 51.5A |
| W3 | 6.07 ± 0.02A | 3.26 ± 0.03A | 0.1271 ± 0.007A | 235.86 ± 19.21A | 29.89 ± 0.68A | 993.9 ± 107.6A | 223.4 ± 22.0A |
| W4 | 6.02 ± 0.06A | 3.17 ± 0.07A | 0.1329 ± 0.008A | 227.54 ± 23.59A | 30.49 ± 0.52A | 985.4 ± 107.7A | 218.8 ± 19.0A |
| W5 | 6.04 ± 0.24A | 3.18 ± 0.04A | 0.1306 ± 0.003A | 236.36 ± 4.95A | 30.56 ± 0.19A | 950.8 ± 48.6A | 250.4 ± 4.3A |
| W6 | 6.17 ± 0.12A | 3.18 ± 0.04A | 0.1348 ± 0.007A | 240.50 ± 3.06A | 31.96 ± 0.40A | 960.0 ± 27.5A | 250.4 ± 2.0A |
| W7 | 6.05 ± 0.08A | 3.22 ± 0.06A | 0.1378 ± 0.004A | 230.60 ± 5.90A | 30.65 ± 0.83A | 1021.5 ± 66.0A | 243.3 ± 9.5A |
| W8 | 6.02 ± 0.13A | 3.26 ± 0.05A | 0.1396 ± 0.008A | 236.29 ± 11.98A | 32.01 ± 0.23A | 1009.2 ± 49.4A | 261.5 ± 10.1A |
| Wine sample | Succinic acid (mg/L) | Malic acid (mg/L) | Tartaric acid (mg/L) | Oxalic acid (mg/L) | Ascorbic acid (mg/L) | Citric acid (mg/L) |
|---|---|---|---|---|---|---|
| W0 | 143.5 ± 12.0A | 1390.6 ± 37.4A | 2335.0 ± 103.9A | 347.0 ± 19.4A | 23.7 ± 4.9A | 362.5 ± 53.0A |
| W1 | 138.7 ± 31.0A | 1442.8 ± 69.63A | 2189.0 ± 22.2A | 345.0 ± 7.99A | 23.9 ± 3.0A | 347.6 ± 17.3A |
| W2 | 150.1 ± 8.3A | 1349.2 ± 12.9A | 2182.4 ± 20.5A | 350.0 9.1A | 24.0 ± 5.4A | 370.6 ± 77.6A |
| W3 | 156.7 ± 9.3A | 1407.9 ± 10.8A | 2282.6 ± 34.6A | 358.7 ± 5.1A | 23.7 ± 3.0A | 330.5 ± 53.0A |
| W4 | 140.7 ± 43.3A | 1333.8 ± 275.1A | 2309.6 ± 147.9A | 366.3 ± 8.7A | 23.2 ± 6.4A | 355.8 ± 46.9A |
| W5 | 166.9 ± 10.1A | 1412.9 ± 27.9A | 2331.2 ± 60.1A | 358.2 ± 16.7A | 21.9 ± 0.9A | 369.0 ± 3.7A |
| W6 | 133.3 ± 16.3A | 1382.1 ± 42.7A | 2299.8 ± 123.0A | 338.8 ± 1.7A | 21.5 ± 4.4A | 373.2 ± 47.8A |
| W7 | 118.9 ± 17.7A | 1423.6 ± 15.6A | 2304.0 ± 17.7A | 364.4 ± 32.2A | 21.9 ± 3.2A | 350.5 ± 43.1A |
| W8 | 128.7 ± 14.9A | 1513.7 ± 37.6A | 2370.3 ± 35.4A | 374.8 ± 19.1A | 21.7 ± 15.2A | 335.6 ± 65.4A |
Different letters mean values significantly different (p < 0.05)
pH influences different characteristics of wine, some of which are related to odour, taste and quality. Generally, pH values are in the range of 2.9–4 and influence wine taste and its storage. White wines have lower values than red ones since they are also perceived as more acid. pH values corresponding to wine samples at different cycles were in the range 3.17–3.26 without significant differences (p < 0.05) among the dealcoholization cycles.
The main acids detected in Falanghina wine were tartaric, malic, and lactic acids in an amount of about 1000 ppm. Lower amounts of acetic, citric, succinic, oxalic and ascorbic acids were found (Table 3). The profile of organic acids agreed with data reported in literature on white wines (Taran et al. 2014).
Colour, total phenols and flavonols
Colour of white wine is mainly related to yellow–brown pigments which have a maximum of absorption at 420 nm. The values detected in the dealcoholized wine samples (W1–W8) ranged from 0.12 to 0.14 nm without significant differences (p < 0.05) (Table 3). Similarly, Gambuti et al. (2011) reported that the partial dealcoholization through OD did not change significantly the colour of red wines, contrary to what was observed in white wines which were dealcoholized by reverse osmosis (Bogianchini et al. 2011).
Wine is also an excellent source of various classes of polyphenols, which are responsible for the sensory characteristics (i.e. colour, astringency, bitterness), for the protective activity against oxidative processes related to cellular aging, as well as flavonols, important in the antioxidant potency and other biological activities (Makris et al. 2003). The content and composition of these compounds depend on various factors related to grape variety, climate, cultivation practices, etc. (Paixão et al. 2007) and, it is well known, white wines have lower amount than red ones (Psarra et al. 2002). In Falanghina wine, the total phenols and flavonols were 230 mg GAE/L and 30 mg quercetin/L, respectively, in accordance with other white wines reported in literature (Li et al. 2009). The alcohol loss does not lead to phenols precipitation, accordingly to other studies (Bogianchini et al. 2011; Liguori et al. 2010). Since their concentration remained almost unchanged (Table 3), the dealcoholized wine samples can be considered as a source of bioactive compounds.
Formulation of alcohol free wine-based beverage
In the present study, a preliminary attempt was performed for the formulation of an alcohol-free wine-based beverage. Original Falanghina wine (W0), the totally dealcoholized wine sample (W8) with an alcohol content of 0.3 vol% and the alcohol-free wine-based beverage (WB) were tasted by untrained panelists. The results of quality assessment are reported in Fig. 3. The samples did not show very comparable hedonic scores except for the appearance, which according to the colour parameter did not change during the process, as already shown. Significant differences (p < 0.05) in the other descriptors were observed among the samples. During tasting, W8 was perceived with a high acidity and low odour, sweetness and body with respect to W0 (original wine), resulting unbalanced in taste and overall unacceptable, with unpleasant aftertaste.
Fig. 3.

Quality assessment of Falanghina wine (W0), total dealcoholized wine (W8) and alcohol free wine-based beverage (WB). Different letters mean values significantly different (p < 0.05), in the order W0–W8–WB
As also explained by Meillon et al. (2010), the absence of alcohol plays a vital role in wine perception since it determines texture and gustative sensations (i.e. body, viscosity and density), as well as interaction with other volatile compounds of wine. Often, alcohol reduced wines are associated with reduced sensory quality, in terms of problems with flavour imbalance and a lack of body; there is a reduction of heat sensation, fruity notes, persistency in the mouth, and overall complexity, while astringency, bitter and acid sensations increase (Meillon et al. 2010; Jordão et al. 2015).
Similar results were found by Lisanti et al. (2013), who observed no substantial differences between the original wine and the one with an alcohol content of − 2 vol%; on the contrary, by increasing the degree of processing (− 3, − 5 vol%) astringency, acidity and bitterness of wines were perceived.
To improve the sensory quality and the acceptability of the produced dealcoholized wine, various attempts were made to slightly modify taste and flavour. Different formulations were evaluated, and sufficient results were achieved by adding some compounds responsible for floral flavour, must and sodium carbonate solution. The beverage (WB) resulted in an improved overall acceptability with respect to W8 sample, but lower than the original wine. In particular, the odour attribute was positively perceived, although acid sensation remained; sweetness was increased and maintained lower than that of Falanghina wine, but not so far from having a balanced structure. Further improvements are still required in terms of body and aftertaste.
Conclusion
In this study the effect of dealcoholization on the properties of Falanghina white wine at various levels of dealcoholization was assessed. No significant changes in the main quality parameters (i.e. total acidity, pH, organic acids, colour, total phenols and flavonols) were detected during the dealcoholization. This confirms the preservation of antioxidant compounds with beneficial value present in wine. On the contrary, the volatile compounds content in wine decreased with increasing the alcohol removal reaching an overall loss of 96% in totally dealcoholized wine (0.3 vol%). The decrease of main volatile compounds (higher alcohols, esters and acids) was found to be well correlated with the Henry’s law constant. This correlation can be useful to determine the optimal level of dealcoholization which does not significantly affect the volatile composition, especially when partial dealcoholization is carried out. With regards to the free alcohol wine-based beverage, a relatively small size and limited sample group of respondents was used in this preliminary study. Nevertheless, the odour attribute was perceived positively although the acid sensation remained; the sweetness was increased but still perceived as lower than the level in Falanghina wine. Further study will be performed considering the statistical significance with a larger sample of panelists, and with more experienced wine consumers.
Footnotes
Publisher's Note
Springer Nature remains neutral with regard to jurisdictional claims in published maps and institutional affiliations.
References
- Bogianchini M, Cerezo AB, Gomis A, López F, García-Parrilla MC. Stability, antioxidant activity and phenolic composition of commercial and reverse osmosis obtained dealcoholised wines. Food Sci Technol. 2011;44:1369–1375. [Google Scholar]
- Catarino M, Mendes A. Dealcoholizing wine by membrane separation processes. Innov Food Sci Emerg Technol. 2011;12:330–337. doi: 10.1016/j.ifset.2011.03.006. [DOI] [Google Scholar]
- Catarino M, Mendes A, Madeira LM, Ferreira A. Alcohol removal from beer by reverse osmosis. Sep Sci Technol. 2007;42:3011–3027. doi: 10.1080/01496390701560223. [DOI] [Google Scholar]
- Cliff M, King M, Schlosser J. Anthocyanin, phenolic composition, colour measurement and sensory analysis of BC commercial red wines. Food Res Int. 2007;40:92–100. doi: 10.1016/j.foodres.2006.08.002. [DOI] [Google Scholar]
- Cocito C, Gaetano G, Delfini C. Rapid extraction of aroma compounds in must and wine by means of ultrasound. Food Chem. 1995;52:311–320. doi: 10.1016/0308-8146(95)92830-D. [DOI] [Google Scholar]
- Commission Regulation (EC) No 606/2009 of 10 July 2009 laying down certain detailed rules for implementing Council Regulation (EC) No 479/2008 about the categories of grapevine products, oenological practices and the applicable restrictions
- Darias-Martín J, Socas-Hernández A, Díaz-Romero C, Díaz-Díaz E. Comparative study of methods for determination of testable acidity in wine. J Food Compos Anal. 2003;16:555–562. doi: 10.1016/S0889-1575(03)00032-2. [DOI] [Google Scholar]
- De Francesco G, Sileoni V, Marconi O, Perretti G. Pilot plant production of low-alcohol beer by osmotic distillation. J Am Soc Brew Chem. 2015;73:41–48. [Google Scholar]
- Diban N, Arruti A, Barcelo A, Puxeu M, Urtiaga A, Ortiz I. Membrane dealcoholization of different wine varieties reducing aroma losses. Modeling and experimental validation. Innov Food Sci Emerg Technol. 2013;20:259–268. doi: 10.1016/j.ifset.2013.05.011. [DOI] [Google Scholar]
- Fedrizzi B, Nicolis E, Camin F, Bocca E, Carbognin C, Scholz M, Barbieri P, Finato F, Ferrarini R. Stable isotope ratios and aroma profile changes induced due to innovative wine dealcoholization approaches. Food Bioprocess Technol. 2014;7:62–70. doi: 10.1007/s11947-013-1068-x. [DOI] [Google Scholar]
- Gambuti A, Rinaldi A, Lisanti MT, Pessina R, Moio L. Partial dealcoholisation of red wines by membrane contactor technique: influence on colour, phenolic compounds and saliva precipitation index. Eur Food Res Technol. 2011;233:647–655. doi: 10.1007/s00217-011-1553-2. [DOI] [Google Scholar]
- Hogan PA, Canning RP, Peterson PA, Johnson RA, Michaels AS. A new option: osmotic distillation. Chem Eng Progr. 1998;94:49–61. [Google Scholar]
- Jordão AM, Vilela A, Cosme F. From sugar of grape to alcohol of wine: sensorial impact of alcohol in wine. Beverages. 2015;1:292–310. doi: 10.3390/beverages1040292. [DOI] [Google Scholar]
- King ES, Hildegarde H. The effect of reduced alcohol on the sensory profiles and consumer preferences of white wine. J Sens Stud. 2014;29:33–42. doi: 10.1111/joss.12079. [DOI] [Google Scholar]
- Lambrechts MG, Pretorius IS. Yeast and its importance to wine aroma—a review. S Afr J Enol Vitic. 2000;21:97–129. [Google Scholar]
- Li H, Wang X, Li Y, Li P, Wang H. Polyphenolic compounds and antioxidant properties of selected China wines. Food Chem. 2009;112:454–460. doi: 10.1016/j.foodchem.2008.05.111. [DOI] [Google Scholar]
- Liguori L, Attanasio G, Albanese D, Di Matteo M. Aglianico wine dealcoholization tests. Comput Aided Chem Eng. 2010;28:325–330. doi: 10.1016/S1570-7946(10)28055-0. [DOI] [Google Scholar]
- Liguori L, Russo P, Albanese D, Di Matteo M. Evolution of quality parameters during red wine dealcoholization by osmotic distillation. Food Chem. 2013;140:68–75. doi: 10.1016/j.foodchem.2013.02.059. [DOI] [PubMed] [Google Scholar]
- Liguori L, Russo P, Albanese D, Di Matteo M. Effect of process parameters on partial dealcoholization of wine by osmotic distillation. Food Bioprocess Technol. 2013;6:2514–2524. doi: 10.1007/s11947-012-0856-z. [DOI] [Google Scholar]
- Liguori L, De Francesco G, Russo P, Perretti G, Albanese D, Di Matteo M. Production and characterization of alcohol-free beer by membrane process. Food Bioprod Process. 2015;94:158–168. doi: 10.1016/j.fbp.2015.03.003. [DOI] [Google Scholar]
- Liguori L, De Francesco G, Russo P, Albanese D, Perretti G, Di Matteo M. Quality improvement of low alcohol craft beer produced by evaporative protraction. Chem Eng Trans. 2015;43:13–18. [Google Scholar]
- Liguori L, De Francesco G, Russo P, Perretti G, Albanese D, Di Matteo M. Quality attributes of low-alcohol top-fermented beers produced by membrane contactor. Food Bioprocess Technol. 2016;9:191–200. doi: 10.1007/s11947-015-1612-y. [DOI] [Google Scholar]
- Liguori L, Russo P, Albanese D, Di Matteo M. Production of low alcohol beverages with increased sensory characteristics. In: Grumezescu AM, Holban AM, editors. Food processing for increased quality and consumption. San Diego: Elsevier Inc.; 2018. pp. 347–382. [Google Scholar]
- Liguori L, De Francesco G, Albanese D, Mincione A, Perretti G, Di Matteo M, Russo P. Impact of osmotic distillation on the sensory properties and quality of low alcohol beer. J Food Qual. 2018;20:8780725. [Google Scholar]
- Lisanti MT, Gambuti A, Genovese A, Piombino P, Moio L. Partial dealcoholization of red wines by membrane contactor technique: effect on sensory characteristics and volatile composition. Food Bioprocess Technol. 2013;6:2289–2305. doi: 10.1007/s11947-012-0942-2. [DOI] [Google Scholar]
- Longo R, Blackman JW, Torley PJ, Rogiers SY, Schmidtke LM. Changes in volatile composition and sensory attributes of wines during alcohol content reduction. J Food Agric. 2017;97:8–16. doi: 10.1002/jsfa.7757. [DOI] [PubMed] [Google Scholar]
- López M, Alvarez S, Riera FA, Alvarez R. Production of low alcohol content apple cider by reverse osmosis. Ind Eng Chem Res. 2002;41:6600–6606. doi: 10.1021/ie020155a. [DOI] [Google Scholar]
- Makris DP, Psarra E, Kallithraka S, Kefalas P. The effect of polyphenolic composition as related to antioxidant capacity in white wines. Food Res Int. 2003;36:805–814. doi: 10.1016/S0963-9969(03)00075-9. [DOI] [Google Scholar]
- Mangindaan D, Khoiruddin K, Wenten IG. Beverage dealcoholization processes: past, present, and future. Trends Food Sci Technol. 2018;71:36–45. doi: 10.1016/j.tifs.2017.10.018. [DOI] [Google Scholar]
- Meillon S, Urbano C, Schlich P. Contribution of the Temporal Dominance of Sensations (TDS) method to the sensory description of subtle differences in partially dealcoholized red wines. Food Qual Prefer. 2009;20:490–499. doi: 10.1016/j.foodqual.2009.04.006. [DOI] [Google Scholar]
- Meillon S, Dugas V, Urbano C, Schlich P. Preference and acceptability of partially dealcoholized white and red wines by consumers and professionals. Am J Enol Vitic. 2010;61:42–52. [Google Scholar]
- Moio L, Ugliano M, Genovese A, Gambuti A, Pessina R, Piombino P. Effect of antioxidant protection of must on volatile compounds and aroma shelf life of Falanghina (Vitis vinifera L.) wine. J Agric Food Chem. 2004;52:891–897. doi: 10.1021/jf034869n. [DOI] [PubMed] [Google Scholar]
- Motta S, Guaita M, Petrozziello M, Ciambotti A, Panero L, Solomita M, Bosso A. Comparison of the physicochemical and volatile composition of wine fractions obtained by two different dealcoholization techniques. Food Chem. 2017;221:1–10. doi: 10.1016/j.foodchem.2016.10.046. [DOI] [PubMed] [Google Scholar]
- OIV (2007) Compendium of International Methods of Analysis of Wine and Must Office International de la Vigne et du Vin, Paris
- Paixão N, Perestrelo R, Marques JC, Câmara JS. Relationship between antioxidant capacity and total phenolic content of red, rosé and white wines Neuza. Food Chem. 2007;105:204–214. doi: 10.1016/j.foodchem.2007.04.017. [DOI] [Google Scholar]
- Psarra E, Makris DM, Kallithraka S, Kefalas P. Evaluation of the antiradical and reducing properties of selected Greek white wines: correlation with polyphenolic composition. J Sci Food Agric. 2002;82:1014–1020. doi: 10.1002/jsfa.1124. [DOI] [Google Scholar]
- Resolution OIV-ECO 432-2012. Beverage obtained by dealcoholization of wine. In: International Organization of Vine and Wine, OIV Code Sheet, Chapter 6, Part I. International Code of Oenological Practices, Paris, France,
- Resolution OIV-ECO 433-2012. Beverage obtained by partial dealcoholization of wine. In: International Organization of Vine and Wine, OIV Code Sheet, Paris, France, Chapter 6, Part I. International Code of Oenological Practices, Paris, France
- Rodriguez-Bencomo JJ, Mûnoz-González C, Andújar-Ortiz I, Álvarez PJM, Moreno-Arribas MV, Pozo-BayóN MA. Assessment of the effect of the non-volatile wine matrix on the volatility of typical wine aroma compounds by headspace solid phase microextraction/gas chromatography analysis. J Sci Food Agric. 2011;91:2484–2494. doi: 10.1002/jsfa.4494. [DOI] [PubMed] [Google Scholar]
- Russo P, Liguori L, Albanese D, Crescitelli A, Di Matteo M. Investigation of osmotic distillation technique for beer dealcoholization. Chem Eng Trans. 2013;32:1735–1740. [Google Scholar]
- Sander R. Compilation of Henry’s law constants (version 4.0) for water as solvent. Atmos Chem Phys. 2015;15:4399–4981. doi: 10.5194/acp-15-4399-2015. [DOI] [Google Scholar]
- Schmidtke LM, Blackman JW, Agboola SO. Production technologies for reduced alcoholic wines. J Food Sci. 2012;71:25–41. doi: 10.1111/j.1750-3841.2011.02448.x. [DOI] [PubMed] [Google Scholar]
- Singleton V, Rossi J. Colourimetry of total phenolics with phosphomolybdic phosphotungstic acid reagents. Am J Enol Vitic. 1965;16:144–158. [Google Scholar]
- Taran N, Stoleicova S, Soldatenco O, Morari B. The influence of pressure on chemical and physical parameters of white and red wines obtained by dealcoholization method. J Agroaliment Process Technol. 2014;20:215–219. [Google Scholar]
- Varela C, Dry PR, Kutyna DR, Francis IL, Henschke PA, Curtin CD, Chambers PJ. Strategies for reducing alcohol concentration in wine. Aust J Grape Wine Res. 2015;21:670–679. doi: 10.1111/ajgw.12187. [DOI] [Google Scholar]