

Abstract
The objective of this study was to evaluate yeast (Saccharomyces cerevisiae) from beer fermentation in its natural form (NY) and subjected to different processes of cellular ruptured [mechanical method using ultrasound (MRY) and modified autolysis using NaCl and ethanol (MAY)] regarding functional and digestibility properties, comparing them with textured soy protein (TSP). Ultrasound treatment resulted in 42% disruption efficiency and the micrographs obtained from scanning electron microscopy analysis showed important morphological modifications due to processes of cellular ruptured action. MRY cells presented more pronounced damage than LN, which suggests the rupture of the cell wall and exit of the internal material to the medium. NY, MRY, MAY, and TSP presented a very close composition concerning the protein content, ranging from 39.32 to 43.80% and moisture of 0.07–0.14%. In vitro digestibility of brewing yeast samples equated the digestibility of TSP (higher than 94%). Cellular disruption with ultrasound (MRY) caused an increase in foaming ability, stability and also oil retention capacity (8.82 mL of oil/g of protein). Modified autolysis (MAY) resulted in higher water holding capacity (14.50 g of water/g of protein) and index of water solubility (greater than 64%) with a decrease in their emulsifying properties. The highest water absorption capacity was presented by the TSP and NY. Therefore, in its different forms, yeast can be applied as a functional and technological ingredient in the food industry, with significant technological capabilities and potential applications.
Keywords: Beer biomass, Ultrasound, Autolysis, Characterization, Technological ingredient
Introduction
Saccharomyces cerevisiae yeast is widely used in the production of ethanol, bakery products and alcoholic beverages [beers, wine, cachaça]. In the beer production, this yeast species is the bioagent responsible for converting the starch present in the malt into ethanol and carbon dioxide, a process known as alcoholic fermentation (Stewart 2016).
Due to its rapid growth during the fermentation stage, the yeast mass can multiply about 3–5 times, generating a production surplus and becoming the second largest waste from breweries. The yeast recycling process is a common practice in the brewing industry. However, there is a limitation in the number of reuses to maintain the beverage quality. Typically, the total amount of Saccharomyces ssp. yeast biomass produced in lager beer fermentation, for example, is 1.7–2.3 kg m−3 of the final product (Hellborg and Piskur 2009).
Yeast surplus from alcoholic fermentation can be used in animal feed and human food in its entire form or from yeast derivatives, both for nutritional and functional enrichment (Mussatto et al. 2006) and as a production adjuvant (flavoring, antioxidant, emulsifier) of food (Ramos et al. 2011).
Cell rupture of the yeast can provide a significant increase in protein content and improvement in digestibility since the cell wall is ruptured providing the exposure of the intracellular components (Babayan et al. 1981). Fractionation and cellular disruption techniques may potentiate the use of this microbial protein in human diets (Charpentier et al. 1986; Sgarbieri et al. 1999).
In this context, the present work has evaluated yeast from beer fermentation in natural form and subjected to different processes of cellular disruption as to functional and digestibility properties, comparing them with textured soy protein, widely used as a technological ingredient in the food industry.
Materials and methods
Obtaining beer yeast
The yeast cell suspension resulting predominantly from the production of Pilsen beer used in the trials was supplied by a brewing industry in the city of Chapecó, Santa Catarina, Brazil, recycling the yeast up to five times.
The methodology applied to obtain clean natural yeast and yeast subjected to NaCl and ethanol modified autolysis was adapted from Sgarbieri et al. (1999). The yeast cell suspension was centrifuged (Centribio, Cienlab, Brazil) for 10 min at 349×g (2500 rpm) to remove water excess. After the supernatant was discarded, distilled water in the 2:1 (distilled water/yeast, v/v) ratio was added to remove impurities. The washing and centrifugation processes were performed twice and clean natural yeast (NY) was obtained.
Part of the NY froze in an ultra-freezer (IULT 335 D, Indrel, Brazil) for 24 h at mean temperature of − 86 °C and after lyophilization for 24 h in a laboratory bench lyophilizer (TFD5503, Ilshin Lab. Co. Ltd., Korea) at − 61 °C and pressured at 67 mbar, it was crushed with the aid of a mortar and pestle and sieved (mesh 32 mm μm−1). Another part of NY was subjected to different methods of cellular disruption: ultrasound and modified autolysis.
Autolysis modified with ethanol and sodium chloride
To obtain the yeast from modified autolysis (MAY), the NY was suspended again in distilled water at the ratio of 1:1 (m/v) with the addition of ethanol (7% v/m; Dinâmica) and sodium chloride (2% m/m; Synth). The mixture was taken to an incubator (Luca-223, Lucadema, Brazil) during 24 h at 55 °C and 150 rpm. After 24 h, the process stopped with heat treatment at 85 °C for 15 min in a water bath (Dubnoff Luca 157/28, Lucadema, Brazil). MAY was placed in Petri dishes, frozen in an ultra-freezer, lyophilized, crushed and sieved, following the same parameters of the NY.
Mechanical disruption with ultrasound
To obtain the mechanically ruptured yeast (MRY), the NY was added in an Erlenmeyer flask of 250 mL, with distilled water in 1:1 (m/v) ratio and subjected to an ultrasonic bath (Q335D, Quimis, Brazil) for 1 h, at a frequency of 40 kHz, with maximum temperature of 30 °C. Afterward, MRY was placed in Petri dishes, frozen in an ultra-freezer, lyophilized, crushed and sieved, following the same parameters of the NY.
Disruption efficiency
Disruption treatments were monitored by cell counting in a Neubauer chamber (40 ×/0.65) using methylene blue stain (Lee et al. 1981), before and after the sample rupture. Disruption efficiency was evaluated by the percentage of cells ruptured in each sample, as shown in Eq. 1:
| 1 |
where the number of cells counted in the Neubauer chamber after a disruption is NR and before disruption is NT.
Scanning electron microscopy (SEM)
The samples were fixed in conductive adhesive surface and covered with gold in a sputter coater (SCD 050, Baltech, Brazil). A field emission scanning electron microscope (FEG) (JSM6701F, JEOL, Brazil) equipped with X-ray spectroscopy (EDS) microanalysis system, from the UDESC-Joinville Electronic Microscopy Laboratory, was used. The analyses were performed with 15 kV electron acceleration voltages and analyzed in the SEM through images formed by secondary electrons.
Physicochemical characterization
Physicochemical characterization of the samples (NY, MAY, MRY) were carried out after lyophilization, determining: ash content by calcination in a muffle (Q-318M24, Quimis, Brazil), method no. 923.03; lipid content by Soxhlet extractor (LUCA-145/6, Lucadema, Brazil), method no. 945.16ª; moisture content by gravimetric method no. 934.01 using drying oven (Centribio, Cienlab, Brazil). Nitrogen content was determined by the micro Kjeldahl (LUCA-341/02, Lucadema, Brazil), method no. 945.18 and protein content was calculated using the conversion factor of 5.8. Total carbohydrate content was obtained by difference. The same analyses were performed for textured soy protein, acquired at the local market, for comparison purposes (protein conversion factor = 5.46). Analyses were performed in triplicate, according to the methodologies described by AOAC International (2005). The color was determined by colorimetry (EZ 0374 4500L, Hunter Lab MiniScan, Brazil), operating in the CIE (L*a*b*) system. The water activity (aw) at 25 °C was measured in aw determiner (Pre Water Activity Analyzer, Decagon, Brazil).
Functional properties
Emulsifying properties
Emulsifying activity (EA) and emulsion stability (ES) were determined according to the method described by Wang and Kinsella (1976), with minor modifications. Protein suspensions (7% m/v) were prepared in different buffers (pH 5.2, 5.7, 6.2, 6.7 and 7.2) which were dispersed in a mechanical rod stirrer (TE-139, Tecnal, Brazil) at 2600 rpm for 2 min. After dispersion, soybean oil (Soya, Bunge, Brazil) was added to the mixture (1:1 v/v), which was again homogenized in a mechanical rod stirrer at 2600 rpm for 4 min. The emulsion formed was also split into Falcon tubes and centrifuged at 576×g (3200 rpm) for 5 min (Centribio, Cienlab, Brazil). EA was expressed as the ratio between the height of the emulsified layer and the height of the total content in the tube (Eq. 2). ES was determined similarly to the EA, except that the emulsion in the tube was heated in a water bath at 80 °C (Dubnoff LUCA 157/28, Lucadema, Brazil) for 30 min and subsequently cooled in running water for 15 min prior to centrifugation. Stability of the emulsion was determined by the ratio between the height of the emulsified layer after heating and the height of the total content in the tube (Eq. 3):
| 2 |
| 3 |
Textured Soy Protein (TSP) has shown no emulsifying activity at the protein concentration used and, consequently, emulsion stability data were not determined for it either.
Foam properties
Foaming ability (FA) and foam stability (FS) were determined using the method by Malik et al. (2017), adapted. Protein solution (3% m/v) in pHs 5.2, 5.7, 6.2, 6.7 and 7.2 was dispersed in a mechanical rod stirrer (TE-139, Tecnal, Brazil) at maximum speed (2600 rpm) during 5 min. All contents were immediately transferred to a Becker and the foam volume was measured. Volume increase percentage was calculated based on the solution initial volumes and after forming the foam, according to Canella (1978). Change in foam volume was measured at time zero and 30 min after, indicating foam stability.
Textured Soy Protein (TSP) has shown no foaming ability at the protein concentration used and, consequently, foam stability data were not determined for it either.
Water absorption capacity (WAC)
For the determination of WAC, the methodology described by Malik et al. (2017) was used, with minor modifications. The sample mass, equivalent to 1 g of protein, was mixed with 10 mL of distilled water and homogenized for 1 min in the vortex (Phoenix Luferco AP56, Tecnal, Brazil) at maximum speed and room temperature (20 ± 2 °C). The mixture was allowed to stand for 30 min and then centrifuged at 894×g (4000 rpm) for 30 min (Centribio, Cienlab, Brazil). The supernatant was discarded and the tubes were inverted at 45° for 25 min to drain the remaining liquid from the protein sediment. Water absorption capacity was calculated as:
| 4 |
where a is the mass of the wet sample tube after draining the liquid; b is the mass of the dried sample tube; c is the sample mass equivalent to 1 g protein.
Oil holding capacity (OHC)
For the determination of OHC, the methodology described by Wasswa et al. (2007) was used, with adaptations. In a Falcon tube, the sample mass, equivalent to 0.5 g of protein, was quantified and 10 mL of soybean oil (Soya, Bunge, Brazil) were added. The mixture was homogenized for 30 s in the vortex (Phoenix Luferco AP56, Tecnal, Brazil) twice at full speed and room temperature (20 ± 2 °C). The oil dispersion was centrifuged (Centribio, Cienlab, Brazil) for 30 min at 894×g (4000 rpm). Afterward, the separate oil volume was determined and the OHC was calculated as the volume (mL) of oil absorbed per mass of protein (g).
Water holding capacity (WHC) and index of water solubility (IWS)
WHC and IWS were determined according to Anderson et al. (1969), adapted. The sample mass was quantified in an amount equivalent to 2.5 g (dm) of protein and mixed in 30 mL of distilled water. The mixture was kept under stirring for 30 min at 300 rpm and 20 °C (Luca-223, Lucadema, Brazil) and then centrifuged (Centribio, Cienlab, Brazil) at 894×g (4000 rpm) for 30 min. The sediment was quantified and in the supernatant, the dry residue (soluble solids) was determined after drying in an oven at 105 °C until constant mass. The indices were calculated according to Eqs. 5 and 6.
| 5 |
| 6 |
In vitro digestibility
The nutritional evaluation was performed by determining in vitro digestibility, proposed by Sgarbieri (1996). Initially, an amount of sample equivalent to 0.5 g of protein was quantified. A solution of 1.5 mg of pepsin per mL of 0.1 N HCl was prepared, adding 15 mL of this solution to the sample. Afterward, 0.5 mL of colorless thimerosal (USP) (or thiomersal (INN); Merthiolate™) solution were added, manually homogenized and taken to a water bath (Dubnoff LUCA 157/28, Lucadema, Brazil) at 37 °C for 3 h, with periodic stirring. Subsequently, the tubes containing the samples were cooled and the pH adjusted to 8.0 with a 0.2 N NaOH solution. A solution of 0.5 mg mL−1 of pancreatin was prepared with pH 8.0 phosphate buffer. 10 mL of the pancreatin solution was added to the pepsin hydrolyzed product and returned to the 37 °C (Dubnoff LUCA 157/28, Lucadema, Brazil) water bath for 24 h with periodic stirring (every 5 h). After the hydrolysis time, 5 mL of 5% TCA solution [trichloroacetic (trichloroethanoic) acid] were added to the sample and centrifuged (Centribio, Cienlab, Brazil) for 15 min at 5000×g (9500 rpm) for separation of the insoluble material. The filtrate was collected to determine the digested nitrogen by the micro Kjeldahl method (AOAC 2005). In vitro digestibility was expressed as the percentage of nitrogen digested in relation to the total nitrogen in the initial sample, according to Eq. 7.
| 7 |
Statistical analysis
The statistical evaluation of the data obtained in triplicate was performed with the STATISTICA 13.2 Trial Software (Statsoft®) by analysis of variance (ANOVA) and Tukey’s test at 5% of significance.
Results and discussion
Physicochemical characterization, disruption efficiency and scanning electron microscopy (SEM)
Table 1 presents the results obtained in the physicochemical characterization for natural yeast (NY), yeast subjected to cellular disruption with ultrasound (mechanically ruptured yeast; MRY), yeast subjected to NaCl and ethanol modified autolysis (MAY) and textured soy protein (TSP).
Table 1.
Physicochemical characterization of natural yeast (NY), mechanically ruptured yeast (MRY), modified autolysis yeast (MAY), textured soy protein (TSP) and colorimetric parameters of the samples
| Component (g/100 g of DB) | Composition | |||
|---|---|---|---|---|
| NY | MRY | MAY | TSP | |
| Protein | 42.83 ± 0.11a | 43.80 ± 0.62a | 39.32 ± 0.87b | 42.81 ± 1.03a |
| Total lipids | 1.45 ± 0.40ab | 2.04 ± 0.41a | 1.25 ± 0.48b | 0.14 ± 0.00c |
| Ashes | 1.74 ± 0.17c | 2.36 ± 0.30c | 13.14 ± 0.67a | 6.77 ± 0.05b |
| Moisture | 0.07 ± 0.00d | 0.10 ± 0.00b | 0.09 ± 0.00c | 0.14 ± 0.00a |
| Total carbohydrates | 53.91 | 51.70 | 46.48 | 48.64 |
| Water activity | 0.161 ± 0.044a | 0.172 ± 0.008a | 0.194 ± 0.010a | – |
| Parameters | Color analysis | ||
|---|---|---|---|
| NY | MRY | MAY | |
| L* | 59.13 ± 0.55a | 59.31 ± 1.79a | 54.77 ± 2.76b |
| a* | 4.52 ± 0.18b | 4.45 ± 0.10b | 5.50 ± 0.47a |
| b* | 16.42 ± 1.60ab | 16.78 ± 1.41a | 15.00 ± 1.24b |
| ΔE | – | 1.77 | 5.26 |
Values expressed as mean ± standard deviation. Different letters on the same row indicate a significant difference (p ≤ 0.05) by the Tukey’s test
DB dry basis
Components that appear in greater quantities for all samples, according to results presented in Table 1 are total carbohydrates and subsequently, the proteins. Protein content for NY, MRY and TSP did not present significant differences between them. Only for MAY, a lower value in protein content was observed. Studies report that the percentage of proteins found for brewing yeast ranges between 32 and 62% (Sgarbieri et al. 1999; Yamada and Sgarbieri 2005; Yamada et al. 2003).
In S. cerevisiae cells, the cell wall is composed of a high-density layer (external) and a less dense layer (internal). The first one consists mainly of mannoproteins (35–40% of the dry matter of the cell wall) and the inner part is composed of polymers of glucose: β(1,3)-and β(1,6)-glucan (50–65% dry matter of the cell wall) (Bzducha-Wróbel et al. 2018). In the soybean proteins are presented significant amounts of oligosaccharides, especially raffinose and stachyose (Karki et al. 2010).
For the total lipid content (Table 1), a statistical difference was observed between the MRY and MAY samples, which did not differ statistically from NY. The lipid content of yeast cells may vary between 0.4 and 8.5% (Sgarbieri et al. 1999; Yamada et al. 2003). The ethereal extract fraction is low and comprises approximately equal proportions of triglycerides and phosphatides (Sarwar et al. 1985). The TSP presented the lowest values between the samples (0.14%), probably due to the process to obtain it.
The ash content differed significantly only for MAY, possibly by the use of NaCl as a plasmolyzing agent in the modified autolysis. Yeast mineral content can reach up to 10% of the cell dry matter, the main components being phosphorus (1516 mg/100 g), potassium (2035 mg/100 g), calcium (147 mg/100 g), magnesium (143 mg/100 g) and selenium (687 μg g−1) (Halász and Lásztity 1991; Yamada and Sgarbieri 2005; Demirci and Pometto 1999). The TSP presented intermediated values for ash (6.77%), being higher when compared with NY (1.74%), probably due to the different origin of the raw material.
Moisture presented a significant difference among samples, being higher for TSP, MRY, followed by MAY and lower for NY. In the treatment of cellular disruption applied in MRY and MAY, both are suspended again in water, while the NY remains concentrated, not undergoing dilution process and with this obtaining, at the end of the lyophilization process, lower water content appears in the final composition. The TSP result was influenced by process production.
The treatment of mechanical rupture did not provide significant variation in the chemical composition of the sample when compared to the natural yeast, whereas the treatment by modified autolysis resulted in a significant decrease in the total nitrogen content and increase of the ash content. According to Oliveira et al. (2010), yeast extract chemical composition depends on several factors, such as substrate quality, culture conditions, and nutrient concentration. For fermentation yeast, another important factor that must be taken into account is the numbers of production cycles that can influence its chemical composition due to successive centrifugations and washes.
The results of the water activity analysis for the different samples (Table 1) showed no significant difference among them, all of them being below 0.2, which are in agreement with dehydrated foods (0.6), making it impossible to grow microorganisms, making food microbiologically stable (Silva and Marsaioli Jr 2003).
From Table 1, it is possible to verify that the luminosity (L*) parameter presented statistical difference only for MAY, indicating a darker shade compared to the other samples. This difference can be justified by the treatment to which the MAY was subjected, and some alteration may occur during the autolysis process carried out at the temperature of 55 °C. For parameter a*, MAY has also differed statistically from the other samples, indicating a less greenish shade. For parameter b* there was a significant difference between MRY and MAY. MRY was more yellowish concerning MAY.
Color variation (ΔE), which relates variation in luminosity (ΔL*), chromaticity a* and b* from the natural yeast (NY) sample, considered as a standard sample in relation to the samples subjected to the disruption treatments (MRY and MAY) was calculated as described by Lopes et al. (2005) (Table 1). For ΔE, according to Francis and Clydesdale (1975), values close to zero indicate that the samples resulted in a product with characteristics similar to the control, and differences, equal to or greater than two, can be considered as a difference between two treatments perceptibly visible to the human eye. Thus, it is observed that the ultrasound treatment (MRY) does not result in perceptible color change comparing to the standard sample (NY). As for the modified autolysis yeast (MAY), it significantly interferes the color sample, differing from the control sample (NY).
Disruption process was monitored by cell counting, before and after the sample rupture. Ultrasound treatment resulted in 42% disruption efficiency, whereas for the treatment of modified autolysis the cells remained unchanged. The micrographs (Fig. 1) obtained from SEM analysis presented important morphological modifications on yeast cell surface due to different cellular disruption process applied to cells. The MAY (E and F) has the surface apparently damaged when compared to the NY (A and B). These deformations may be related to the ethanol toxicity or due to the chemical interaction between the components used in the modified autolysis, which may have caused the roughness of the sample. The MRY (C and D) shows dehydration of the cells more pronounced than the LN, which suggests the rupture of the cell wall and exit of the internal material of the cell due to the treatment with ultrasound. Similar modifications in the cellular surface of S. cerevisiae are related by de Câmara Jr. et al. (2016) when cell osmoporation is used to the encapsulation of water-soluble substances in S. cerevisiae yeasts.
Fig. 1.
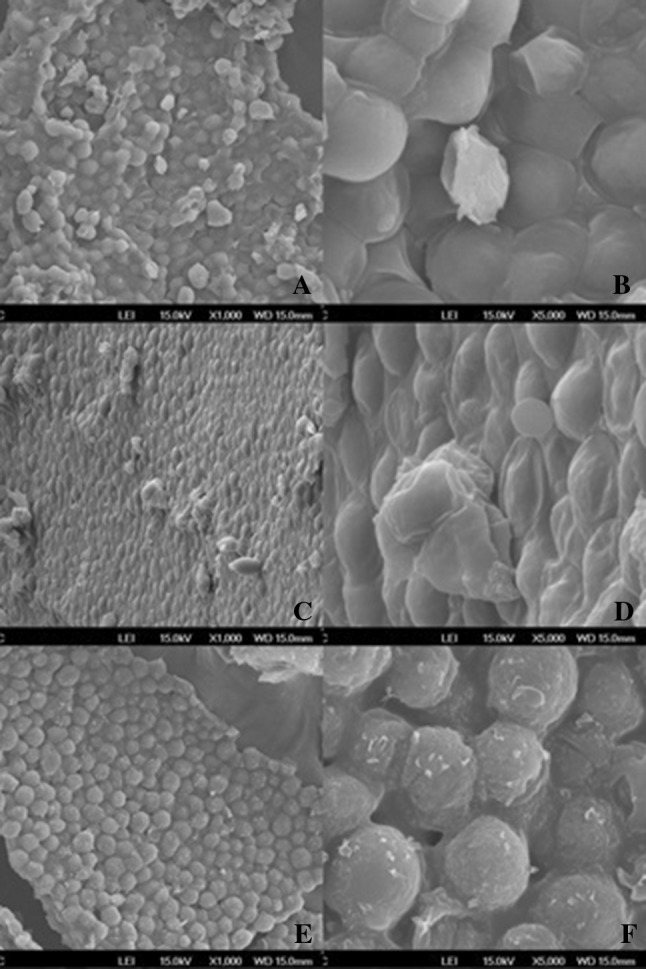
Representative images of S. cerevisiae cells acquired by SEM with increase of 1000 and 5000 times: a, b natural yeast (NY); c, d mechanically ruptured yeast (MRY) and e, f modified autolysis yeast (MAY)
Functional properties
Emulsifying properties
Figure 2 presents results obtained for emulsifying activity (EA) (%) and emulsion stability (ES) (%) for natural yeast (NY), mechanically ruptured yeast (MRY) and modified autolysis yeast (MAY) to each pH value evaluated. Textured Soy Protein (TSP) has shown no emulsifying activity at the protein concentration used and, consequently, emulsion stability data were not determined for it either. Lee and Lee (2009) evaluated the emulsifying activity of TSP treated by proteolytic enzymes at different times of hydrolysis and obtained for control sample (not enzymatically treated) results of 36.82 ± 1.86%. The NY and MRY samples had good emulsifying properties, with an EA of around 50% and ES close to 100%, even higher than the TSP referring to the results found by Lee and Lee (2009).
Fig. 2.
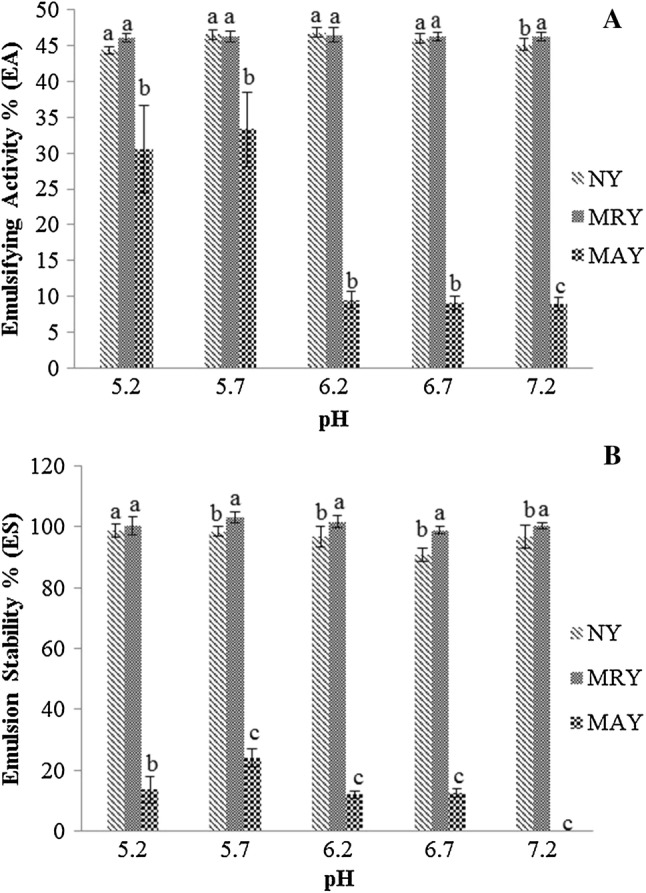
Effect of pH on a emulsifying activity (EA) and b emulsion stability (ES) for different samples of yeast at 7% (m/v) of protein. Values that do not have the same letter are significantly different (p ≤ 0.05)
The EA and ES of MAY differed statistically from the other samples, at the same pH, with much lower results in all pHs evaluated. For MAY, emulsion presented no stability at pH 7.2. NY and MAY presented a significant difference to each pHs, both for EA and ES, showing that the process influenced these properties.
The pH has shown no significant effect on MRY for its emulsifying activity, except for pH 7.2. The ultrasound treatment applied in NY to obtain MRY did not seem to influence positively the emulsifying capacity, considering that the results were statistically similar (Fig. 2a) for majority pHs evaluated. For ES, the MRY presented significant differences from NY for pH upper 5.7–7.2 (Fig. 2b). MAY presented the lowest values of all pHs.
Costa et al. (2012) have studied the extract containing mannoprotein obtained from the Saccharomyces sp. yeast discarded in breweries, which presented good emulsifying properties, with rates of 62.5% of EA and 96% of ES. In another study, high potency in emulsifying ability was observed in yeast and cell wall protein isolates when compared with soy protein isolates at different pH ranges, where the best results were obtained from pH 4.0 (Otero et al. 1996). Although the emulsifying properties of the S. cerevisiae yeast are considered precarious, different parts of the cell wall show the ability to stabilize emulsions (Moreira et al. 2016).
Foaming properties
Foaming ability (FA) and its ability to remain unchanged, detected by the foam stability (FS) after the period of 30 min are in Fig. 3 for the different pHs evaluated from the samples of natural yeast (NY), mechanically ruptured yeast (MRY) and yeast subjected to NaCl and ethanol modified autolysis (MAY). Textured Soy Protein (TSP) has shown no foaming ability at the protein concentration used and, consequently, foam stability data were not determined for it either.
Fig. 3.
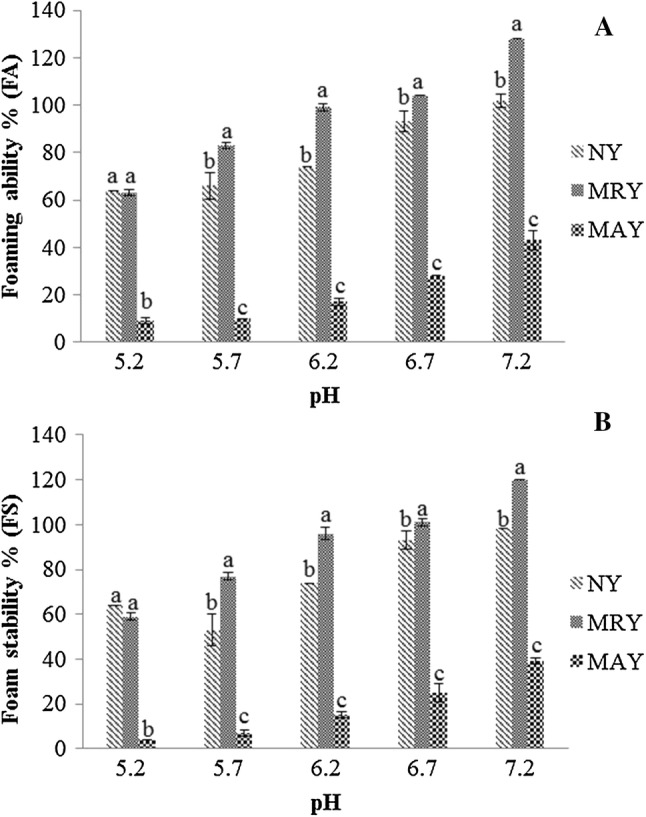
Effect of pH on a foaming ability (FA) and b foam stability (FS) after 30 min for different samples of yeast at 3% (m/v) of protein. Values that do not have the same letter are significantly different (p ≤ 0.05)
It is noted that for all treatments the FA and FS increased pH from 5.2 to 7.2 as they increased solubility by rapidly diffusing the proteins to the surface, unfolding and orienting themselves, consequently, causing the reduction of interfacial tension and allowing to trap a greater amount of gas by the Saccharomyces sp yeast protein film (Pacheco and Sgarbieri 1998).
To FA and FS (Fig. 3a, b) at pH 5.2, the sample NY and MRY presented values with no significant differences while these differed from MAY, which presented the lowest value. To others pHs (5.7, 6.2, 6.7 and 7.2), the samples presented the same behavior, the MRY presented the higher value followed by NY and MAY, with the lowest value of foaming properties.
MRY presented higher results of FA and FS when comparing to the other samples probably due to the concentration and even the composition of the protein itself, which may be influenced by extrinsic factors such as the medium. NY presented intermediate results for FA and FS. In this study, the salts concentration used in the modified autolysis of the MAY possibly provided a reduction in foaming ability and also a decrease in its stability. According to Fennema (2000), the effects of the salt on the foaming properties depend on the type of salt and the solubility characteristics of the protein in the saline solution. For some proteins, such as soybean, the foaming properties improve in the presence of salt, for others, such as whey, the foaming properties worsen with increasing salt concentration, which may have occurred in the present study. This effect is attributed to salting solubility of proteins. Normally, the salts reduce viscosity and stiffness of the protein films by weakening the peptide interactions, which increases the rate of foam volume expansion of certain proteins (Oshodi and Ojokan 1997). Salts at suitable concentrations help foaming ability by preventing and aiding diffusion and expansion of the interface (Sgarbieri 1996).
It is observed that the pH has presented a marked influence on foam properties, particularly stability, by its direct effect on the protein net charge. Foam stability concerns the retention of the maximum volume of foam formed due to the standing time. In turn, it is dependent on the nature of the protein film, which reflects the extent of the interactions within the matrix of that film (Martínez et al. 2016). The foams are more stable in the range of the isoelectric point (4.0) (Reed and Nagodawithana 1991) of the proteins due to the minimal electrostatic repulsion, which promotes a more favorable interaction between protein–protein, forming a viscous film on the interface (Sgarbieri 1996).
Water absorption capacity (WAC), water holding capacity (WHC), oil holding capacity (OHC) and index of water solubility (IWS)
Table 2 presents the results obtained for the water absorption capacity (WAC) per gram of protein, water holding capacity (WHC), oil holding capacity (OHC) per gram of protein and index of water solubility (IWS) for natural yeast (NY), mechanically ruptured yeast (MRY), modified autolysis yeast (MAY) and textured soy protein (TSP).
Table 2.
Water absorption capacity (WAC) (g of water/g of protein), oil holding capacity (OHC) (mL of absorbed oil/g of protein), water holding capacity (WHC) (g of water/g of protein), and index of water solubility (IWS) (%) of natural yeast (NY), mechanically ruptured yeast (MRY), modified autolysis yeast (MAY) and textured soy protein (TSP)
| Samples | WAC (g of water/g of protein) | OHC (mL of oil/g of protein) | WHC (g of water/g protein) | IWS (%) |
|---|---|---|---|---|
| NY | 4.45 ± 0.02a | 8.44 ± 0.10b | 7.69 ± 0.17c | 12.61 ± 0.94d |
| MRY | 3.98 ± 0.02b | 8.82 ± 0.20a | 7.69 ± 0.31c | 29.66 ± 0.91b |
| MAY | 3.58 ± 0.01c | 7.82 ± 0.13c | 14.50 ± 0.04a | 64.02 ± 0.30a |
| TSP | 4.51 ± 0.01a | 4.28 ± 0.12d | 8.69 ± 0.13b | 27.21 ± 0.52c |
Mean ± standard deviation. Different letters in the same column indicate significant statistical differences (p ≤ 0.05) among samples
The highest WAC was presented by the TSP and NY, suggesting that both presented the same WAC. MRY and MAY presented values lower than TSP and NY. Therefore, the WAC of MRY was influenced by the treatment it was subjected, being lower for MAY, possibly due to NaCl added, which caused a reduction in the amount of water bound. Salt influences in the dielectric constant of the medium and forms a barrier of ions around the molecule, interfering in its interaction with water molecules. Besides, the temperature of 55 °C applied in the treatment of MAY may have influenced the stability of the secondary and tertiary structures of the polypeptides that begin to dissolve at temperatures above 50 °C, which increases the surface hydrophobicity of the protein (Garba and Kaur 2014).
Chaud and Sgarbieri (2006) have evaluated the WAC of the cell wall and fractions of the cell wall (glycoprotein, mannan, insoluble glycan and soluble glycan) of the Saccharomyces sp. yeast and have observed that the results showed a significant difference for each fraction, ranging from 0.03 for cell wall and 1.53 for soluble glycan (mL of water/g sample), showing a strong hydrophilic attraction between protein and water. According to Halász and Lásztity (1991), the water uptake of concentrates and yeast protein isolates ranges between 3.0 and 4.0 mL g−1 of sample.
The highest OHC was presented by MRY, followed by NY and then by MAY and TSP. Results (Table 2) show that NY present OHC higher than TSP and that the treatment with ultrasound has significantly improved OHC of NY, probably due to hydrolysis of the protein and exposure of hydrophobic groups (glycine, alanine, valine, leucine, isoleucine, phenylalanine). However, MAY reduced OHC of NY, probably due to exposure of the hydrophilic groups of the protein molecule during the process of autolysis, decreasing the affinity with the oil (Halász and Lásztity 1991). Otero et al. (1996) have observed that the ability of the yeast protein concentrate (72% protein w/w) to absorb oil was approximately three times the value of the soy protein isolate.
TSP presented low lipophilic attraction and high hydrophilic attraction, probably related to its hydrophilic surface nature. NY presented WAC similar and high OHC when compared to TSP, which may be interesting for its application in food. OHC has great importance in the formulation of food, which can influence the order of addition of dry ingredients in the mixture, besides influencing the mixing times for a uniform distribution of oil or fat in a dry mixture (Chaud and Sgarbieri 2006). The MRY may be indicated for application in formulated food with high oil content.
NY and MRY presented lower WHC when compared to MAY and TSP. MRY, although presented low WHC, presented the second highest IWS because it is easily hydrated (soluble) in water, possibly because the ultrasound treatment caused the exposure of the hydrophilic groups of the protein molecule. MAY presented higher WHC and the highest IWS because they are easily hydrated in water (Chaud and Sgarbieri 2006), mainly due to the presence of salt. Also, the autolysis process may have exposed the hydrophilic groups of the protein molecule, such as polar amino acids (Martínez et al. 2016).
According to Sgarbieri (1996), yeast proteins are predominantly insoluble or very little soluble in water. However, solubility is greatly enhanced by the addition of neutral salts such as NaCl, which may justify the high IWS (greater than 64%) obtained in this study for the MAY.
In a study carried by Pacheco and Sgarbieri (1998), adding 0.1 M and 1.0 M of NaCl to the Saccharomyces sp. yeast protein concentrate sample has caused a significant reduction in the amount of water bound, reducing from 10.57 to 5.18 g and 4.37 g of water/g of protein, respectively, in pH 6.0. WHC loss may be due to the reduction in electrostatic repulsion between the phosphate groups present in the yeast caused by the presence of salt in lower concentrations and decrease in protein hydration caused by higher concentrations (Martínez et al. 2016).
Results obtained by Yamada and Sgarbieri (2005) for the WHC of yeast protein concentrate and TSP were close to those found in this study, being 9.16 g water/g protein and 10.22 g water/g protein, respectively, both in pH 7.0.
Pacheco and Sgarbieri (1998) have compared the yeast protein WHC for samples of concentrated nucleoproteins, protein concentrate treated with sodium perchlorate and protein concentrate treated with sodium trimetaphosphate and have obtained results of 3.71, 4.30, 5.11 (g water/g protein), respectively, in pH 5.0. The authors have observed an increasing WHC with rising pH, which can be attributed to groups of ionized phosphates that bind more water than nonionizing phosphates.
In vitro digestibility
The results of digestibility (%) for natural yeast (NY), mechanically ruptured yeast (MRY), modified autolysis yeast (MAY) and textured soy protein (TSP) were 95.29 ± 0.07, 95.59 ± 0.52, 94.62 ± 0.67 and 95.69 ± 0.36, respectively. No significant statistical differences (p ≤ 0.05) was observed among samples, suggesting that yeast presents high digestibility values, higher than 94%, as TSP. Besides, MAY and MRY samples presented digestibility similar to NY, indicating no influence of disruption process.
Due to its low molecular weight (15–64 kDa), yeast is easily digested by enzymes in the digestive tract, increasing its absorption and nutritional value (da Araújo et al. 2014). Pacheco et al. (1997) have evaluated the in vitro digestibility of yeast biomass and protein concentrate (casein). The data presented showed that in vitro protein digestibility was lower for total biomass (83%) and very high (up to 91.7%) for protein concentrate, indicating interference of cell wall components in the proteolytic action of digestive enzymes. The digestibility was not significantly different between protein concentrate and casein.
Conclusion
Protein derived from unicellular microorganisms is an alternative nonconventional source and can replace high-cost or allergenic proteins. Natural yeast (NY), mechanically ruptured yeast (MRY) and modified autolysis yeast (MAY) with NaCl and ethanol presented a very close composition with the protein content, ranging from 39.32 to 43.80%, total lipids of 1.25–2.04% and moisture of 0.07–0.10% (after lyophilization). MRY presented higher foaming ability and foam stability as well as greater oil holding capacity. MAY presented greater water holding capacity and index of water solubility. NY together with TSP presented the highest results for water absorption capacity. Regarding emulsifying properties, NY and MRY presented the highest results, with no statistical difference between the two samples. In vitro digestibility of brewing yeast samples equated the digestibility of TSP (higher than 94%), characterizing yeast protein as a satisfactory nutritional and functional supplement. The results obtained in this study demonstrate that yeast can be considered an excellent source of protein and therefore the applied cellular rupture treatment can significantly influence the functional properties of this byproduct, being able to present relevant technological potential and, consequently, viability for food application. Depending on the intended application, yeast can be used in its natural form, dismissing any kind of physical or chemical treatments.
Acknowledgements
This study was financed in part by the Coordenação de Aperfeiçoamento de Pessoal de Nível Superior—Brazil (CAPES)—Finance Code 001 and by FAPESC (Fundação de Amparo à Pesquisa e Inovação do Estado de Santa Catarina—Grant: 2015TR295).
Footnotes
Publisher's Note
Springer Nature remains neutral with regard to jurisdictional claims in published maps and institutional affiliations.
Contributor Information
Angélica Patrícia Bertolo, Phone: +55 (49) 9 9907 2953, Email: angelica_bertolo@hotmail.com.
Ana Paula Biz, Phone: +55 (47) 9 9742 8187, Email: anapbiz@gmail.com.
Aniela Pinto Kempka, Phone: +55 (49) 9 8809 2660, Email: aniela.kempka@udesc.br.
Elisandra Rigo, Phone: +55 (54) 9 9978 9339, Email: elisandra.rigo@udesc.br.
Darlene Cavalheiro, Phone: +55 (48) 9 9963 1095, Email: darlene.cavalheiro@udesc.br.
References
- Anderson RA, Conway HF, Pfeifer UF, Griffin EL., Jr Gelatinization of corn grits by roll and extrusion cooking. Cereal Sci Today St. Paul Minn. 1969;14(1):4–11. [Google Scholar]
- AOAC . Official methods of analysis of the Association Analytical Chemists. 18. Maryland: Gaithersburg; 2005. [Google Scholar]
- Babayan TL, Bezrukov MG, Latov VK, Belikov VM, Belavtseva EM. Induced autolysis of Saccharomyces cerevisae: morphological effects, rheological, effects, and dynamics of accumulation of extracellular hydrolysisproducts. Curr Microbiol New York. 1981;5(3):163–168. doi: 10.1007/BF01578522. [DOI] [Google Scholar]
- Bzducha-Wróbel A, Błażejak S, Kieliszek M, Pobiega K, Falana K, Janowicz M. Modification of the cell wall structure of Saccharomyces cerevisiae strains during cultivation on waste potato juice water and glycerol towards biosynthesis of functional polysaccharides. J Biotechnol. 2018;281:1–10. doi: 10.1016/j.jbiotec.2018.06.305. [DOI] [PubMed] [Google Scholar]
- Canella M. Whipping properties of sunflower proteins dispersions. Food Sci Technol. 1978;11:259–260. [Google Scholar]
- Charpentier C, Nguyen Van Long T, Bonaly R, Feuillat M. Alteration of cellwall structure in Saccharomyces cerevisiae and Saccharomyces bayanus duringautolysis. Appl Microbiol Biothecnol. 1986;24(5):405–413. doi: 10.1007/BF00294598. [DOI] [Google Scholar]
- Chaud SG, Sgarbieri VC. Propriedades funcionais (tecnológicas) da parede celular de leveduras da fermentação alcoólica e das frações glicana, manana e glicoproteína. Ciência e Tecnologia de Alimentos Campinas. 2006;26(2):369–379. doi: 10.1590/S0101-20612006000200020. [DOI] [Google Scholar]
- Costa AG, Magnani M, Castro-Gomez RJH. Obtenção e caracterização de manoproteínas da parede celular de leveduras de descarte em cervejaria. Acta Scientiarum. Biol Sci. 2012;34(1):77–84. [Google Scholar]
- da Araújo VBS, de Melo ANF, Costa AG, Castro-Gomez RH, Madruga MS, de Souza EL, Magnani M. Followed extraction of β-glucan and mannoprotein from spent brewer’s yeast (Saccharomyces uvarum) and application of the obtained mannoprotein as a stabilizer in mayonnaise. Innov Food Sci Emerg Technol. 2014;23:164–170. doi: 10.1016/j.ifset.2013.12.013. [DOI] [Google Scholar]
- de Câmara AA, Jr DupontS, Beney L, Gervais P, Rosenthal A, Correia RTP, Pedrini MRS. Fisetin yeast-based bio-capsules via osmoporation: effects of process variables on the encapsulation efficiency and internalized fisetin content. Appl Microbiol Biotechnol. 2016;100(12):5547–5558. doi: 10.1007/s00253-016-7425-8. [DOI] [PubMed] [Google Scholar]
- Demirci A, Pometto AL. Production of organically bound selenium yeast by continuous fermentation. J Agric Food Chem. 1999;47(6):2491–2495. doi: 10.1021/jf981198y. [DOI] [PubMed] [Google Scholar]
- Fennema OR. Química de los Alimentos. 1. Zaragoza: Acribia; 2000. p. 1280. [Google Scholar]
- Francis FJ, Clydesdale FM. Food colorimetry: theory and applications. Wesport: AVI; 1975. [Google Scholar]
- Garba U, Kaur S. Protein isolates: production, functional properties and application. Int J Curr Res Rev. 2014;6(3):35–45. [Google Scholar]
- Halász A, Lásztity R. Use of yeast biomass in food production. Boca Raton: CRC Press; 1991. p. 312. [Google Scholar]
- Hellborg L, Piskur J. Yeast diversity in the brewing industry. In: Preedy VR, editor. Beer in health and disease prevention. New York: Elsevier; 2009. pp. 1068–1073. [Google Scholar]
- Karki B, Lamsal BP, Jung S, Van Leeuwen J, Pometto AL, Grewell D, Khanal SK. Enhancing protein and sugar release from defatted soy flakes using ultrasound technology. J Food Eng. 2010;96(2):270–278. doi: 10.1016/j.jfoodeng.2009.07.023. [DOI] [Google Scholar]
- Lee MK, Lee SY. The quality characteristics of Soy Wan-Jas made with different proteolytic enzyme treated textured soy proteins. Appl Biol Chem. 2009;52(6):708–715. [Google Scholar]
- Lee SS, Robinson FM, Wang HY. Rapid determination of yeast viability. Biotechnol Bioeng Symp. 1981;11:641–649. [Google Scholar]
- Lopes AS, Mattietto RA, Menezes HC. Estabilidade da polpa de pitanga sob congelamento. Ciência e Tecnologia de Alimentos, Campinas. 2005;25(3):553–559. doi: 10.1590/S0101-20612005000300026. [DOI] [Google Scholar]
- Malik MA, Sharma HK, Saini CS. High intensity ultrasound treatment of protein isolate extracted from dephenolized sunflower meal: effect on physicochemical and functional properties. Ultrason Sonochem. 2017;39:511–519. doi: 10.1016/j.ultsonch.2017.05.026. [DOI] [PubMed] [Google Scholar]
- Martínez JM, Cebrián G, Álvarez I, Raso J. Release of Mannoproteins during Saccharomyces cerevisiae autolysis induced by pulsed electric field. Front Microbiol. 2016;7:1475. doi: 10.3389/fmicb.2016.01435. [DOI] [PMC free article] [PubMed] [Google Scholar]
- Moreira TCP, da Silva VM, Gombert AK, da Cunha RL. Stabilization mechanisms of oil-in-water emulsions by Saccharomyces cerevisiae. Colloids Surf Biointerfaces. 2016;143:399–405. doi: 10.1016/j.colsurfb.2016.03.043. [DOI] [PubMed] [Google Scholar]
- Mussatto SI, Dragone G, Roberto IC. Brewers’ spent grain: generation, characteristics and potential application. J Cereal Sci. 2006;43(1):1–14. doi: 10.1016/j.jcs.2005.06.001. [DOI] [Google Scholar]
- Oliveira MS, Feddern V, Kupski L, Cipolatti EP, Badiale-Furlong E, de Souza-Soares LA. Physico-chemical characterization of fermented rice bran biomass. J Food. 2010;8(3):229–236. [Google Scholar]
- Oshodi AA, Ojokan E. Effect of salts on some of the functional properties of bovine plasma protein concentrate. Food Chem. 1997;59(3):333–338. doi: 10.1016/S0308-8146(96)00102-1. [DOI] [Google Scholar]
- Otero MA, Vasallo MC, Verdieia O, Fernandez V, Betancourt D. A process for the complete fractionation of baker’s yeast. J Chem Technol Biotechnol. 1996;67(1):67–71. doi: 10.1002/(SICI)1097-4660(199609)67:1<67::AID-JCTB501>3.0.CO;2-O. [DOI] [Google Scholar]
- Pacheco MTB, Sgarbieri VC. Hydrophilic and rheological properties of Brewer’s yeast protein concentrates. J Food Sci. 1998;63(2):238–243. doi: 10.1111/j.1365-2621.1998.tb15717.x. [DOI] [Google Scholar]
- Pacheco MTB, Caballero-Cordoba GM, Sgarbieri VC. Composition and nutritive value of yeast biomass and yeast protein concentrates. J Nutr Sci Vitaminol Tokyo. 1997;43(6):601–612. doi: 10.3177/jnsv.43.601. [DOI] [PubMed] [Google Scholar]
- Ramos GRV, Birchal VS, Seara LM, Pereira FD, Alvisi P. Caracterização química do autolisado de levedura de alambique e avaliação da aceitabilidade do pão de queijo adicionado do autolisado desidratado. Revista de Nutrição Campinas. 2011;24(3):473–484. doi: 10.1590/S1415-52732011000300010. [DOI] [Google Scholar]
- Reed G, Nagodawithana TW. Yeast technology. 2. New York: Van Nostrand Reinhold; 1991. p. 378. [Google Scholar]
- Sarwar G, Shah BG, Mongeau R, Hoppner K. Nucleic acid, fiber and nutrient composition of intactive dried food yeast products. J Food Sci. 1985;50:353–357. doi: 10.1111/j.1365-2621.1985.tb13400.x. [DOI] [Google Scholar]
- Sgarbieri VC (1996) Proteínas em Alimentos Protéicos. Propriedades – Degradações – Modificações. Livraria Varela, São Paulo
- Sgarbieri VC, Alvim ID, Vilela ES, Baldini VL, Bragagnolo N. Produção Piloto de Derivados de Levedura (Saccharomyces sp.) para Uso como Ingrediente na Formulação de Alimentos. Braz J Food Technol. 1999;2(1–2):119–125. [Google Scholar]
- Silva FA, Marsaioli A., Jr Atividade de água em amêndoas de castanha do Brasil (Bertholletia excelsa) secas por micro-ondas e convencionalmente. Revista Ciências Exatas e Naturais Campinas. 2003;5(1):23–32. [Google Scholar]
- Stewart GG. Saccharomyces species in the Production of Beer. Beverages. 2016;2(4):34. doi: 10.3390/beverages2040034. [DOI] [Google Scholar]
- Wang JC, Kinsella JE. Functional properties of novel proteins: Alfalfa Leaf protein. J Food Sci. 1976;41:286–292. doi: 10.1111/j.1365-2621.1976.tb00602.x. [DOI] [Google Scholar]
- Wasswa J, Tang J, Gu X, Yuan X. Influence of the extent of enzymatic hydrolysis on the functional properties of protein hydrolysate from grass carp (Ctenopharyngodon idella) skin. Food Chem. 2007;104(4):1698–1704. doi: 10.1016/j.foodchem.2007.03.044. [DOI] [Google Scholar]
- Yamada EA, Sgarbieri VC. Yeast (Saccharomyces cerevisiae) protein concentrate: preparation, chemical composition, and nutritional and functional properties. J Agric Food Chem. 2005;53(10):3931–3936. doi: 10.1021/jf0400821. [DOI] [PubMed] [Google Scholar]
- Yamada EA, Alvim ID, Santucci MCC, Sgarbieri VC (2003) Composição centesimal e valor protéico de levedura residual da fermentação etanólica e de seus derivados. Revista Nutrição. Instituto de Tecnologia de Alimentos Campinas 16(4):423–432