

Abstract
Background
MicroRNAs (miRNAs) regulate gene expression in physiological as well as in pathological processes, including chronic pain. Whether deletion of a gene can affect expression of the miRNAs that associate with the deleted gene mRNA remains elusive. We investigated the effects of brain-derived neurotrophic factor (Bdnf) gene deletion on the expression of miR-1 in dorsal root ganglion (DRG) neurons and its pain-associated downstream targets heat shock protein 60 (Hsp60) and connexin 43 (Cx43) in tamoxifen-inducible conditional knockout mice, Bdnffl/fl; Advillin-CreERT2 (Bdnf cKO).
Results
Efficient Bdnf gene deletion was confirmed in DRG of Bdnf cKO mice by Real-Time qRT-PCR and ELISA 10 days after completed tamoxifen treatment. In DRG, miR-1 expression was reduced 0.44-fold (p < 0.05; Real-time qRT-PCR) in Bdnf cKO compared to floxed wildtype littermate control Bdnffl/fl mice (WT). While Hsp60 protein expression was increased 1.85-fold (p < 0.05; Western blot analysis), expression levels of Cx43 and the miR-1-associated transcription factors MEF2a and SRF remained unchanged. When analyzing Bdnf cKO mice 32 days after complete tamoxifen treatment to investigate whether observed expression alterations remain permanently, we found no significant differences between Bdnf cKO and WT mice. However, miRNA microarray analysis revealed that 167 miRNAs altered (p < 0.05) in DRG of these mice following Bdnf gene deletion.
Conclusions
Our results indicate that deletion of Bdnf in DRG neurons leads to a temporary dysregulation of miR-1, suggesting an impairment of a presumable feedback loop between BDNF protein and its targeting miR-1. This appears to affect its downstream protein Hsp60 and as a consequence might influence the phenotype after inducible Bdnf gene deletion. While this appears to be a MEF2a-/SRF-independent and transient effect, expression levels of various other miRNAs may remain permanently altered.
Keywords: microRNA, miR-1, Bdnf, Gene deletion, BDNF-Advillin-Cre-ERT2, Neuropathic pain, Dorsal root ganglion
Highlights
-
•
Transgenic deletion of Bdnf in DRG neurons leads to dysregulation of miR-1.
-
•
This points to a feedback loop between BDNF protein and its targeting miR-1.
-
•
miR-1 regulated proteins like Hsp60 are affected by this transient dysregulation.
-
•
Moreover, expression levels of various other miRNAs may remain permanently altered.
-
•
This might influence the phenotype after inducible Bdnf gene deletion.
1. Background
MicroRNAs (miRNAs) have attracted attention in basic pain research due to their dysregulation in chronic pain states (Elramah et al., 2014, Kress et al., 2013, Zhao et al., 2010). This class of small non-coding RNA molecules modulates gene expression by posttranscriptional silencing of target mRNAs (Bartel, 2004). Differential expression of proteins and altered gene regulation may arise as a consequence of neuropathic pain (Costigan et al., 2009) which results from a lesion or dysfunction affecting the somatosensory system (Treede et al., 2008). To this day, for most individual miRNAs, their roles in specific gene regulation in the context of chronic pain remain elusive.
Brain-derived neurotrophic factor (BDNF) is a member of the neurotrophin family (Huang and Reichardt, 2003). The protein is critically involved in pathological nociceptive processes such as neuropathic pain (Coull et al., 2005). It has been demonstrated previously that microRNA-1 (miR-1) negatively regulates BDNF expression by directly targeting the 3′ untranslated region (UTR) of Bdnf mRNA (Brandenburger et al., 2014, Varendi et al., 2014). Important insights in understanding Bdnf gene function in nociception were provided by studies using various transgenic knockout mice (MacQueen et al., 2001, Zhao et al., 2006). Whether gene deletion in transgenic mice in general has an impact on corresponding miRNAs is completely unknown. In this study we asked whether neuron-specific deletion of BDNF in DRG affects its interaction with miR-1.
To address this question, we used DRG neuron-specific, tamoxifen-inducible adult Bdnf conditional knockout mice (Bdnffl/fl; Advillin-CreERT2) with an early (on day 10) and late (on day 32) time point after completion of tamoxifen induction treatment. This tissue-specific gene deletion was achieved by crossing Bdnffl/fl mice that carried a loxP-flanked Bdnf gene with Bdnffl/fl; Advillin-CreERT2 mice expressing the Cre recombinase driven by the promotor of Advillin gene, which is a peripheral sensory neuron-specific marker. It is important to note that Advillin-CreERT2 transgenic mice showed no neuronal cell loss and displayed a normal phenotype in various pain models (Lau et al., 2011). We hypothesize a positive regulatory loop from BDNF protein towards miR-1 suggesting this feedback mechanism being altered in an inducible BDNF knockout mouse strain. Thus, we asked whether Bdnf gene deletion affects the positive feedback loop resulting in an altered miR-1 expression. In addition, there is evidence that miR-1 negatively regulates heat shock protein 60 (Hsp60) (Pan et al., 2012, Shan et al., 2010) and connexin 43 (Cx43) (Yang et al., 2007). Interestingly, both proteins are linked to neuropathic pain (Chen et al., 2012, Mor et al., 2011). Recently, we reported that neuropathic pain in rats with chronic-constriction injury is associated with reduced expression of miR-1 and increased levels of Cx43 protein in the injured sciatic nerve (Neumann et al., 2015). Hsp60 was additionally reported to play an important role in neurodegeneration (Lehnardt et al., 2008) and was identified among a group of axonally synthesized proteins in cultures of injury-conditioned adult dorsal root ganglion (DRG) neurons (Willis et al., 2005). Consequently, we analyzed the expression of Hsp60 and Cx43 in Bdnf cKO mice. Finally, we investigated whether transcriptional regulation has an impact on miR-1 and Bdnf gene expression by analyzing the expression of serum response factor (SRF) and myocyte enhancer factor 2 (MEF2a). Both transcription factors have been described to regulate expression of miR-1 (Chen et al., 2006, Simon et al., 2008, Zhao et al., 2005).
In this study, we focus on miR-1 and its interaction with BDNF suggesting their integration in a regulatory positive feedback mechanism. At an early time point after Bdnf gene deletion this positive regulatory loop seems to be interrupted resulting in a downregulation of miR-1. Hence, we describe the impact of the suppressed miRNA expression on its downstream targets Hsp60 and Cx43, which are both associated with neuropathic pain. Finally, we study possible prolongation of changes in expression levels at a later time point after Bdnf gene deletion and provide additional information on further dysregulated miRNAs in these animals.
2. Results
2.1. BDNF expression in Bdnf cKO mice at an early time point after BDNF gene deletion
In the first experimental series, we investigated animals at an early time point after Bdnf gene deletion. Here, tissue was removed on day 10 after the last tamoxifen injection. To quantify Bdnf gene expression changes we performed real-time qRT-PCR on peripheral nerve, DRG and spinal cord tissue. Compared to tamoxifen treated floxed wildtype littermate control Bdnffl/fl mice (WT), Bdnf cKO mice showed a pronounced reduction of Bdnf mRNA in DRG (relative expression 0.31 vs. WT, p < 0.001), while in the sciatic nerve (relative expression 0.74 vs. WT, p = 0.60) and spinal cord (relative expression 1.15 vs. WT, p = 0.14) no expression changes were detectable (Fig. 1A–C). Efficient Bdnf gene alteration on the protein level was confirmed by ELISA in DRG (338 ± 27 pg/mg in cKO vs. 518 ± 32 pg/mg in WT; p < 0.01) whereas BDNF protein expression in the peripheral nerve (187 ± 37 pg/mg in cKO vs. 230 ± 50 pg/mg in WT; p = 0.51) and spinal cord (398 ± 18 pg/mg in cKO vs. 424 ± 35 pg/mg in WT; p = 0.52) remained unchanged (Fig. 1D–F).
Fig. 1.

BDNF expression in adult Bdnf cKO mice at an early time point after BDNF gene deletion.
Quantification of BDNF mRNA in (A) DRG, (B) sciatic nerve and (C) spinal cord with qRT-PCR, presented as relative expression levels (n = 9). ELISA measurements of BDNF in (D) DRG, (E) sciatic nerve and (F) spinal cord (n = 5). White bars represent data from WT mice, while black bars represent data from BDNFAvCreERT2 mice 10 days after the last tamoxifen injection. Data are presented as mean ± SEM. Statistical analysis was performed with unpaired t-test; ***p < 0.001; **p < 0.01.
2.2. miR-1 downregulation in DRG of Bdnf cKO mice at an early time point after Bdnf gene deletion
We next assessed the potential effect on the interaction between miR-1 and BDNF by a hypothesized impaired positive feedback loop due to Bdnf gene deletion. We therefore analyzed the expression of miR-1 in DRG of Bdnf cKO mice on day 10 after completed tamoxifen treatment, which was downregulated to 0.44-fold (p < 0.05) compared to WT (Fig. 2A). By contrast, miR-124a expression levels remained unchanged (0.74-fold vs. WT; p = 0.36) (Fig. 2B). This microRNA has been reported not to interact with BDNF and thus served as a control.
Fig. 2.

miR-1 is downregulated in DRG of adult Bdnf cKO mice at an early time point after BDNF gene deletion. (A) Expression of miR-1 and (B) miR-124a (control) in DRG were detected using qRT-PCR. Data are presented as normalized levels (n = 9). White bars represent data from WT mice, while black bars represent data from BDNFAvCreERT2 mice 10 days after the last tamoxifen injection. Data are presented as mean ± SEM. Statistical analysis was performed with unpaired t-test; *p < 0.05.
2.3. Hsp60 and Cx43 expression in DRG of Bdnf cKO mice at an early time point after Bdnf gene deletion
To address the impact of the downregulated miR-1 expression on its downstream targets we investigated the changes of protein levels of Hsp60 and Cx43. Being involved in nociceptive pathways, both proteins are known to be regulated by miR-1. Western blot analysis revealed a significantly elevated Hsp60 protein expression (1.85-fold; p < 0.05) in DRG of Bdnf cKO mice on day 10 after completed tamoxifen treatment compared to WT (Fig. 3A). The protein level of Cx43 however was not significantly altered (0.76-fold vs. WT; p = 0.32) (Fig. 3B).
Fig. 3.

Hsp60 and Cx43 expression in DRG of adult Bdnf cKO animals at an early time point after BDNF gene deletion (A) Hsp60 and (B) Cx43 protein expression in DRG were determined by Western blot analysis. Data are presented as normalized levels (n = 8). White bars represent data from WT mice, while black bars represent data from BDNFAvCreERT2 mice 10 days after the last tamoxifen injection. Data are presented as mean ± SEM. Statistical analysis was performed with unpaired t-test; *p < 0.05.
2.4. MEF2a and SRF expression in DRG of Bdnf cKO mice at an early time point after Bdnf gene deletion
To study whether MEF2a and SRF contribute to the regulation of miR-1 and its interaction with BDNF we analyzed protein levels of both transcription factors. No significant changes could be determined in DRG of Bdnf cKO mice on day 10 after tamoxifen injection (relative SRF protein expression 0.99 vs. WT; p = 0.99; relative MEF2a protein expression 0.91 vs. WT; p = 0.48) (Supplemental material 1).
2.5. BDNF and miR-1 expression in DRG of Bdnf cKO mice at a late time point after Bdnf gene deletion
To test whether the expression changes observed in the first set of experiments based on an early time point after Bdnf gene deletion are permanent, we next investigated animals at a later timepoint after Bdnf gene deletion. For this purpose, tissue was removed 32 days after the last tamoxifen treatment. Compared to WT controls, Bdnf cKO mutants showed a significant reduction of Bdnf mRNA in DRG (relative expression 0.49 vs. WT; p < 0.05) (Fig. 4).
Fig. 4.
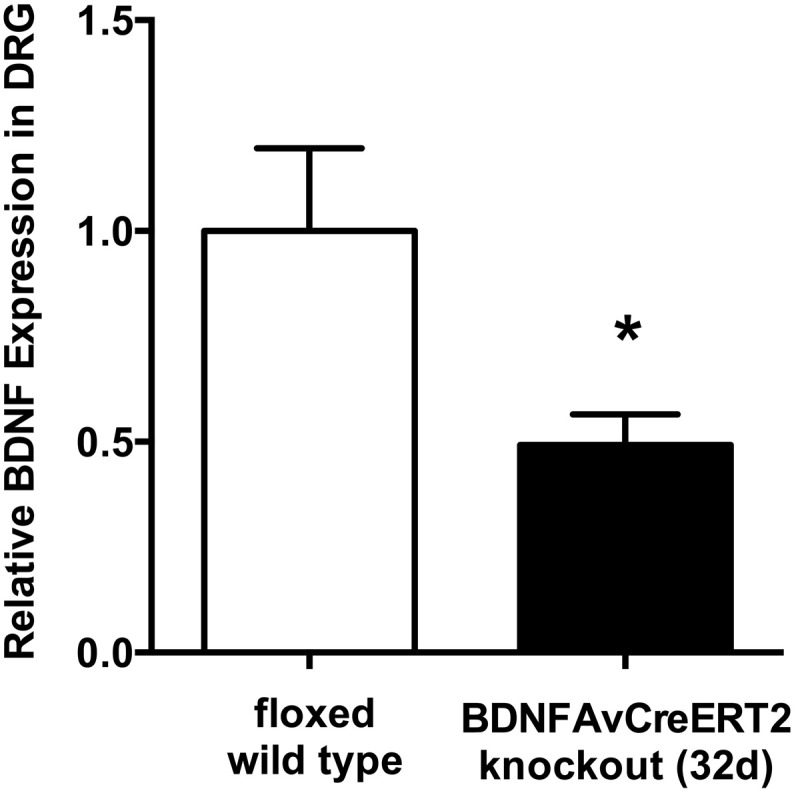
BDNF expression in DRG of adult Bdnf cKO mice at a late time point after BDNF gene deletion. Quantification of BDNF mRNA in DRG with qRT-PCR, presented as normalized levels (n = 5). White bars represent data from WT mice, while black bars represent data from BDNFAvCreERT2 mice 32 days after the last tamoxifen injection. Data are presented as mean ± SEM. Statistical analysis was performed with unpaired t-test; *p < 0.05.
We next examined the expression level of miR-1 in DRG at the later stage after Bdnf gene deletion, which was 0.74-fold as compared with WT controls (p = 0.46) (Fig. 5).
Fig. 5.
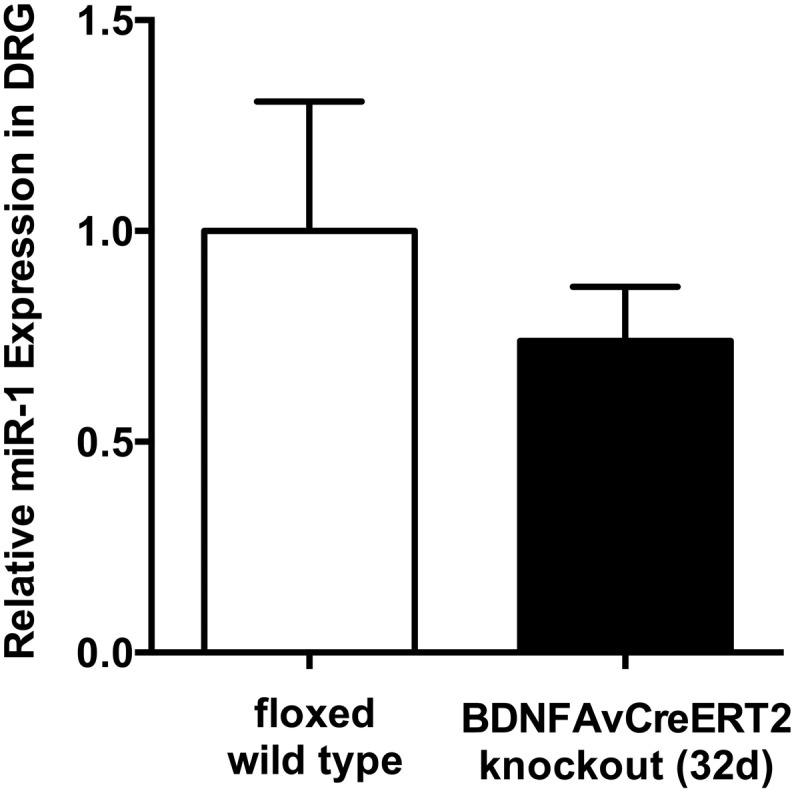
MiR-1 expression changes in DRG of adult Bdnf cKO mice at a late time point after BDNF gene deletion. Expression of miR-1 in DRG using qRT-PCR. Data are presented as normalized levels (n = 5). White bars represent data from WT mice, while black bars represent data from Bdnf cKO mice 32 days after the last tamoxifen injection. Data are presented as mean ± SEM. Statistical analysis was performed with unpaired t-test.
2.6. Hsp60 and Cx43 expression in DRG of Bdnf cKO mice at a late time point after Bdnf gene deletion
In line with the almost unchanged expression of miR-1, upregulation of Hsp60 protein expression (1.50-fold) did not reach significance (p = 0.08) 32 days after Bdnf gene deletion (Fig. 6A). As observed at the early time point, Cx43 protein expression remained unchanged (0.96-fold in Bdnf cKO vs. WT; p = 0.94) (Fig. 6B).
Fig. 6.

Hsp60 and Cx43 expression in DRG of adult Bdnf cKO animals at a late time point after BDNF gene deletion. Hsp60 (A) and Cx43 (B) protein expression in DRG were determined by Western blot analyses. Data are presented as normalized levels (n = 5). White bars represent data from WT mice, while black bars represent data from Bdnf cKO mice 32 days after the last tamoxifen injection. Data are presented as mean ± SEM. Statistical analysis was performed with unpaired t-test.
2.7. Expression analysis of miRNAs in DRG of Bdnf cKO mice at a late time point after Bdnf gene deletion using microRNA microarray
As described above, expression analyses did not show a significant regulation of miR-1, Hsp60 protein and Cx43 protein in Bdnf cKO mice at a late time point after Bdnf gene deletion. We extended our analysis to further investigate whether miRNA-associated effects are exclusive to Bdnf cKO mice at an early stage after Bdnf gene deletion. Using miRNA microarray analysis we detected a total of 167 significantly (p < 0.05) modified mature miRNAs in DRG of Bdnf cKO mice on day 32 after Bdnf gene deletion (Fig. 7A) including 54 miRNAs with an expression change of a minimum of 20% (Fig. 7B). A fraction of 16 of these 54 miRNA alterations were found to be highly significant (p < 0.01). While the expression level of miR-1a-3p, which directly targets the 3′ UTR of Bdnf mRNA, was not altered (relative expression 1.10 vs. WT; p = 0.55) the expression level of miR-1b-3p, which is not known to be involved in BDNF regulation was reduced to 0.80-fold (p < 0.01). Furthermore, we identified the bioinformatically predicted Cx43-linked miR-30f (www.targetscan.org), which was upregulated to 1.21-fold (p < 0.05).
Fig. 7.

MiRNA microarray in DRG of adult Bdnf cKO mice at a late time point after BDNF gene deletion. (A) Hierarchical clustering of differentially expressed microRNAs. 167 miRNAs were significantly dysregulated in DRG of late targeted adult Bdnf cKO mice (p < 0.05). Signal intensities (log2, normalized) are color coded: Green denotes downregulation while red denotes upregulation relative to the median. Statistical analysis was performed using one-way-ANOVA. (B) 54 differentially expressed miRNAs in DRG of late targeted adult Bdnf cKO mice. The shown data required a minimum miRNA expression change of 20% compared to WT mice and are grouped by statistical significance (*p < 0.05; **p < 0.01). Statistical analysis was performed with one-way ANOVA.
3. Discussion
In this study we present essential effects of Bdnf gene deletion in DRG neurons on miRNAs, in particular on expression levels of miR-1 and its downstream targets. For this purpose we have employed DRG-specific and tamoxifen-inducible adult Bdnf cKO mice which yield an attractive approach to investigate BDNF function in pain pathways including neuropathic pain. These DRG-specific conditional BDNF-deficient mice were generated by crossing Bdnffl/fl mice with Advillin-CreERT2 mice expressing tamoxifen-inducible Cre recombinase driven by Advillin promotor. Importantly, the pain phenotype of the Advillin-CreERT2 mice was normal (Lau et al., 2011). We showed that Bdnf gene deletion was restricted to DRG. Bdnf gene expression levels remained unchanged in sciatic nerve and spinal cord tissue. In line with these findings, Advillin gene expression studies by Northern blot analyses and in situ hybridization (Marks et al., 1998) and further histological analyses (Hasegawa et al., 2007) revealed a strong expression and staining, respectively of the promotor in particular in DRG.
Since Bdnf gene expression seems to be regulated by specific miRNAs loss of this neurotrophic factor prompts the question of unforeseen miRNA changes in ablation of Bdnf in the mutant mice. To address this issue, we focused on miR-1 which was previously detected in mouse DRG and localized in sensory neurons (Bastian et al., 2011). Secondly, it has been reported that miR-1 is dysregulated in mouse DRG in different pain states (Kusuda et al., 2011). Thirdly, miR-1 negatively modulates Bdnf gene expression (Brandenburger et al., 2014, Varendi et al., 2014) and inhibits expression of the neuropathic pain-associated proteins Hsp60 and Cx43 (Pan et al., 2012, Shan et al., 2010, Yang et al., 2007). To regulate specific genes, recent studies implicate that microRNAs even participate in feedback or feed forward mechanisms (Tsang et al., 2007). Chen and colleagues identified a negative feedback model in which miR-1 is incorporated to control skeletal muscle gene expression (Chen et al., 2006). In terms of miR-1 and BDNF, we hypothesize a positive regulatory loop from BDNF towards miR-1 (Fig. 8A) suggesting this feedback mechanism becoming interrupted with the loss of BDNF in Bdnf cKO mice (Fig. 8B).
Fig. 8.

Model of miR-1-associated effects in DRG-specific conditional BDNF-deficient mice. (A) miR-1 negatively regulates BDNF and the neuropathic pain-associated proteins Hsp60 and Cx43. Hypothesized positive regulatory loop from BDNF towards miR-1. (B) Hypothesized impairment of the positive feedback loop due to BDNF gene targeting.
In the present study, we first investigated animals at an early time point after Bdnf gene deletion (10 days after the last tamoxifen treatment) and found a remarkable downregulation of miR-1 in DRG compared to WT controls. The altered miR-1 expression may be a consequence of a disturbed positive regulatory loop in conditional Bdnf cKO mice. Given that transcriptional regulation processes are essential for gene activation, inhibition and expression including miRNA expression (Guo et al., 2014, Hobert, 2008) we analyzed the transcriptional factors MEF2a and SRF. Feedback loops between MEF2/SRF and miR-1 have been described earlier (Chen et al., 2006, Zhao et al., 2005) and both proteins are key regulators of neuronal differentiation and mediate growth factor-related functions (Knöll and Nordheim, 2009, Lin et al., 1996). Nonetheless, MEF2a and SRF do not seem to be involved in controlling the interaction between miR-1 and BDNF in Bdnf cKO mice at an early time point after Bdnf gene deletion. However, we reasoned that the suppressed miR-1 might have an impact on its downstream targets Hsp60 and Cx43. Western blot analyses showed an almost twofold increase of Hsp60 expression in DRG of Bdnf cKO animals. The Hsp60 data indicate protein induction resulting from diminished posttranscriptional inhibition due to reduced expression of miR-1. In contrast to that finding, no Cx43 expression changes could be determined. It is tempting to speculate that the discrepancy between Hsp60 and Cx43 data may result from a more complex Cx43 gene structure and regulation (Pfeifer et al., 2004). Not only the length of mouse Cx43 3′ UTR is 1706 nucleotides, but there are 21 bioinformatically predicted miRNA families, which are supposed to interact with Cx43 (www.targetscan.org), including miR-30f, which we found to be increased in DRG at the later timepoint after Bdnf gene deletion. By contrast, the length of mouse Hsp60 3′ UTR is considerably shorter (462 nucleotides). In addition to the miR-1-3p/206/613 family, Hsp60 is predicted to be regulated by eleven other miRNA families conserved in all vertebrates (www.targetscan.org). However, from these only miR-140-3p was detected by the performed miRNA microarray to be affected with a reduced expression in DRG of Bdnf cKO animals (ratio 0.60; p < 0.01), a modification that may contribute to increased expression of Hsp60.
Since the first set of experiments was based on an early time point after Bdnf gene targeting we asked whether the dysregulation of miR-1 and Hsp60 in DRG was permanent. Therefore, we analyzed Bdnf cKO mice 32 days after completion of tamoxifen injections. At this later time point only minor and non-significant alterations of miR-1 and Hsp60 were observed. Cx43 expression remained unmodified. However, these results cannot rule out long-lasting miR dysregulation. To clarify whether miRNA dysregulations after Bdnf gene deletion are temporary and can therefore be generally prevented by investigating Bdnf cKO mice only at a later timepoint after induction of gene deletion, we performed a global miRNA microarray expression analysis. This analysis revealed a total of 167 significant differentially expressed miRNAs in Bdnf cKO mice on day 32 after completed tamoxifen injection providing two pieces of important information. Firstly, the bioinformatically predicted Cx43-associated mir-30f miRNA was significantly upregulated to 1.2-fold. Secondly, microarray analyses revealed a large number of misexpressed miRNAs with other targets than BDNF, Hsp60 or Cx43. Hence, DRG-specific Bdnf gene deletion in Bdnf cKO mice does not lead to permanent dysregulation of the BDNF-targeting miRNA miR-1 and its other targets Hsp60 and Cx43 but seems to be sensitive to significant alteration of various other microRNAs.
4. Conclusion
In summary, we found a significant downregulation of miR-1 in DRG 10 days after Bdnf gene deletion induced by tamoxifen treatment in Bdnf cKO mice, which appears to be MEF2a-/SRF-independent, as well as an upregulation of the neuropathic pain-associated protein Hsp60. We presume a previously unknown feedback mechanism between a manipulated gene (Bdnf) and its regulating miRNA (miR-1) affecting its downstream target (Hsp60) in an early inducible Bdnf cKO. Here, the lack of a protein that serves essential functions in somatosensation may contribute to a specific miRNA-mediated abnormal pain phenotype. These miR-1-associated effects could not be confirmed in Bdnf cKO mice at a later timepoint after Bdnf gene deletion and thus may be transient, although permanent miR dysregulation cannot be excluded. Even at a later timepoint after Bdnf gene deletion, BDNF protein-deficiency still appears to trigger misexpression of multiple other miRNAs. Given the importance of understanding Bdnf gene function in chronic pain conditions by using conditional BDNF knockout, miRNA-associated effects occurring irrespective of the specific targeted gene may be important to consider.
5. Methods
5.1. Animals
All tests were approved by the United Kingdom Home Office Animals (Scientific Procedures) Act 1986. Experiments were conducted using at least 6 weeks old mice of both sexes and identical genetic background (C57BL6/J). The same observer performed all experiments and was blind to the genotype of the animals.
5.2. Generation of Bdnf cKO transgenic mice
Transgenic Bdnffl/fl mice carrying loxP sites flanking the exons 5 in the Bdnf gene were interbred with Advillin-CreERT2 mice expressing a tamoxifen-inducible modified Cre recombinase under the control of the DRG neuron-specific advillin promoter (Lau et al., 2011) to obtain Bdnffl/fl; Advillin-CreERT2 mice. Genotyping of mice for Bdnffl/fl and Cre was performed by standard PCR as previously described (Lau et al., 2011, Zhao et al., 2006). Mice carrying Bdnffl/fl and Advillin-CreERT2 are referred to as ‘Bdnf cKO mice’, the respective Bdnffl/fl; Cre-null mice are called ‘WT mice’, as they are phenotypically normal. To delete the Bdnf gene, the Bdnf cKO and WT control mice were treated with tamoxifen at the age of 8–12 weeks as described (Lau et al., 2011). Mice were housed with a 12-h light/dark cycle and maintained under standard condition (21 ± 1 °C, food and water ad libitum). A five-day treatment with tamoxifen (2 mg per day; intraperitoneal injection) induced a highly specific recombinase activity, which was confined to sensory neurons. The resulting transgenic mice were healthy with no sensory neuron loss. Animals with early and late BDNF gene targeting (10 days and 32 days after induction) and floxed BDNF control littermates were used for the present study.
5.3. RNA isolation
Total RNA of sciatic nerve, dorsal root ganglia and spinal cord tissue was isolated using Trizol reagent (Invitrogen, Carlsbad, USA) according to the manufacturer's protocol. RNA integrity was verified by Agilent microfluid chips using an Agilent 2100 Bioanalyzer (Agilent, USA). All samples in this study showed high quality RNA Integrity Numbers (RIN varied between 7.0 and 7.6). RNA was further analyzed by UV spectrophotometry (Nanodrop, Thermo Scientific, USA) and quantified by a fluorimetric Qubit RNA assay (Invitrogen).
5.4. Microarray based microRNA expression analysis
Biotin labeling of four biological replicates per genotype was performed according to the manufacturer's protocol (FlashTag Biotin HSR RNA Labeling Kit, Affymetrix, Inc.). Briefly, 250 ng of total RNA were ligated to biotin labeled DNA dendrimers after poly(A) tailing. Labeled RNA was hybridized to Affymetrix miRNA 4.0 Microarrays for 18 h at 48 °C, stained by streptavidin/phycoerythrin conjugate and scanned as described in the manufacturer's protocol. Data analyses on Affymetrix CEL files were conducted with Partek Genomics Suite software (vers. 6.6; Partek, Inc.). Probes within each probeset were summarized by means of robust multi-array average algorithm after quantile normalization of probe level signal intensities across all samples to reduce inter-array variability (Bolstad et al., 2003).
5.5. Real-time quantitative reverse-transcriptional polymerase chain reaction of microRNAs
One microgram of total RNA was reverse transcribed using the high capacity RNA-to-cDNA master mix (Applied Biosystems, USA). qPCR assays for mmu-miR-1 (Assay ID: 002222, Applied Biosystems), mmu-miR-124a (Assay ID: 001182, Applied Biosystems) and GAPDH (for normalization, Assay ID: 99999915_g1, Applied Biosystems) were used in accordance with the manufacturer's instructions. qPCR conditions: 50 °C for 2 min, 95 °C for 10 min, 40 cycles of 95 °C for 15 s, 60 °C for 60 s on an Applied Biosystems 7300HT thermocycler (Applied Biosystems). All samples were run in triplicates (miRs) or duplicates (GAPDH). Relative expression was estimated using the ΔΔCt method {Pfaffl, 2001 #2584}.
5.6. Protein isolation and Western blot analyses of Cx43, Hsp60, MEF2a and SRF
To analyze protein expression of Cx43, Hsp60, MEF2a and SRF in transgenic mice, DRG samples were pulverized, homogenized in a buffer of pH 8.0 (50 mM Tris, 150 mM NaCl, 1% NP40, 0.5% Na-Deoxycholat, 0.1% SDS, 40 μl/ml Complete) and centrifuged at 4 °C, 8000 g for 10 min. The supernatant was collected and the protein content was measured according to Lowry et al. Equal amounts of protein (40 μg per lane) were separated by Sodium dodecyl sulfate polyacrylamide gel electrophoresis. The gel was run for 85 min at a constant current of 100 V and the proteins were transferred to a polyvinylidene difluoride membrane at 220 mA for 60 min. The membrane was blocked with 5% dried skimmed milk in Tris-buffered saline with 0.1% Tween for 2 h at room temperature and incubated with the primary antibodies (Cx43, ab11370, 1:10,000; Hsp60, ab46798, 1:20,000; MEF2a, ab32866, 1:1000; SRF, ab53147, 1:1000; abcam, Cambridge, UK) overnight at 4 °C. The secondary antibody was applied for 2 h after washing with cold TBS-T three times for 10 min. The membrane was washed again in TBS-T and bound antibodies were visualized using the enhanced chemiluminescent detection method by a digital camera (cool snap HQ2; Photometrics®, Tuscon, AZ). Signals were quantified by densitometry (GelScan; BioSciTec GmbH, Frankfurt/Main, Germany) using glyceraldehyde 3-phosphate dehydrogenase (GAPDH, ab8245, 1:40,000, abcam, Cambridge, UK) as a control protein to ensure equal loading of the gel.
5.7. BDNF ELISA
BDNF protein levels of DRG were analyzed using the BDNF Emax® ImmunoAssay System (Promega, Madison, Wisconsin). Protein isolation was performed as described above. According to the manufacturer's protocol, ninety-six-well plates were coated with anti-BDNF monoclonal antibody and buffer (0.025 M sodium bicarbonate and 0.025 M sodium carbonate adjusted to pH 9.7) and incubated at 4 °C overnight. The plates were washed with TBS-T and incubated with 200 μl of Block and Sample buffer (BDNF Emax™ ImmunoAssay System, Promega, Madison, WI, USA) for 1 h at room temperature before samples were added. Briefly, 100 μl of each sample and BDNF standards were transferred to the ELISA plate, shaked for 2 h followed by incubation with anti-human BDNF polyclonal antibody and anti-IgG antibody conjugated to horseradish peroxidase. The color reaction was stopped with 1 M HCl and the absorbance was measured at 450 nm. BDNF levels were calculated from the standard curve prepared for each plate and normalized to the concentration of total protein in each sample. The standard curves were linear within the range used (0–500 pg/ml).
5.8. Statistics
Results are expressed as mean ± SEM and analyzed by student's t-test or oneway-ANOVA using GraphPad Prism Software version 6 (San Diego California USA) or Partek Genomics Suite software (vers. 6.6; Partek, Inc.), respectively. The significance threshold was set to p < 0.05.
The following are the supplementary data related to this article.
: MEF2a and SRF expression in DRG of adult Bdnf cKO animals at an early time point after BDNF gene deletion (A) MEF2a and (B) SRF protein expression in DRG were determined by Western blot analysis. Data are presented as normalized levels (n = 8–9 and n = 5 respectively). White bars represent data from WT mice, while black bars represent data from BDNFAvCreERT2 mice 10 days after the last tamoxifen injection. Data are presented as mean ± SEM. Statistical analysis was performed with unpaired t-test.
Competing interests
All authors declare that they have no conflict of interest.
Authors' contributions
EN carried out RNA and protein isolation, conducted microRNA, ELISA and Western blot analysis, performed the statistical analysis and drafted the manuscript. TB participated in the design of the study, helped to perform microRNA analysis and to draft the manuscript. SS participated in animal work and tissue dissection. RD and KK performed microRNA microarray experiments and statistical analysis. IB participated in the coordination of the study and critically reviewed the manuscript. HH participated in the design of the study and helped to draft the manuscript. JNW participated in the coordination of the study, facilitated experimental work, contributed transgenic mice and critically reviewed the manuscript. JZ participated in animal work, tissue dissection and the design of the study and helped to draft the manuscript. RW conceived of the study and participated in its design and coordination, participated in animal work and tissue dissection, and helped to draft the manuscript. All authors read and approved the final manuscript.
Acknowledgements
Excellent assistance by Yvonne Grüber is gratefully acknowledged.
Contributor Information
Elena Neumann, Email: elena.neumann@med.uni-duesseldorf.de.
Timo Brandenburger, Email: timo.brandenburger@med.uni-duesseldorf.de.
Sonia Santana-Varela, Email: s.santana@ucl.ac.uk.
René Deenen, Email: rene.deenen@hhu.de.
Karl Köhrer, Email: koehrer@uni-duesseldorf.de.
Inge Bauer, Email: inge.bauer@med.uni-duesseldorf.de.
Henning Hermanns, Email: h.hermanns@amc.uva.nl.
John N. Wood, Email: j.wood@ucl.ac.uk.
Jing Zhao, Email: jing02.zhao@ucl.ac.uk.
Robert Werdehausen, Email: robert.werdehausen@uni-duesseldorf.de.
References
- Bartel D.P. MicroRNAs: genomics, biogenesis, mechanism, and function. Cell. 2004;116:281–297. doi: 10.1016/s0092-8674(04)00045-5. [DOI] [PubMed] [Google Scholar]
- Bastian I., Tam Tam S., Zhou X.-F.F., Kazenwadel J., Van der Hoek M., Michael M.Z., Gibbins I., Haberberger R.V. Differential expression of microRNA-1 in dorsal root ganglion neurons. Histochem. Cell Biol. 2011;135:37–45. doi: 10.1007/s00418-010-0772-0. [DOI] [PubMed] [Google Scholar]
- Bolstad B.M., Irizarry R.A., Astrand M., Speed T.P. A comparison of normalization methods for high density oligonucleotide array data based on variance and bias. Bioinformatics. 2003;19:185–193. doi: 10.1093/bioinformatics/19.2.185. [DOI] [PubMed] [Google Scholar]
- Brandenburger T., Grievink H., Heinen N., Barthel F., Huhn R., Stachuletz F., Kohns M., Pannen B., Bauer I. Effects of remote ischemic preconditioning and myocardial ischemia on microRNA-1 expression in the rat heart in vivo. Shock. 2014;42:234–238. doi: 10.1097/SHK.0000000000000201. [DOI] [PubMed] [Google Scholar]
- Chen J.-F.F., Mandel E.M., Thomson J.M., Wu Q., Callis T.E., Hammond S.M., Conlon F.L., Wang D.-Z.Z. The role of microRNA-1 and microRNA-133 in skeletal muscle proliferation and differentiation. Nat. Genet. 2006;38:228–233. doi: 10.1038/ng1725. [DOI] [PMC free article] [PubMed] [Google Scholar]
- Chen M.J., Kress B., Han X., Moll K., Peng W., Ji R.-R.R., Nedergaard M. Astrocytic CX43 hemichannels and gap junctions play a crucial role in development of chronic neuropathic pain following spinal cord injury. Glia. 2012;60:1660–1670. doi: 10.1002/glia.22384. [DOI] [PMC free article] [PubMed] [Google Scholar]
- Costigan M., Scholz J., Woolf C.J. Neuropathic pain: a maladaptive response of the nervous system to damage. Annu. Rev. Neurosci. 2009;32:1–32. doi: 10.1146/annurev.neuro.051508.135531. [DOI] [PMC free article] [PubMed] [Google Scholar]
- Coull J.A., Beggs S., Boudreau D., Boivin D., Tsuda M., Inoue K., Gravel C., Salter M.W., Koninck Y.D. BDNF from microglia causes the shift in neuronal anion gradient underlying neuropathic pain. Nature. 2005;438:1017–1021. doi: 10.1038/nature04223. [DOI] [PubMed] [Google Scholar]
- Elramah S., Landry M., Favereaux A. MicroRNAs regulate neuronal plasticity and are involved in pain mechanisms. Front. Cell. Neurosci. 2014;8:31. doi: 10.3389/fncel.2014.00031. [DOI] [PMC free article] [PubMed] [Google Scholar]
- Guo Z., Maki M., Ding R., Yang Y., Zhang B., Xiong L. Genome-wide survey of tissue-specific microRNA and transcription factor regulatory networks in 12 tissues. Sci. Rep. 2014;4:5150. doi: 10.1038/srep05150. [DOI] [PMC free article] [PubMed] [Google Scholar]
- Hasegawa H., Abbott S., Han B.-X.X., Qi Y., Wang F. Analyzing somatosensory axon projections with the sensory neuron-specific advillin gene. J. Neurosci. 2007;27:14404–14414. doi: 10.1523/JNEUROSCI.4908-07.2007. [DOI] [PMC free article] [PubMed] [Google Scholar]
- Hobert O. Gene regulation by transcription factors and microRNAs. Science. 2008;319:1785–1786. doi: 10.1126/science.1151651. [DOI] [PubMed] [Google Scholar]
- Huang E.J., Reichardt L.F. Trk receptors: roles in neuronal signal transduction. Annu. Rev. Biochem. 2003;72:609–642. doi: 10.1146/annurev.biochem.72.121801.161629. [DOI] [PubMed] [Google Scholar]
- Knöll B., Nordheim A. Functional versatility of transcription factors in the nervous system: the SRF paradigm. Trends Neurosci. 2009;32:432–442. doi: 10.1016/j.tins.2009.05.004. [DOI] [PubMed] [Google Scholar]
- Kress M., Hüttenhofer A., Landry M., Kuner R., Favereaux A., Greenberg D., Bednarik J., Heppenstall P., Kronenberg F., Malcangio M., Rittner H., Uçeyler N., Trajanoski Z., Mouritzen P., Birklein F., Sommer C., Soreq H. microRNAs in nociceptive circuits as predictors of future clinical applications. Front. Mol. Neurosci. 2013;6:33. doi: 10.3389/fnmol.2013.00033. [DOI] [PMC free article] [PubMed] [Google Scholar]
- Kusuda R., Cadetti F., Ravanelli M.I., Sousa T.A., Zanon S., Lucca F.L.D., Lucas G. Differential expression of microRNAs in mouse pain models. Mol. Pain. 2011;7:17. doi: 10.1186/1744-8069-7-17. [DOI] [PMC free article] [PubMed] [Google Scholar]
- Lau J., Minett M.S., Zhao J., Dennehy U., Wang F., Wood J.N., Bogdanov Y.D. Temporal control of gene deletion in sensory ganglia using a tamoxifen-inducible advillin-Cre-ERT2 recombinase mouse. Mol. Pain. 2011;7:100. doi: 10.1186/1744-8069-7-100. [DOI] [PMC free article] [PubMed] [Google Scholar]
- Lehnardt S., Schott E., Trimbuch T., Laubisch D., Krueger C., Wulczyn G., Nitsch R., Weber J.R. A vicious cycle involving release of heat shock protein 60 from injured cells and activation of toll-like receptor 4 mediates neurodegeneration in the CNS. J. Neurosci. 2008;28:2320–2331. doi: 10.1523/JNEUROSCI.4760-07.2008. [DOI] [PMC free article] [PubMed] [Google Scholar]
- Lin X., Shah S., Bulleit R.F. The expression of MEF2 genes is implicated in CNS neuronal differentiation. Brain Res. Mol. Brain Res. 1996;42:307–316. doi: 10.1016/s0169-328x(96)00135-0. [DOI] [PubMed] [Google Scholar]
- MacQueen G.M., Ramakrishnan K., Croll S.D., Siuciak J.A., Yu G., Young L.T., Fahnestock M. Performance of heterozygous brain-derived neurotrophic factor knockout mice on behavioral analogues of anxiety, nociception, and depression. Behav. Neurosci. 2001;115:1145–1153. doi: 10.1037//0735-7044.115.5.1145. [DOI] [PubMed] [Google Scholar]
- Marks P.W., Arai M., Bandura J.L., Kwiatkowski D.J. Advillin (p92): a new member of the gelsolin/villin family of actin regulatory proteins. J. Cell Sci. 1998;111(Pt 15):2129–2136. doi: 10.1242/jcs.111.15.2129. [DOI] [PubMed] [Google Scholar]
- Mor D., Bembrick A.L., Austin P.J., Keay K.A. Evidence for cellular injury in the midbrain of rats following chronic constriction injury of the sciatic nerve. J. Chem. Neuroanat. 2011;41:158–169. doi: 10.1016/j.jchemneu.2011.01.004. [DOI] [PubMed] [Google Scholar]
- Neumann E., Hermanns H., Barthel F., Werdehausen R., Brandenburger T. Expression changes of microRNA-1 and its targets connexin 43 and brain-derived neurotrophic factor in the peripheral nervous system of chronic neuropathic rats. Mol. Pain. 2015;11:39. doi: 10.1186/s12990-015-0045-y. [DOI] [PMC free article] [PubMed] [Google Scholar]
- Pan Z., Sun X., Ren J., Li X., Gao X., Lu C., Zhang Y., Sun H., Wang Y., Wang H., Wang J., Xie L., Lu Y., Yang B. miR-1 exacerbates cardiac ischemia-reperfusion injury in mouse models. PLoS One. 2012;7:e50515. doi: 10.1371/journal.pone.0050515. [DOI] [PMC free article] [PubMed] [Google Scholar]
- Pfeifer I., Anderson C., Werner R., Oltra E. Redefining the structure of the mouse connexin43 gene: selective promoter usage and alternative splicing mechanisms yield transcripts with different translational efficiencies. Nucleic Acids Res. 2004;32:4550–4562. doi: 10.1093/nar/gkh792. [DOI] [PMC free article] [PubMed] [Google Scholar]
- Shan Z.-X.X., Lin Q.-X.X., Deng C.-Y.Y., Zhu J.-N.N., Mai L.-P.P., Liu J.-L.L., Fu Y.-H.H., Liu X.-Y.Y., Li Y.-X.X., Zhang Y.-Y.Y., Lin S.-G.G., Yu X.-Y.Y. miR-1/miR-206 regulate Hsp60 expression contributing to glucose-mediated apoptosis in cardiomyocytes. FEBS Lett. 2010;584:3592–3600. doi: 10.1016/j.febslet.2010.07.027. [DOI] [PubMed] [Google Scholar]
- Simon D.J., Madison J.M., Conery A.L., Thompson-Peer K.L., Soskis M., Ruvkun G.B., Kaplan J.M., Kim J.K. The microRNA miR-1 regulates a MEF-2-dependent retrograde signal at neuromuscular junctions. Cell. 2008;133:903–915. doi: 10.1016/j.cell.2008.04.035. [DOI] [PMC free article] [PubMed] [Google Scholar]
- Treede R.-D.D., Jensen T.S., Campbell J.N., Cruccu G., Dostrovsky J.O., Griffin J.W., Hansson P., Hughes R., Nurmikko T., Serra J. Neuropathic pain: redefinition and a grading system for clinical and research purposes. Neurology. 2008;70:1630–1635. doi: 10.1212/01.wnl.0000282763.29778.59. [DOI] [PubMed] [Google Scholar]
- Tsang J., Zhu J., van Oudenaarden A. MicroRNA-mediated feedback and feedforward loops are recurrent network motifs in mammals. Mol. Cell. 2007;26:753–767. doi: 10.1016/j.molcel.2007.05.018. [DOI] [PMC free article] [PubMed] [Google Scholar]
- Varendi K., Kumar A., Härma M.-A.A., Andressoo J.-O.O. miR-1, miR-10b, miR-155, and miR-191 are novel regulators of BDNF. Cell. Mol. Life Sci. 2014;71:4443–4456. doi: 10.1007/s00018-014-1628-x. [DOI] [PMC free article] [PubMed] [Google Scholar]
- Willis D., Li K.W., Zheng J.-Q.Q., Chang J.H., Smit A.B., Smit A., Kelly T., Merianda T.T., Sylvester J., van Minnen J., Twiss J.L. Differential transport and local translation of cytoskeletal, injury-response, and neurodegeneration protein mRNAs in axons. J. Neurosci. 2005;25:778–791. doi: 10.1523/JNEUROSCI.4235-04.2005. [DOI] [PMC free article] [PubMed] [Google Scholar]
- Yang B., Lin H., Xiao J., Lu Y., Luo X., Li B., Zhang Y., Xu C., Bai Y., Wang H., Chen G., Wang Z. The muscle-specific microRNA miR-1 regulates cardiac arrhythmogenic potential by targeting GJA1 and KCNJ2. Nat. Med. 2007;13:486–491. doi: 10.1038/nm1569. [DOI] [PubMed] [Google Scholar]
- Zhao Y., Samal E., Srivastava D. Serum response factor regulates a muscle-specific microRNA that targets Hand2 during cardiogenesis. Nature. 2005;436:214–220. doi: 10.1038/nature03817. [DOI] [PubMed] [Google Scholar]
- Zhao J., Seereeram A., Nassar M.A., Levato A., Pezet S., Hathaway G., Morenilla-Palao C., Stirling C., Fitzgerald M., McMahon S.B., Rios M., Wood J.N. Nociceptor-derived brain-derived neurotrophic factor regulates acute and inflammatory but not neuropathic pain. Mol. Cell. Neurosci. 2006;31:539–548. doi: 10.1016/j.mcn.2005.11.008. [DOI] [PubMed] [Google Scholar]
- Zhao J., Lee M.-C.C., Momin A., Cendan C.-M.M., Shepherd S.T., Baker M.D., Asante C., Bee L., Bethry A., Perkins J.R., Nassar M.A., Abrahamsen B., Dickenson A., Cobb B.S., Merkenschlager M., Wood J.N. Small RNAs control sodium channel expression, nociceptor excitability, and pain thresholds. J. Neurosci. 2010;30:10860–10871. doi: 10.1523/JNEUROSCI.1980-10.2010. [DOI] [PMC free article] [PubMed] [Google Scholar]
Associated Data
This section collects any data citations, data availability statements, or supplementary materials included in this article.
Supplementary Materials
: MEF2a and SRF expression in DRG of adult Bdnf cKO animals at an early time point after BDNF gene deletion (A) MEF2a and (B) SRF protein expression in DRG were determined by Western blot analysis. Data are presented as normalized levels (n = 8–9 and n = 5 respectively). White bars represent data from WT mice, while black bars represent data from BDNFAvCreERT2 mice 10 days after the last tamoxifen injection. Data are presented as mean ± SEM. Statistical analysis was performed with unpaired t-test.