Abstract
Iodothyronine deiodinase 2 (DIO2) converts the prohormone thyroxine (T4) to bioactive T3 in peripheral tissues and thereby regulates local thyroid hormone (TH) levels. Although epidemiologic studies suggest the contribution of TH to the progression of colorectal cancer (CRC), the role of DIO2 in CRC remains elusive. Here we show that Dio2 is highly expressed in intestinal polyps of Apc Δ716 mice, a mouse model of familial adenomatous polyposis and early stage sporadic CRC. Laser capture microdissection and in situ hybridization analysis show almost exclusive expression of Dio2 in the stroma of Apc Δ716 polyps in the proximity of the COX‐2‐positive areas. Treatment with iopanoic acid, a deiodinase inhibitor, or chemical thyroidectomy suppresses tumor formation in Apc Δ716 mice, accompanied by reduced tumor cell proliferation and angiogenesis. Dio2 expression in Apc Δ716 polyps is strongly suppressed by treatment with the COX‐2 inhibitor meloxicam. Analysis of The Cancer Genome Atlas data shows upregulation of DIO2 in CRC clinical samples and a close association of its expression pattern with the stromal component, consistently with almost exclusive expression of DIO2 in the stroma of human CRC as revealed by in situ hybridization. These results indicate essential roles of stromal DIO2 and thyroid hormone signaling in promoting the growth of intestinal tumors.
Keywords: colorectal cancer, iodothyronine deiodinase 2, iopanoic acid, thyroid hormone, tumor angiogenesis
Abbreviations
- ANTXR1
anthrax toxin receptor 1
- CRC
colorectal cancer
- DIO
iodothyronine deiodinase
- IHC
immunohistochemistry
- IOP
iopanoic acid
- LMD
laser capture microdissection
- MMI
2‐mercapto‐1‐methyl‐imidazole
- MVD
microvessel density
- PP
potassium perchlorate
- T4
thyroxine
- TCGA
The Cancer Genome Atlas
- TH
thyroid hormone
1. INTRODUCTION
Thyroid hormone regulates essential metabolic pathways in various tissues both during development and in postnatal life.1 Thyroid hormone plays regulatory roles in intestinal homeostasis as well by controlling expression of its target genes involved in intestinal metabolism or in turnover of the intestinal stem cells.2, 3 Thyroid hormone is also implicated in the development of various malignancies4 and epidemiologic studies indicate protective roles of TH signaling in CRC. Thyroid hormone replacement therapy in hypothyroidism patients was shown to reduce their relative risk of CRC.5, 6, 7 However, hyperthyroidism patients suffer from an increased risk of CRC.7 Studies using cell lines and animal models suggest opposing roles of TH receptors α and β (TRα and TRβ, encoded by THRA and THRB, respectively) in CRC. Specifically, while TRα1 enhances intestinal carcinogenesis by positively regulating Wnt signaling,2, 8, 9 TRβ1 expression is selectively lost upon malignant progression of CRC cells.10, 11 The precise roles of TH signaling in CRC development thus remain elusive.
Thyroid hormone contains iodine atoms and its hormonal activity is tightly regulated by the 3 iodothyronine deiodinases in the body12 (Figure 1A). In brief, DIO1 and DIO2 are TH‐activating enzymes that convert the prohormone thyroxine (T4) in circulation to the active hormone triiodothyronine (T3) in peripheral tissues. T3 binds effectively to TH receptors and initiates TH signaling at target tissues. Iodothyronine deiodinase 3 inactivates T3 and terminates its effects. Iodothyronine deiodinase 2 is expressed in multiple tissues, whereas DIO1 expression is virtually restricted to the liver and kidney.13 Iodothyronine deiodinase 2 has a ~500‐fold higher affinity for T4 than DIO1.14 Given the tissue distribution and enzymatic property, DIO2 is currently regarded as the central DIO that activates TH in the body.12
Figure 1.
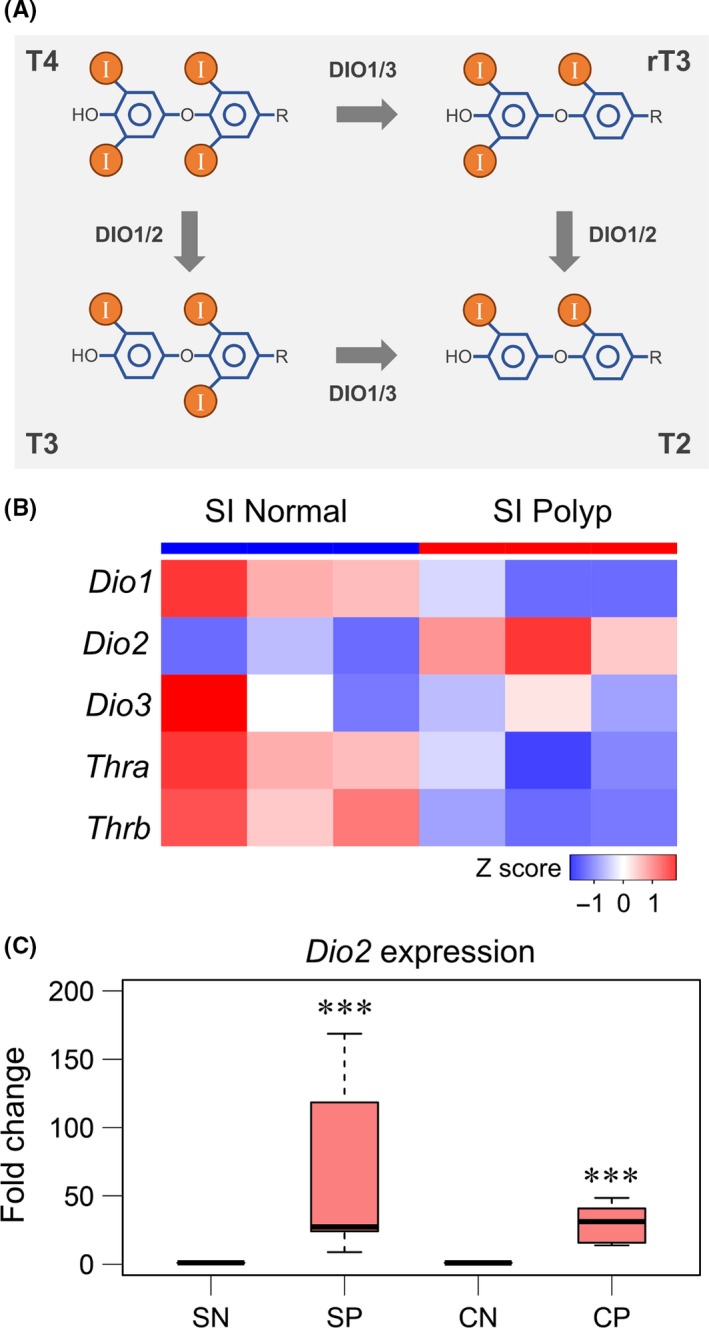
Elevated expression of Dio2 in intestinal polyps of Apc Δ716 mice. A, Schematic diagram of deiodination of thyroxine (T4). DIO, iodothryonine deiodinase; I, iodine atom; rT3, 3,3′,5′‐triiodo‐l‐thyronine; T2, 3,3′‐diiodo‐l‐thyronine; T3, 3,3′,5‐triiodo‐l‐thyronine. B, Heat map of DNA microarray data of small intestinal (SI) normal mucosa and polyps (n = 3, each group). Colors were coded according to Z‐scored signal intensity. Thra, thyroid hormone receptor, α; Thrb, thyroid hormone receptor, β. C, Expression of Dio2 in normal and polyp tissues from Apc Δ716 mice analyzed by real‐time RT‐PCR. CN, normal colon; CP, colonic polyps; SN, normal small intestine; SP, small intestinal polyps. SN and SP, n = 7, P‐value = 9.56 × 10⁻⁵ by paired 2‐tailed t test on log‐transformed data. CN and CP, n = 8, P‐value = 8.99 × 10⁻⁶. ***P < .001 compared with SN or CN
A growing body of evidence indicates altered expression of DIOs in several types of cancers13 and many cancer cell lines, including those from CRC highly express DIO3.15, 16, 17 An in vitro study showed that inhibition of Wnt signaling, the key initial step for CRC development,18 reduced DIO3 levels and induced DIO2 levels in Caco‐2 cells.15 Although these results suggest the involvement of DIOs in carcinogenesis, their roles in CRC development remain poorly understood.
Here we report elevated expression of DIO2 in the stroma of intestinal tumors in Apc Δ716 mice, a genetically engineered mouse model for familial adenomatous polyposis and the early stage of sporadic CRC.19 Our study also shows that inhibition of DIOs suppresses the growth of intestinal tumors in Apc Δ716 mice and prolongs their survival, accompanied by reduced angiogenesis in the tumor microenvironment.
2. MATERIALS AND METHODS
2.1. Animals and drug treatments
The construction of Apc Δ716 mouse strain was described previously.19 For inhibition of deiodinases, Apc Δ716 mice at 12 weeks of age were given 0.02% (w/v) IOP (CAS 96‐83‐3; Tokyo Chemical Industry, Tokyo, Japan) in drinking water. For the survival assay, IOP treatment was started at 8 weeks of age. For chemical thyroidectomy, Apc Δ716 mice at 12 weeks of age were given drinking water containing 0.02% (w/v) MMI (CAS 60‐56‐0; Sigma) and 1% (w/v) PP (CAS 7778‐74‐7; Sigma). All animal experiments were undertaken according to the protocols approved by the Animal Care and Use Committee of Aichi Cancer Center Research Institute (Nagoya, Japan).
2.2. Histological analysis and IHC
For histological analysis and IHC, we used 5‐μm sections of formalin‐fixed paraffin‐embedded mouse tissue samples and human colon carcinoma tissue microarray (Cat No. CO703a; US Biomax). For BrdU staining, we injected BrdU (12 mg/kg; Sigma) and 5‐fluoro‐2′‐deoxyuridine (1.2 mg/kg; Sigma) into the peritoneal cavity of mice 1 hour before analysis, and prepared paraformaldehyde‐fixed paraffin‐embedded samples. The following primary Abs were used for IHC: anti‐CD34 Ab (clone MEC 14.7; BioLegend), anti‐BrdU Ab (clone BU1/75; Bio‐Rad), anti‐vimentin Ab (clone D21H3; Cell Signaling Technology), anti‐COX‐2 Ab (clone D5H5; Cell Signaling Technology). To detect primary Abs, VECTASTAIN Elite ABC kit and ImmPACT DAB system (Vector Laboratories) were used according to the manufacturer's protocols. All clinical tissues on the tissue microarray were sampled under the highest ethical standards and US HIPAA audit protocols (US Biomax).
2.3. In situ hybridization
Five micrometer‐thick sections from formalin‐fixed paraffin‐embedded mouse tissue samples and clinical colon carcinoma tissue microarrays (Cat No. CO703a; US Biomax) were subjected to in situ hybridization procedure. RNAscope in situ hybridization probes for murine Dio2 mRNA (Cat No. 479331) and human DIO2 mRNA (Cat No. 562211) were synthesized by Advanced Cell Diagnostics USA. The probes on the slides were detected with RNAscope 2.0 HD Detection Kit‐BROWN (Advanced Cell Diagnostics) for mouse samples, and RNAscope 2.5 HD Detection Kit‐BROWN for human samples, according to the manufacturer's protocol.
2.4. DNA microarray and real‐time RT‐PCR analysis
Freshly dissected intestinal tumors and normal intestinal tissues were immersed in RNAlater solution (Thermo Fisher Scientific) overnight and stored frozen at −80°C until further processing. The epithelial and stromal samples were prepared by microdissecting 7‐μm‐thick fresh frozen sections on polyethylene naphthalate membrane slides using an LMD7000 laser microdissection microscope (Leica Microsystems). Total RNA was isolated using an RNeasy Mini Kit (Qiagen) with on‐column RNase‐free DNase I (Qiagen) treatment. A High‐Capacity cDNA Reverse Transcription Kit (Life Technologies) was used for synthesis of complementary DNA from total RNA. DNA microarray analysis was carried out using an Agilent Technologies platform (Mouse GE 4 × 44K v2 Microarray). Real‐time PCR reactions were carried out using a 7500 Fast Real‐Time PCR system (Applied Biosystems, Life Technologies). The mRNA levels of Dio2, Vimentin, and Gapdh were quantified with the TaqMan Gene Expression assays (Mm00515664_m1, Mm01333430_m1, and Mm99999915_g1, respectively) from Applied Biosystems. Gapdh was used as an internal control to normalize the expression levels of Dio2 and Vimentin by the comparative 2−ΔΔCT method.20
2.5. Data and statistical analyses
Data and statistical analyses were undertaken using R (version 3.4.3; R Foundation for Statistical Computing). The single‐channel Agilent DNA microarray raw data were preprocessed using the LIMMA package,21 and differential expression analysis was carried out using the Rank products package.22 The HTSeq‐FKPM‐UQ datasets of GDC TCGA Colon Cancer (COAD) and GDC TCGA Rectal Cancer (READ) were obtained from GDC Xena Hub run by the UC Santa Cruz Genomics Institute (https://xena.ucsc.edu). Recurrent and metastatic tumor datasets were excluded from these datasets. Enrichment analysis was undertaken using Metascape (http://metascape.org).23 Values of P < .05 were considered significant.
3. RESULTS
3.1. Dio2 is highly expressed in stromal regions of intestinal polyps in Apc Δ716 mice
To identify molecules or signals involved in the tumor microenvironment of small intestinal polyps in Apc Δ716 mice, we first carried out differential gene expression analysis using DNA microarray. We found significant upregulation of Dio2 gene expression in the small intestinal polyps as compared with the normal small intestine tissue with the false discovery rate of 1.48 × 10⁻² (5.07‐fold change; Figure 1B). Quantitative PCR analysis showed elevated expression level of Dio2 both in small intestinal and colonic polyps of Apc Δ716 mice (Figure 1C).
We next explored the site of expression of Dio2 in the Apc Δ716 polyps. Combination of LMD and real‐time RT‐PCR assay revealed almost exclusive expression of Dio2 mRNA in the stroma of Apc Δ716 polyps (Figure 2A). Successful separation of the epithelial and stromal compartments was confirmed by real‐time RT‐PCR of Vim encoding the intermediate filament vimentin, a specific lineage marker for cells of mesenchymal origin (Figure 2A).
Figure 2.
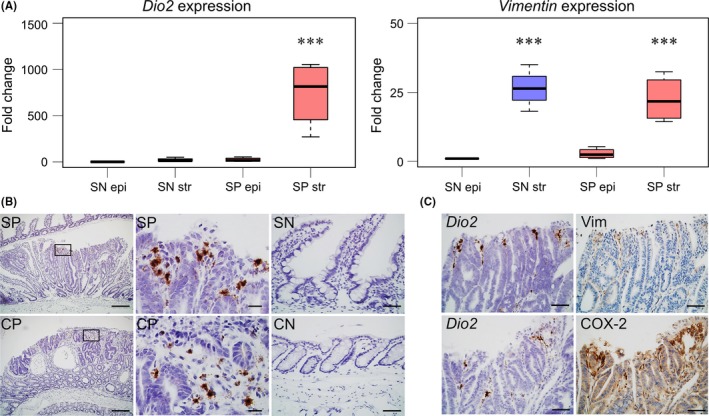
Dio2 is expressed in the stromal region of Apc Δ716 tumors. A, Expression of Dio2 in epithelial (epi) and stromal compartment (str) of intestine tissues from Apc Δ716 mice analyzed by real‐time RT‐PCR. SN, normal small intestine; SP, small intestinal polyps. Tukey's all‐pairwise comparison test was applied. SN epi, SN str, SP epi, and SP str, n = 4, ***P < .001 compared with SN epi. B, In situ hybridization analysis of Dio2 mRNA in intestine tissues from Apc Δ716 mice. Bars: left panels, 200 μm; middle panels, 50 μm; right panels, 50 μm. C, In situ hybridization analysis of Dio2 mRNA and immunohistochemical analysis of vimentin (Vim) and COX‐2 in intestinal tissues from Apc Δ716 mice. Bars: 50 μm
To validate the LMD results, we undertook in situ hybridization analysis using the small intestinal and colonic tissue sections from Apc Δ716 mice. Dio2 expression in the polyps was predominant in the stromal regions near the luminal border (Figure 2B). Immunohistochemistry for vimentin using serial sections showed closely overlapped localization of Dio2 mRNA with that of vimentin (Figure 2C). Cyclooxygenase‐2 is known to be induced in the tumor microenvironment of ApcΔ716 polyps, playing a key role in tumorigenesis of ApcΔ716 mice.24 Immunohistochemistry analysis revealed that the Dio2‐positive regions were mostly overlapped with the COX‐2‐positive areas in the tumor stroma (Figure 2C). Collectively, these results indicate that Dio2 mRNA is highly expressed in the stromal cells of Apc Δ716 polyps.
3.2. Treatment with IOP suppresses polyp formation and prolongs survival in Apc Δ716 mice
Iopanoic acid, a classical oral cholecystography agent, contains 3 iodine atoms and potently inhibits DIO1 and DIO2 as shown in Figure 3A.25 Iopanoic acid is known to rapidly decrease the serum T3 levels in humans and has been one of the treatment options for thyrotoxicosis in emergency. To address the role of DIO2 in intestinal tumor formation, we treated Apc Δ716 mice with 0.02% (w/v) IOP in drinking water (Figure 3A). Treatment with IOP for 2 months did not deplete TH in the thyroid glands (Figure 3B) and did not significantly affect the body weight (Figure 3B) or the basic tissue architecture of the intestinal polyps (Figure 3C). Importantly, IOP treatment significantly reduced the numbers of total polyps and large‐size polyps (≥1.5 mm) in Apc Δ716 mice (Figures 3D and S1), indicating the role of DIO2 in the growth of intestinal tumors.
Figure 3.
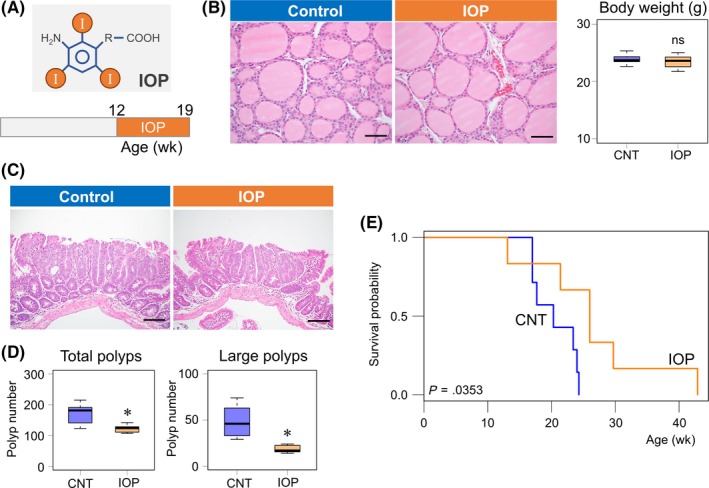
Treatment with the iodothryonine deiodinase inhibitor iopanoic acid (IOP) suppresses intestinal tumor formation and prolongs the survival of Apc Δ716 mice. A, Schematic diagram of IOP structure and IOP treatment schedule. B, H&E staining of the thyroid glands from control and IOP‐treated Apc Δ716 mice. Box plots of the final body weight of the mice immediately before sampling. Control, 23.9 ± 0.9 g, n = 6; IOP, 23.4 ± 1.2 g, n = 7. Welch 2‐tailed t test, P = .499; ns, not significant. Bars: 50 μm. C, H&E staining of small intestinal polyp tissues from control and IOP‐treated Apc Δ716 mice. Bars: 100 μm. D, Number of total and large‐size polyps (≥1.5 mm) in control (CNT) and IOP‐treated Apc Δ716 mice. Total polyps: CNT, 172 ± 34, n = 6; IOP, 122 ± 13, n = 7; Welch 2‐tailed t test, P = .0136. Large‐size polyps: CNT, 49 ± 17, n = 6; IOP, 23 ± 14, n = 7. P = .0170. *P < .05 compared with CNT. E, Kaplan‐Meier survival curves of CNT (n = 7, blue) and IOP‐treated Apc Δ716 mice (n = 6, orange). IOP treatment was initiated at 8 wk of age. Median survival time: CNT, 20.3 wk; IOP, 26.0 wk; log rank test, P = .0353
We next examined the survival benefit of IOP treatment on Apc Δ716 mice. Thirteen littermate female Apc Δ716 mice obtained by in vitro fertilization were randomly allocated to either the control group (7 mice) or IOP treatment group (6 mice) at 8 weeks of age. As expected from the suppressive effect on tumor growth, IOP treatment increased the overall survival of Apc Δ716 mice (Figure 3E). Collectively, these observations indicate that IOP treatment inhibits intestinal tumor formation and confers a survival advantage in Apc Δ716 mice.
3.3. Chemically induced hypothyroidism suppresses polyp formation in Apc Δ716 mice
To confirm further the involvement of TH signaling in intestinal tumor formation in Apc Δ716 mice indicated by the IOP experiment, we carried out chemical thyroidectomy using MMI and PP.26 The former disturbs the iodination of thyroglobulin in the thyroid gland, whereas PP acts as a competitive inhibitor of SLC5A5, a transporter responsible for the uptake of iodine into the thyroid gland.27 Treatment with a cocktail of 0.02% (w/v) MMI and 1% (w/v) PP in drinking water reproducibly induces hypothyroidism in mice.26 We confirmed the treatment regimen for 3 months (Figure 4A) completely depleted TH in the thyroid glands and disrupted the spherical follicles (Figure 4B), although we did not observe significant changes in general condition or body weight. The treatment with MMI + PP did not cause remarkable changes in tissue components of Apc Δ716 polyps (Figure 4C). However, similar to IOP treatment, the chemical thyroidectomy significantly reduced the numbers of total polyps and those in the large‐size class (≥1.5 mm) in Apc Δ716 mice (Figures 4D and S1).
Figure 4.
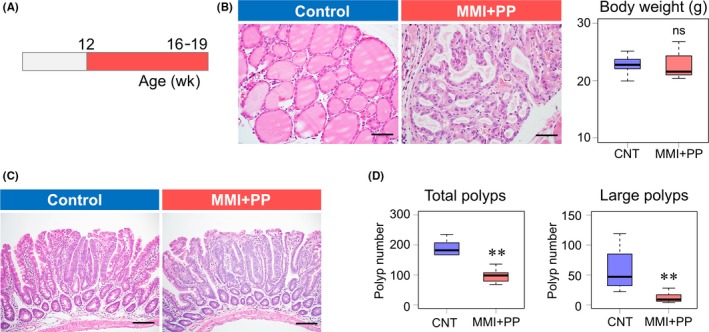
Chemical thyroidectomy suppresses intestinal tumor formation. A, Schematic diagram of the schedule of chemical thyroidectomy with 2‐mercapto‐1‐methyl‐imidazole (MMI) and potassium perchlorate (PP). B, H&E staining of thyroid glands 3 mo after chemical thyroidectomy. Body weight of control and MMI + PP‐treated Apc Δ716 mice. Box plots of the final body weight of the mice immediately before sampling. Control, 22.8 ± 1.6 g, n = 9; MMI + PP, 22.7 ± 2.3 g, n = 9. Welch 2‐tailed t test, P = 0.897; ns, not significant. Bars: 50 μm. C, H&E staining of polyp tissues from control (CNT) and MMI + PP‐treated Apc Δ716 mice. Bars: 100 μm. D, Number of total and large‐size polyps (≥1.5 mm) in CNT and MMI + PP‐treated Apc Δ716 mice. Total polyps: CNT, 174 ± 49, n = 9; MMI + PP, 97 ± 35, n = 9; Welch 2‐tailed t test, P = .00178. Large‐size polyps: CNT, 63 ± 37, n = 9; MMI + PP, 12 ± 8, n = 9. P = .00317. **P < .01 compared with CNT
3.4. Iodothyronine deiodinase 2 induces tumor cell proliferation and stimulates angiogenesis downstream of COX‐2
To gain insights into the mechanism by which the inhibition of TH signaling or DIO2 suppresses the growth of Apc Δ716 polyps, we next examined the proliferation rate of tumor epithelial cells. Treatment with IOP or with MMI + PP significantly decreased the BrdU labeling index in the polyp regions of Apc Δ716 mice (Figure 5A,B). The MMI + PP treatment decreased the BrdU index in the normal crypt epithelial cells as well, suggesting that the proliferation of normal intestinal epithelial cells is also dependent on TH (Figure 5B). Proliferation of tumor cells in vivo is controlled not only by growth‐regulating signaling pathways, but also by angiogenesis in the microenvironment. We thus determined the MVD index in the polyps using IHC for CD34, an endothelial cell marker. Both the IOP treatment and MMI + PP treatment significantly decreased the MVD index of the polyps as compared with vehicle treatments (Figure 5C,D). We found colocalization of Dio2 mRNA and COX‐2 protein in the microenvironment of Apc Δ716 polyps (Figure 2C). Because COX‐2 was shown to play a key role in tumor formation in Apc Δ716 mice by inducing angiogenesis,28 we examined the possible involvement of COX‐2 in DIO2 expression in Apc Δ716 polyps. As shown in Figure 5E, 3‐day treatment with the COX‐2 inhibitor meloxicam greatly reduced the level of Dio2 mRNA in Apc Δ716 polyps, indicating that DIO2 acts downstream of COX‐2 in the intestinal tumor microenvironment.
Figure 5.
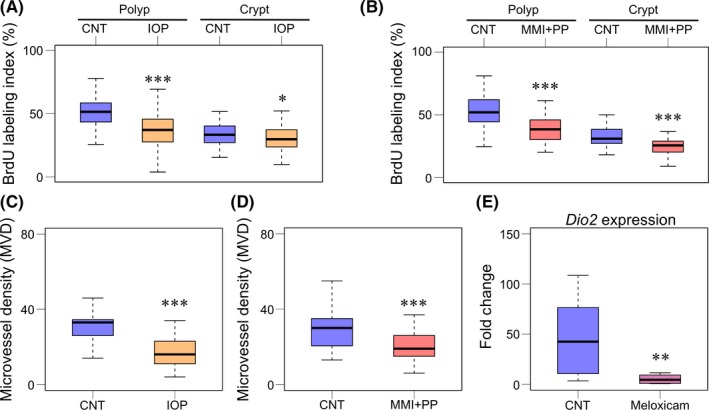
Deiodinase inhibition or chemical thyroidectomy reduces tumor cell proliferation and angiogenesis downstream of COX‐2 in Apc Δ716 polyps. A, BrdU labeling index (%) of intestinal polyps (left) and normal intestinal crypts (right) from control (CNT) and iopanoic acid (IOP)‐treated Apc Δ716 mice. Polyps: CNT, 51.4 ± 10.5%, n = 4; IOP, 36.8 ± 13.1%, n = 4. Welch 2‐tailed t test, P = 2.2 × 10⁻¹⁶. Normal crypts: CNT, 33.7 ± 9.1%, n = 4; IOP, 30.8 ± 10.1%, n = 4. P = 4.32 × 10⁻². *P < .05, ***P < .001 compared with CNT. B, BrdU labeling index (%) of intestinal polyps (left) and normal intestinal crypts (right) from CNT and 2‐mercapto‐1‐methyl‐imidazole and potassium perchlorate (MMI + PP)‐treated Apc Δ716 mice. Polyps: CNT, 53.3 ± 11.5%, n = 4; MMI + PP, 39.5 ± 11.7%, n = 4. Welch 2‐tailed t test, P = 1.17 × 10⁻¹⁴. Normal crypts: CNT, 32.8 ± 7.6%, n = 4; MMI + PP, 25.3 ± 7.1%, n = 4. P = 4.82 × 10⁻⁸. ***P < .001 compared with control. C, Microvessel density (MVD) index of intestinal polyps from control and IOP‐treated Apc Δ716 mice. Control, 31.2 ± 9.3%, n = 4; IOP, 17.1 ± 7.8%, n = 5. P = 6.60 × 10⁻⁷. ***P < .001 compared with CNT. D, MVD index of intestinal polyps from control and MMI + PP‐treated Apc Δ716 mice. CNT, 29.1 ± 9.5%, n = 4; MMI + PP, 21.2 ± 10.1%, n = 4. P = 8.08 × 10⁻⁵. ***P < .001 compared with CNT. E, Real‐time RT‐PCR analysis for Dio2 mRNA expression level in intestinal polyps from CNT and meloxicam‐treated Apc Δ716 mice. CNT, n = 11; meloxicam, n = 8. P = 7.38 × 10⁻³ by paired 2‐tailed t test on log‐transformed data. **P < .01 compared with CNT
3.5. DIO2 expression is increased in clinical samples of CRC
To address the expression profile of DIO2 in human CRC, we analyzed RNA sequencing datasets for colon and rectal cancer in TCGA database.18 We found significant upregulation of DIO2 mRNA levels in primary tumor tissues of colon cancer as compared with the normal colon tissue (Figure 6A). The result is consistent with data provided in a recent review.29 Rectal cancer gene expression data also showed upregulation of DIO2 mRNA in primary rectal tumor tissues (Figure 6A) as compared with the normal rectal tissue. In situ hybridization for DIO2 using human colon cancer tissue samples indicated that DIO2 expression was restricted to the stromal region of colon cancer tissues (Figure 6B). Collectively, these results suggest the expression pattern of DIO2 in human CRC is highly similar to that of Dio2 in Apc Δ716 tumors (Figure 2C). Taken together, these data indicate that tumor stromal cells, rather than tumor epithelial cells, highly express DIO2 in CRC tissues.
Figure 6.
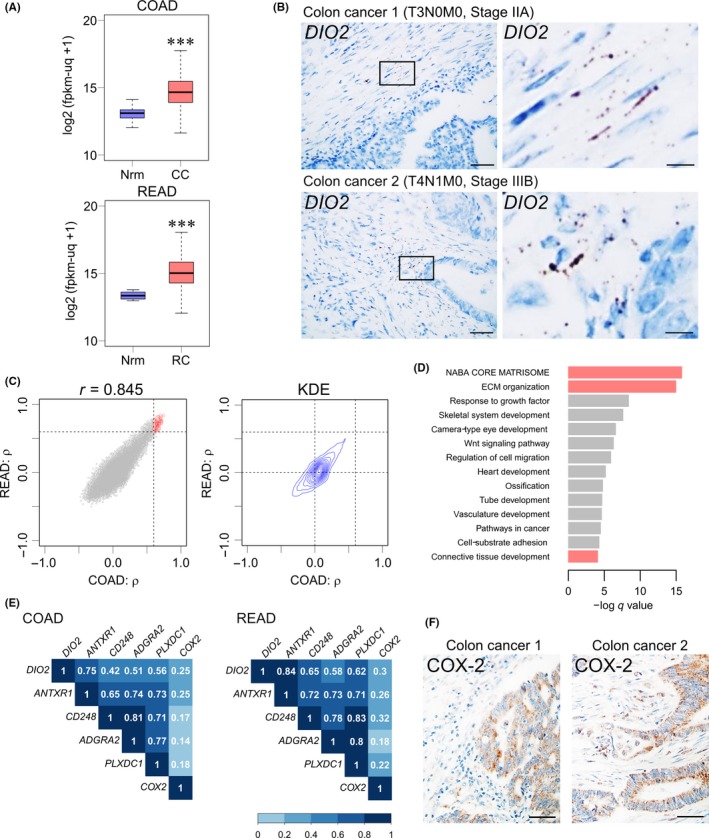
DIO2 expression is increased in the clinical samples of colorectal cancer. A, RNA sequencing analysis for DIO2 expression in colon and rectal cancer obtained from The Cancer Genome Atlas (TCGA) database (COAD and READ datasets). Unit of Y‐axis: log2(fpkm‐uq + 1). CC, colon cancer tissues; Nrm, normal colon or rectal tissue; RC, rectal cancer tissues. Normal colons, n = 41; colon cancers, n = 469, P = 2.2 × 10⁻¹⁶ by Welch 2‐tailed t test; normal rectums, n = 10; rectal cancers, n = 166, P = 3.35 × 10⁻⁹ by Welch 2‐tailed t test. ***P < .001 compared with the normal colonic or rectal tissue. B, In situ hybridization analysis of DIO2 mRNA in colon cancer clinical samples with hematoxylin counterstaining. Colon Cancer 1, T3N0M0, IIA; Colon Cancer 2, T4N1M0, Stage IIIB. Bars: left panels, 50 μm; right panels, 10 μm. C, Spearman's correlation coefficient (ρ) between expression levels of DIO2 and other genes in TCGA COAD (colon cancer) and TCGA READ (rectal cancer) datasets. X axis, ρ calculated from COAD; Y‐axis, ρ calculated from READ; dashed lines, ρ = 0.6; red circles, selected 195 genes. Two‐dimensional kernel density estimation (KDE); dashed lines, ρ = 0.0 and ρ = 0.6. D, Enrichment analysis of selected 195 genes that were highly coexpressed with DIO2 mRNA in colon and rectal cancer tissues. Red bars, clustering enrichment terms related to ECM. E, Spearman's correlation matrix heat map between DIO2 and tumor endothelial markers (ANTXR1,CD248,ADGRA2, and PLXDC1) and COX‐2 in TCGA COAD and TCGA READ datasets. F, Immunohistochemical analysis of COX‐2 in colon cancer clinical samples with hematoxylin counterstaining. COX‐2 is expressed both in the stromal and epithelial regions. Colon Cancer 1, T3N0M0, IIA; Colon Cancer 2, T4N1M0, Stage IIIB. Bars: 50 μm
We next explored genes that were highly coexpressed with DIO2 in CRC tissues. We first calculated Spearman's correlation coefficient (ρ) between the expression levels of DIO2 and other genes in TCGA COAD (colon cancer) as well as in TCGA READ (rectal cancer) datasets. Two‐dimensional mapping of the pairing coefficient of each gene showed a strong positive correlation (Pearson's correlation coefficient; r = 0.845, 95% confident interval, 0.842‐0.848) and 2‐D kernel density estimation revealed the points were concentrated near the origin and formed a unimodal distribution (Figure 6C). We then selected 195 genes that showed highly positive correlated expression with DIO2 in both the sets (ρ ≥ 0.6). Enrichment analysis of those genes showed high correlation of DIO2 expression with that of the ensemble of ECM genes (Figure 6D; red bars), suggesting a close association of DIO2 expression with the stromal compartment of CRC tissues. Intriguingly, we found ANTXR1 was one of the most strongly correlated genes with DIO2 in CRC tissues (Figure 6E). ANTXR1 was initially identified as one of a number of genes involved in colon tumor angiogenesis and was thus named tumor endothelial marker 8 (TEM8).30, 31 The correlation analysis also suggested that DIO2 mRNA was highly coexpressed with other tumor‐specific endothelial marker genes (CD248, ADGRA2, and PLXDC1; Figure 6E).
Our analysis of Apc Δ716 tumors indicated a close anatomical and functional relationship between Dio2 and COX‐2 expression (Figures 2C and 5E). We thus examined an association between DIO2 and COX‐2 in human clinical samples. Analysis of TCGA data showed that COX‐2 expression was not highly correlated with DIO2 (Figure 6E). Immunohistochemistry analysis revealed that COX‐2 was expressed both in the stromal and epithelial regions of human colon cancer samples (Figure 6F). The weaker correlation between COX‐2 and DIO2 in human CRC could be explained by strong epithelial expression of COX‐2 in advanced human CRC.
4. DISCUSSION
This study showed that DIO2 promotes intestinal tumor formation in Apc Δ716 mice. Treatment with IOP, a classical radiograph contrast agent that acts as a DIO2 inhibitor, suppressed intestinal tumor formation in Apc Δ716 mice and increased their survival (Figure 3D,E). Iodothyronine deiodinase 2 serves as a local activator of TH signaling by deiodinating T4 and thereby converting it into bioactive T3 (Figure 1A). Consistent with the TH‐activating function of DIO2, the chemical thyroidectomy also suppressed the growth of Apc Δ716 polyps (Figure 4D). We found almost exclusive expression of Dio2 mRNA in the stroma compartment of intestinal tumors in Apc Δ716 polyps (Figure 2A). Although it is not clear which cell types in the tumor stroma express DIO2, partly due to the lack of a reliable Ab that can be used for immunochemical or flow cytometric analysis of DIO2 expression, in situ hybridization analysis for Dio2 and immunostaining for COX‐2 in serial sections suggest that DIO2 is most likely expressed by fibroblasts and/or vascular endothelial cells (Figure 2C). Furthermore, we were able to show that treatment with the COX‐2 inhibitor meloxicam reduced the Dio2 level in Apc Δ716 tumors (Figure 5E). These findings are consistent with the established role of COX‐2 and prostaglandin E2 in promoting intestinal tumorigenesis by enhancing angiogenesis.28 Seno et al28 also showed that the angiogenic switch by COX‐2 was mediated by the EP2 receptor, which is expressed by both vascular endothelial cells and fibroblasts. Collectively, our data indicate that DIO2 is a downstream effector of COX‐2 in the microenvironment of Apc Δ716 polyps. Further studies are needed to elucidate the molecular mechanism by which COX‐2 induces DIO2 expression.
Consistent with the results obtained from the mouse model, we found overexpression of DIO2 mRNA in human CRCs using TCGA database and provided in situ hybridization analysis data that indicate the expression of DIO2 in the stromal component of CRC tissues (Figure 6). Previous reports showed both tumor‐promoting and tumor‐suppressive roles of TH signaling in CRC,32 but their mechanistic studies mostly dealt with TH signaling in cancer epithelial cells and not in the tumor stromal cells. Specifically, TRα1 was shown to activate Wnt signaling in intestinal epithelial cells by directly inducing transcription of CTNNB1 gene encoding β‐catenin and the sFRP2 gene encoding a Frizzled‐related protein.8, 9 The same group further showed that transgenic expression of TRα1 in Apc +/1638N mice enhances intestinal tumor formation33 and that knockdown of TRα1 suppressed proliferation of Caco‐2 cells. In contrast, Dentice et al15 suggested the growth‐suppressive roles of TH signaling in CRC cells. In the study, they showed that expression levels of DIO3, a TH inactivator, were elevated in clinical samples of colonic adenomas and CRC compared to normal colon tissues, and that DIO3 knockdown suppressed proliferation of CRC cells.15 They also showed nearly restricted expression of DIO3 in the epithelial compartment of CRC,15 in contrast to the almost exclusive expression of DIO2, a TH activator, in the stroma of Apc Δ716 tumors and human CRC samples (Figures 2C and 6B). An apparently paradoxical observation that both the activator and inhibitor of TH are overexpressed in CRC could be explained by their differential expression in the epithelial and stromal components. Further investigation will be required to fully understand the precise roles of deiodinases and TH signaling in tumor epithelial and stromal cells of CRC.
Although altered expression of DIO2 has been reported in other types of malignancies, including brain tumors and thyroid cancer,29 the role of stromal DIO2 in tumor angiogenesis has not been documented so far. Thyroid hormone signaling itself, however, has been implicated in tumor angiogenesis through binding of the prohormone T4 to integrin αvβ3 on the surface of endothelial and vascular smooth muscle cells.34 Our current study indicates another mechanism by which TH signaling is involved in tumor angiogenesis. It is thus possible that the antiangiogenic effect of chemical thyroidectomy by MMI + PP was partly mediated by the T4/integrin αvβ3 axis.
Here we have found that DIO2 is highly expressed in the stroma of intestinal tumors in Apc Δ716 mice as well as in clinical samples of CRC. Inhibition of deiodinases or chemical thyroidectomy significantly suppressed tumor formation in Apc Δ716 mice accompanied by reduced angiogenesis. The results indicate that DIO2‐regulated TH signaling in the tumor microenvironment is essential for intestinal tumor growth and that DIO2 can be a therapeutic target.
DISCLOSURE
The authors have no conflict of interest to declare.
Supporting information
ACKNOWLEDGMENTS
This work was supported by the Japan Society for the Promotion of Science (Kakenhi Project/Area Number 17K07191 to Y.K.). We thank Noriko Saito and Yuki Nishioka for their technical assistance.
Kojima Y, Kondo Y, Fujishita T, et al. Stromal iodothyronine deiodinase 2 (DIO2) promotes the growth of intestinal tumors in Apc Δ716 mutant mice. Cancer Sci. 2019;110:2520–2528. 10.1111/cas.14100
REFERENCES
- 1. Brent Ga. Mechanisms of thyroid hormone action. J Clin Invest. 2012;122:3035‐3043. [DOI] [PMC free article] [PubMed] [Google Scholar]
- 2. Sirakov M, Plateroti M. The thyroid hormones and their nuclear receptors in the gut: from developmental biology to cancer. Biochim Biophys Acta. 2011;1812:938‐946. [DOI] [PubMed] [Google Scholar]
- 3. Frau C, Godart M, Plateroti M. Thyroid hormone regulation of intestinal epithelial stem cell biology. Mol Cell Endocrinol. 2017;459:90‐97. [DOI] [PubMed] [Google Scholar]
- 4. Goemann IM, Romitti M, Meyer ELS, Wajner SM, Maia AL. Role of thyroid hormones in the neoplastic process: an overview. Endocr Relat Cancer. 2017;24:R367‐R385. [DOI] [PubMed] [Google Scholar]
- 5. Rennert G, Rennert HS, Pinchev M, Gruber SB. A case–control study of levothyroxine and the risk of colorectal cancer. J Natl Cancer Inst. 2010;102:568‐572. [DOI] [PMC free article] [PubMed] [Google Scholar]
- 6. Friedman GD, Schwalbe JS, Habel LA. Re: A case‐control study of levothyroxine and the risk of colorectal cancer. J Natl Cancer Inst. 2011;103:1637‐1639. [DOI] [PMC free article] [PubMed] [Google Scholar]
- 7. Boursi B, Haynes K, Mamtani R, Yang Y‐x. Thyroid dysfunction, thyroid hormone replacement, and colorectal cancer risk. J Natl Cancer Inst. 2015;107:1‐7. [DOI] [PMC free article] [PubMed] [Google Scholar]
- 8. Kress E, Rezza A, Nadjar J, Samarut J, Plateroti M. The frizzled‐related sFRP2 gene is a target of thyroid hormone receptor α1 and activates β‐catenin signaling in mouse intestine. J Biol Chem. 2009;284:1234‐1241. [DOI] [PubMed] [Google Scholar]
- 9. Plateroti M, Kress E, Mori JI, Samarut J. Thyroid hormone receptor alpha 1 directly controls transcription of the beta‐catenin gene in intestinal epithelial cells. Mol Cell Biol. 2006;26:3204‐3214. [DOI] [PMC free article] [PubMed] [Google Scholar]
- 10. Markowitz S, Haut M, Stellato T, Gerbic C, Molkentin K. Expression of the ErbA‐β class of thyroid hormone receptors is selectively lost in human colon carcinoma. J Clin Invest. 1989;84:1683‐1687. [DOI] [PMC free article] [PubMed] [Google Scholar]
- 11. Hörkkö TT, Tuppurainen K, George SM, Jernvall P, Karttunen TJ, Mäkinen MJ. Thyroid hormone receptor β1 in normal colon and colorectal cancer‐association with differentiation, polypoid growth type and K‐ras mutations. Int J Cancer. 2006;118:1653‐1659. [DOI] [PubMed] [Google Scholar]
- 12. Williams GR, Bassett JHD. Deiodinases: the balance of thyroid hormone: local control of thyroid hormone action: role of type 2 deiodinase. J Endocrinol. 2011;209:261‐272. [DOI] [PubMed] [Google Scholar]
- 13. Casula S, Bianco AC. Thyroid hormone deiodinases and cancer. Front Endocrinol. 2012;3:74. [DOI] [PMC free article] [PubMed] [Google Scholar]
- 14. Arrojo e Drigo R, Bianco AC. Type 2 deiodinase at the crossroads of thyroid hormone action. Int J Biochem Cell Biol. 2011;43:1432‐1441. [DOI] [PMC free article] [PubMed] [Google Scholar]
- 15. Dentice M, Luongo C, Ambrosio R, et al. β‐catenin regulates deiodinase levels and thyroid hormone signaling in colon cancer cells. Gastroenterology. 2012;143:1037‐1047. [DOI] [PubMed] [Google Scholar]
- 16. Kester MHA, Kuiper GGJM, Versteeg R, Visser TJ. Regulation of type III iodothyronine deiodinase expression in human cell lines. Endocrinology. 2006;147:5845‐5854. [DOI] [PubMed] [Google Scholar]
- 17. Lee JK, Gordon PR, Stall GM, Gilchrest BA, Kaplan MM. Phenolic and tyrosyl ring iodothyronine deiodination by the Caco‐2 human colon carcinoma cell line. Metabolism. 1989;38:1154‐1161. [DOI] [PubMed] [Google Scholar]
- 18. Network CGA . Comprehensive molecular characterization of human colon and rectal cancer. Nature. 2012;487:330‐337. [DOI] [PMC free article] [PubMed] [Google Scholar]
- 19. Oshima M, Oshima H, Kitagawa K, Kobayashi M, Itakura C, Taketo M. Loss of Apc heterozygosity and abnormal tissue building in nascent intestinal polyps in mice carrying a truncated Apc gene. Proc Natl Acad Sci. 1995;92:4482‐4486. [DOI] [PMC free article] [PubMed] [Google Scholar]
- 20. Livak KJ, Schmittgen TD. Analysis of relative gene expression data using real‐time quantitative PCR and the 2‐ΔΔCT method. Methods. 2001;25:402‐408. [DOI] [PubMed] [Google Scholar]
- 21. Ritchie ME, Phipson B, Wu D, et al. Limma powers differential expression analyses for RNA‐sequencing and microarray studies. Nucleic Acids Res. 2015;43:e47. [DOI] [PMC free article] [PubMed] [Google Scholar]
- 22. Hong F, Breitling R, McEntee CW, Wittner BS, Nemhauser JL, Chory J. RankProd: a bioconductor package for detecting differentially expressed genes in meta‐analysis. Bioinformatics. 2006;22:2825‐2827. [DOI] [PubMed] [Google Scholar]
- 23. Tripathi S, Pohl MO, Zhou Y, et al. Meta‐ and orthogonal integration of influenza “oMICs” data defines a role for UBR4 in virus budding. Cell Host Microbe. 2015;18:723‐735. [DOI] [PMC free article] [PubMed] [Google Scholar]
- 24. Oshima M, Dinchuk JE, Kargman SL, et al. Suppression of intestinal polyposis in Apc delta716 knockout mice by inhibition of cyclooxygenase 2 (COX‐2). Cell. 1996;87:803‐809. [DOI] [PubMed] [Google Scholar]
- 25. Braga M, Cooper DS. Oral cholecystographic agents and the thyroid. J Clin Endocrinol Metab. 2001;86:1853‐1860. [DOI] [PubMed] [Google Scholar]
- 26. Bernal J, Guadaño‐Ferraz A. Analysis of thyroid hormone-dependent genes in the brain by in situ hybridization. Methods Mol. Biol. 2002: 202: 71‐90. [DOI] [PubMed] [Google Scholar]
- 27. Dohán O, De la Vieja A, Paroder V, et al. The sodium/iodide symporter (NIS): characterization, regulation, and medical significance. Endocr Rev. 2003;24:48‐77. [DOI] [PubMed] [Google Scholar]
- 28. Seno H, Oshima M, Ishikawa TO, et al. Cyclooxygenase 2‐ and prostaglandin E2 receptor EP2‐dependent angiogenesis in ApcΔ716 mouse intestinal polyps. Can Res. 2002;62:506‐511. [PubMed] [Google Scholar]
- 29. Goemann IM, Marczyk VR, Romitti M, Wajner SM, Maia AL. Current concepts and challenges to unravel the role of iodothyronine deiodinases in human neoplasias. Endocr Relat Cancer. 2018;25:R625‐R645. [DOI] [PubMed] [Google Scholar]
- 30. Chaudhary A, Hilton MB, Seaman S, et al. TEM8/ANTXR1 blockade inhibits pathological angiogenesis and potentiates tumoricidal responses against multiple cancer types. Cancer Cell. 2012;21:212‐226. [DOI] [PMC free article] [PubMed] [Google Scholar]
- 31. St. Croix B, Rago C, Velculescu V, et al. Genes expressed in human tumor endothelium. Science. 2000;289:1197‐1202. [DOI] [PubMed] [Google Scholar]
- 32. Brown AR, Simmen RCM, Simmen Fa. The role of thyroid hormone signaling in the prevention of digestive system cancers. Int J Mol Sci. 2013;14:16240‐16257. [DOI] [PMC free article] [PubMed] [Google Scholar]
- 33. Kress E, Skah S, Sirakov M, et al. Cooperation between the thyroid hormone receptor TRalpha1 and the WNT pathway in the induction of intestinal tumorigenesis. Gastroenterology. 2010;138:1863‐1874. [DOI] [PubMed] [Google Scholar]
- 34. Luidens MK, Mousa SA, Davis FB, Lin HY, Davis PJ. Thyroid hormone and angiogenesis. Vascul Pharmacol. 2010;52:142‐145. [DOI] [PubMed] [Google Scholar]
Associated Data
This section collects any data citations, data availability statements, or supplementary materials included in this article.
Supplementary Materials


