Abstract
Drug resistance makes treatment difficult in cancers. The present study identifies and analyzes drug resistance‐related miRNA in colorectal cancer. We established 4 types of 5‐fluorouracil (5‐FU)‐resistant colon cancer cell lines in vitro and in vivo. We then analyzed the miRNA expression profile by miRNA array in these 4 cell lines, and identified the drug resistance‐related miRNAs. We examined the expression levels of the identified miRNA in 112 colorectal tumor samples from the patients. We identified 12 possible miRNAs involved in 5‐FU resistance by miRNA arrays. We then examined the relationship between miR‐31, which was the most promising among them, and drug resistance. The ectopic expression of mimic miR‐31 showed significant 5‐FU resistance in the parental DLD‐1 cells, while anti–miR‐31 caused significant growth inhibition in DLD/F cells; that is, 5‐FU‐resistant colon cancer cell line DLD‐1 under exposure to 5‐FU. When we exposed high doses of 5‐FU to parent or 5‐FU‐resistant cells, the expression levels of miR‐31 were raised higher than those of controls. Notably, the expression levels of miR‐31 were positively correlated with the grade of clinical stages of colorectal tumors. The protein expression levels of factors inhibiting hypoxia‐inducible factor 1 were downregulated by transfection of mimic miR‐31 into DLD‐1 cells. This study provides evidence supporting the association of miR‐31 with 5‐FU drug resistance and clinical stages of colorectal tumors.
Keywords: 5‐fluorouracil, colorectal cancer, drug resistance, microRNA, Warburg effect
1. INTRODUCTION
MicroRNAs (miRNAs or miRs) are endogenous approximately 22‐nt non‐coding RNAs that negatively regulate gene expression by inhibiting the translation of mRNAs in a sequence‐specific manner.1, 2, 3 More than 3000 miRNAs in the human genome have already been identified (http://www.mirbase.org/), and up t33o one‐third of all human mRNAs are predicted to target plural target mRNAs in various cancers.3 Each miRNA can target more than 200 different transcripts directly or indirectly,4, 5 and more than one miRNA can converge on a single mRNA target.3, 6 Therefore, the potential regulatory circuitry afforded by miRNAs is enormous. These findings support the notion that alterations of miRNA copy number and their regulatory genes should be highly prevalent in cancer, because genomic aberrations are closely associated with carcinogenesis.7, 8 Recent increasing evidence shows that the expression of miRNA genes is deregulated in human cancers.7, 8 Previously, we reported that the dysregulation of miRNA‐143, ‐145, ‐7, ‐34a and ‐21 might have affected the endoscopic appearance and development pathways of colorectal tumors.9, 10 Moreover, we reported that the miR‐143 showed a significant tumor‐suppressive effect of DLD‐1 human colorectal cancer cells in vitro and in vivo through silencing KRAS signaling networks.9, 11, 12
Currently, many anti–cancer drugs have been developed and used for metastatic and adjuvant treatment of colorectal cancer.13fluorouracil (5‐FU)14 is one of the most popular and important anticancer drugs for colorectal cancer in the world.13 Therefore, the drug resistance of 5‐FU makes treatment with systemic chemotherapy difficult in colorectal cancer. It is reported that dysregulation of microRNA expression causes drug resistance in colorectal cancer.15, 16, 17, 18, 19
In the current study, we established 4 types of 5‐FU‐resistant colon cancer cell lines in in vitro and in vivo mouse models. We analyzed the miRNA expression profile by miRNA array and found the predictive 5‐FU resistance‐related miRNAs. Among them, we concluded that miR‐31 is closely involved in 5‐FU resistance in colorectal cancer cells.
2. MATERIALS AND METHODS
2.1. Reagents
5‐fluorouracil (FUJIFILM Wako Pure Chemical Corporation) was diluted with (DMSO, FUJIFILM) in vitro or normal saline in vivo. H2O2, oxaliplatin and irinotecan (FUJIFILM) was diluted with DMSO.
2.2. Cell culture and cell viability
Human colorectal malignant cell lines DLD‐1 and SW480 were grown in RPMI‐1640 medium supplemented with 10% (v/v) heat‐inactivated FBS (Sigma) and 2 mmol/L L‐glutamine under an atmosphere of 95% air and 5% CO2 at 37°C. Other cell lines, such as SW480 (KRAS‐mutated), WiDr (BRAF‐mutated), HT‐29 (BRAF‐mutated) and SW48 (both wild) cells, were also used. The evaluation of cell growth was determined by trypan blue (FUJIFILM Wako Pure Chemical Corporation, Tokyo, Japan) dye‐exclusion assay. For evaluating IC50, the starting cell number was 1 × 10⁵/mL.
2.3. Establishing 5‐fluorouracil‐resistant colon cancer cell lines in vitro and in vivo
We establish 5‐FU‐resistant colon cancer cell lines in vitro. First, we sowed DLD‐1 or SW480 cells in a culture bottle and exposed the cells to a low dose 5‐FU (half dose of IC50). 5‐FU was diluted with DMSO. We repeatedly gradually exposed 5‐FU in low to high doses to DLD‐1 or SW480 cells, and were able to establish DLD/F (5‐FU‐resistant DLD‐1) and SW/F (5‐FU‐resistant SW480).
At the same time, we establish 5‐FU‐resistant colon cancer cell lines in an in vivo mouse model. Animal experimental protocols were approved by our institute's Committee for Ethics in Animal Experimentation, and animal experiments were conducted in accordance with the guidelines for Animal Experiments of Fujita Health University. Human colon cancer DLD‐1 cells were injected with 2 × 10⁶ cells/100 μL per site on the subcutaneous xenograft nude mice (CAnN.Cg‐Foxn1 nu /CrlCrlj; Charles River, San Diego, CA, USA) aged 5 weeks, which is set as day 0. Tumor size was monitored by measuring the length and width with calipers, and volumes were calculated using the formula: (L × W 2) × 0.5, where L is the length and W is the width of each tumor. When the tumor sized reached 150 mm3, 5‐FU (50 mg/kg) was administered intraperitoneally once a week. 5‐FU was diluted using normal saline. As a control, normal saline was intraperitoneally administered once a week. When tumor size reached 900 mm3, we collected tumors from mice, and we sowed and cultured tumor cells in a culture bottle. Once the cell numbers increased, the tumor cells were again transplanted into mice. We repeated this procedure twice, and we were able to establish 2 types of 5‐FU‐resistant cell lines (mDLD/F1 and mDLD/F2) and control cell lines mDLDc in an in vivo mouse model.
2.4. Cell cycle distribution
Quantification of cell cycle distribution was determined by using FACS.20 Briefly, the cells were harvested and fixed with 70% cold ethanol at −20°C overnight. The fixed cells were washed twice with PBS, resuspended in 100‐μL PBS‐based propidium iodide solution containing 0.1% Triton X‐100 (Wako Pure Chemical Industries), 0.2 mg/mL RNase A (Invitrogen) and 20 μg/mL propidium iodide (Invitrogen), and incubated for 30 minutes at room temperature protected from the light. The DNA content in the cells was analyzed by cytometry (Invitrogen, Waltham, MA, USA).
2.5. Patients and tissue preparation
All human samples were obtained in a fresh state from patients who had undergone a direct biopsy for diagnosis or surgery for resection of colorectal tumors at Fujita Health University Hospital (Aichi, Japan), Saiseikai Ibaraki Hospital (Osaka, Japan), Osaka Medical College Hospital (Osaka, Japan) or Kyoritsu General Hospital (Aichi, Japan) between 2002 and 2018. No fresh frozen or formalin‐fixed, paraffin‐embedded (FFPE) samples were used in this study. Two pathologists diagnosed each sample based on the Japanese Classification of Colorectal Carcinoma (8th edition).21 Informed consent in writing was obtained from each patient. The protocol was approved by the Ethics Committee of Fujita Health University Hospital. At first, we analyzed the expression level of identified microRNA in colorectal tumor tissues compared with adjacent normal colon tissues in the same patient. We examined the identified miRNA expression levels in 112 sporadic colorectal tumors (28 low grade tubular or tubulovillous adenomas, 18 high grade tubular or tubulovillous adenomas, 10 tubular carcinomas in situ, 12 tubular carcinomas invading submucosa and 44 advanced cancers). Next, we analyzed the expression level of identified microRNA in colorectal tumors to examine the association of target proteins. We examined the identified miRNA expression levels in 112 sporadic colorectal polyps (7 hyperplastic polyps and 14 serrated adenomas).
2.6. RNA isolation and quantitative real‐time PCR
Total RNA was isolated from the tissues using TRIzol containing phenol/guanidium isothiocyanate and treatment with DNase I.9, 10, 11 At first, expression levels of miRNAs <0.50 were designated as downregulated and >2.00 as upregulated through estimating microRNA array estimation (Human miRNA Oligo chip, TORAY, Tokyo, Japan).
After that, to examine the expression levels of miRNAs in detail, we performed TaqMan MicroRNA Assays using a real‐time PCR apparatus (Life Technologies, Grand Island, NY, USA).9, 10, 11, 22, 23, 24 We examined the expression levels of tumor miRNAs compared with those of the paired normal samples in a blinded fashion. The threshold cycle (Ct) is defined as the fractional cycle number at which the fluorescence passes a fixed threshold. The range of Ct values of these miRNAs in colorectal cancer was from 18 to 40. In our data, we judged that there was no miRNA expression over 28 cycles, because there were miRNA molecules less than 50 copies per 1 mL in Ct value 28. The levels of miRNAs in each tissue were measured and normalized to those of U6, which was used as an internal control.9, 10, 11, 24 The relative expression levels were calculated using the ΔΔCt method. The relative expression level in normal tissue was indicated as “1.”
In human samples, the tumor/non‐tumor ratio of each miRNA expression in the samples was determined. The tumor/non‐tumor ratio of each miRNA expression in the samples was expressed using box‐and‐whisker plots.
2.7. Transfection experiments
DLD‐1 and DLD/F cells were seeded in 6‐well plates at a concentration of 0.5 × 10⁵/well (10%‐30% confluence) on the day before the transfection. The mature types of miR‐31 (has‐miR‐31‐5p, mirVana miRNA mimic; Life Technologies) and anti–miR‐31 (Anti–miR miRNA Inhibitor; Life Technologies) were used for the transfection of the cells, which was achieved by using cationic liposomes, Lipofectamine RNAiMAX (Life Technologies), according to the manufacturer's lipofection protocol. The nonspecific miRNA (mirVana miRNA Mimic, Negative Control #1, Life Technologies) was used as a control for nonspecific effects.10, 15, 16, 25, 26 The sequence of the mature type of miR‐31 used in this study was 5′‐AGGCAAGAUGCUGGCAUAGCU ‐3′. The effects manifested by the introduction of miRs into the cells were assessed at 48 hours after the transfection. The effects manifested by the introduction of miRNAs into the cells were assayed at 48 hours after the transfection by western blot and quantitative RT‐PCR analyses for miRNA.
2.8. Western blotting
The cells were homogenized in chilled RIPA buffer comprising 50 mmol/L Tris‐HCl buffer (pH7.6), 150 mmol/L NaCl, 1% Nonidet P40, 0.5% sodium deoxycholate and 0.1% SDS and stood for 30 minutes on ice. After centrifugation at 13 000 rpm for 20 minutes at 4°C, the supernatants were collected as protein samples. Protein contents were measured with a BCA Protein Assay Kit (Takara Bio, Shiga, Japan). Ten micrograms of lysate protein for western blotting of cyclin D1 (Cell Signaling Technology), CDK4 (Cell Signaling Technology), cyclin B1, factor inhibiting hypoxia‐inducible factor 1 (FIH1, Cell Signaling Technology), PKM1 (Novus Biologicals) and GAPDH (Cell Signaling Technology, Danvers, MA, USA) was separated by SDS‐PAGE using a 10% polyacrylamide gel and electroblotted onto a PVDF membrane (Du Pont, Wilmington, DE, USA). After blockage of nonspecific binding sites for 1 hour with 5% nonfat milk in PBS containing 0.1% Tween 20, the membrane was incubated overnight at 4°C with the first antibody. The membranes were then washed 3 times with PBS containing 0.1% Tween 20, incubated further with HRP‐conjugated sheep anti–mouse or donkey anti–rabbit Ig antibody (Amersham Biosciences) at room temperature, and then washed 3 times with PBS containing 0.1% Tween 20. The immunoblots were visualized using an enhanced chemiluminescence detection kit (ECL Prim, Amersham Biosciences).
2.9. Statistics and data analysis
Each examination was performed in triplicate. In experiments on clinical samples, expression levels >10.0 were designated as upregulated, for which fold changes were obtained from the results of linear discriminant analysis of miR‐31 expression patterns from pairs of colon tumors and non‐tumorous tissues. Statistical differences of miRNA levels were evaluated by using Pearson's χ2 test, Fisher's extract test, or single‐factor ANOVA for differences between 2 groups. A P‐value of 0.05 was considered significant. All calculations were performed by using software BellCurve for Excel (version 2; SSRI).
3. RESULTS
We were able to establish 5‐FU‐resistant colon cancer cell lines in in vitro and in vivo mouse models. We named DLD/F cells, which are 5‐FU‐resistant DLD‐1 cells in vitro, SW/F cells, which are 5‐FU‐resistant SW480 cells in vitro, mDLDc, which are control DLD‐1 cells in vivo, and mDLD/F1 and mDLD/F2, which are 5‐FU‐resistant DLD‐1 produced in an in vivo experiment. We examined the effect of 5‐FU at various concentrations on cytotoxity in these cells, as judged by trypan blue‐exclusion test (Figure 1A). The 5‐FU‐resistant cell proliferation rate was lower compared to that of the 5‐FU non‐treatment cells (Figure 1A). The IC50 value of 5‐FU was DLD‐1: 7.64 ± 0.25 μmol/L, DLD/F: 41.23 ± 0.24 μmol/L, SW480: 4.19 ± 0.35 μmol/L, SW/F: 21.28 ± 0.20 μmol/L, mDLDc: 4.23 ± 0.12 μmol/L, mDLD/F1: 17.68 ± 0.14 μmol/L, and mDLD/F2: 19.78 ± 0.13 μmol/L. In contrast, IC50 of irinotecan, oxaliplatin and H2O2 had no significant difference between 5‐FU‐resistant cells and 5‐FU non‐treatment cells (data not shown).
Figure 1.
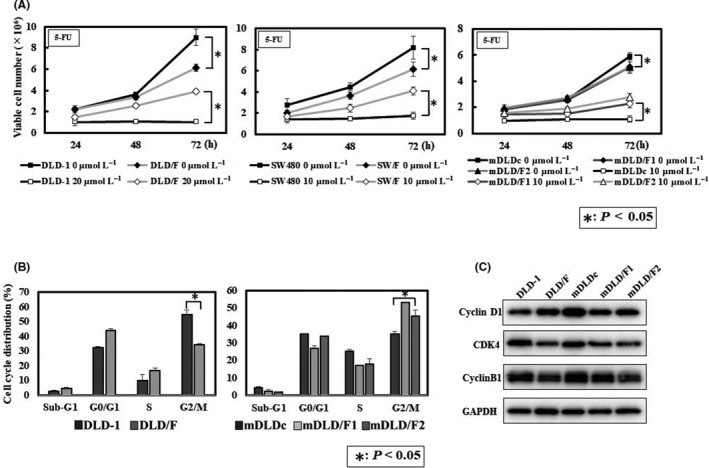
Established 5‐fluorouracil (5‐FU)‐resistant cell growth in human colorectal cancer cell line. A, Effect of 5‐FU on cell growth of parent and 5‐FU‐resistant cells at various concentrations. Cell numbers after treatment with 5‐FU were evaluated using the trypan‐blue dye exclusion test. B, Cell cycle distribution of parent and 5‐FU‐resistant cells. C, The expression of cell cycle‐related protein in parent and 5‐FU‐resistant cells
Cell proliferation of 5‐FU‐resistant cells was significantly slower than that of parent cells (Figure 1A). We examined the cell cycle of parent cells and 5‐FU‐resistant cells. Cell cycle analysis indicated a trend that G0/G1 arrest in DLD/F cells and G2/M arrest in mDLD/F1 and 2 cells were evident compared with parent cells (Figure 1B). The protein expression of CDK4 and Cyclin B1, which were cell cycle‐related proteins,27 was lower in 5‐FU cells than parent cells (Figure 1C).
We examined the miRNA expression profile in 5‐FU‐resistant cells compared with 5‐FU non‐treatment cells. Seven miRNAs were overexpressed in 5‐FU‐resistant cells compared with parent cells and 5 miRNAs were overexpressed in parent cells compared with 5‐FU‐resistant cells (Figure 2A). We found that miR‐31 was most promising among these miRNAs, because miR‐31 was more frequently overexpressed in 5‐FU‐resistant cells than 5‐FU non‐treatment cells. We next analyzed the relationship between upregulation of miR‐31 and 5‐FU resistance.
Figure 2.
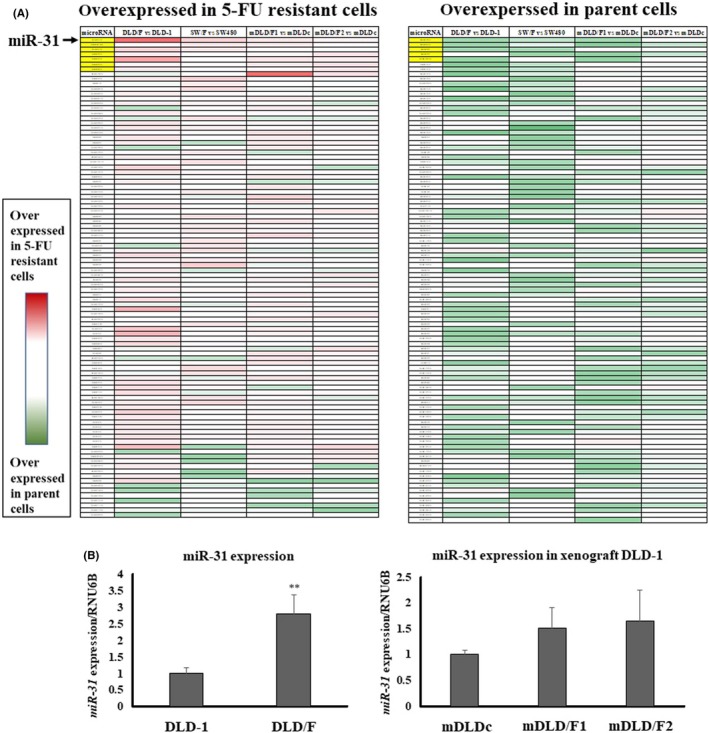
Identification of miRNAs involved in 5‐fluorouracil (5‐FU) resistance in colon cancer cells. A, The heatmap of miRNA expression profiles between the 5‐FU treated and non‐treated cells. miR‐31 (arrow) was more frequently overexpressed in 5‐FU resistant cells than 5‐FU non‐treatment cells. B, Expression levels of miR‐31 in parent and 5‐FU‐resistant cells. Right panel: DLD‐1 and DLD/F cells. Left panel: mDLDc, mDLD/F1 and mDLD/F2 cells. The relative expression levels were calculated using the ΔΔCt method, with RNU6B used as a control
Subsequently, we examined whether the expression level of miR‐31 contributed to 5‐FU resistance. First, we compared the expression level of miR‐31 in 5‐FU‐resistant cells with parent cells (Figure 2B). The expression level of miR‐31 in 5‐FU‐resistant cells was higher than in parent cells. Next, mimic miR‐31 caused a significant resistance to 5‐FU in DLD‐1 cells, which are 5‐FU resistant colon cancer cells of DLD‐1 after the exposure of 5‐FU (Figure 3A). In contrast, anti–miR‐31 caused significant growth inhibition in DLD/F cells (Figure 3B). When we exposed a high dose of 5‐FU to parent or 5‐FU‐resitant cells, the expression levels of miR‐31 were raised higher than those of control cells (Figure 4).
Figure 3.
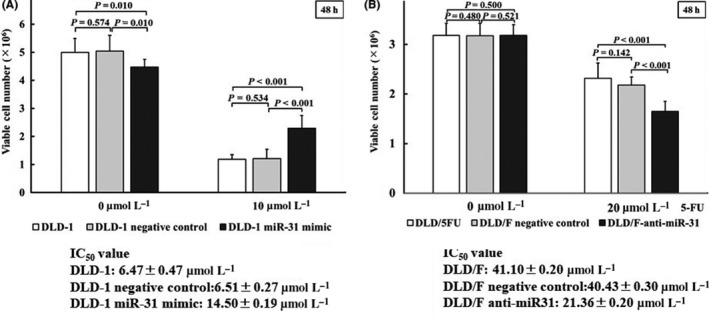
Effect of 5‐fluorouracil (5‐FU) exposed DLD‐1 and DLD/F cells. A, Expression levels of miR‐31 in mimic miR‐31 transfected DLD‐1 cells treated with 10 μmol/L of 5‐FU for 48 h. B, Expression levels of miR‐31 in miR‐31 inhibitor transfected DLD/F cells treated with 20 μmol/L of 5‐FU for 48 h. The relative expression levels were calculated using the ΔΔCt method, with RNU6B used as a control
Figure 4.
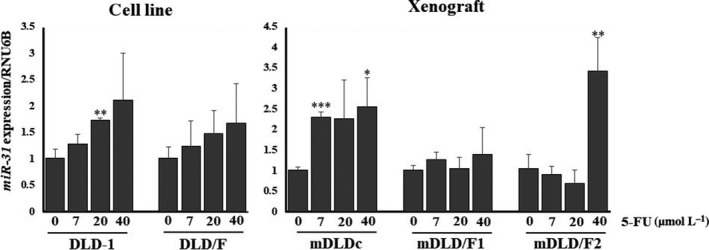
Expression levels of miR‐31 in parent or 5‐fluorouracil (5‐FU)‐resistant cells treated with various concentrations of 5‐FU for 48 h. The relative expression levels were calculated using the ΔΔCt method, with RNU6B used as a control
We determined that one of the important target genes related to chemoresistance of miR‐31 was FHI‐1 (http://microrna.sanger.ac.uk/). FIH‐1 is also known as hypoxia inducible factor 1 alpha subunit inhibitor (HIF1AN). It has already been reported that miR‐31 inhibited the expression of FIH‐1.28, 29 In addition, FIH‐1 inhibited the expression of PKM1.20 We examined the expression of FIH‐1 protein after transfection of the mimic miR‐31 into the parent cells by western blot analysis (Figure 5A). The expression levels of FIH‐1 protein were markedly decreased and PKM1 protein was increased by transfection with mimic miR‐31 in parent cells. We also examined the expression of FIH‐1 protein after transfection of the anti–miR‐31 into the 5‐FU‐resistant cells (Figure 5B). The expression levels of FIH‐1 protein were increased by transfection with anti–miR‐31 in 5‐FU‐resistant cells. In addition, silencing FIH‐1 increased the resistance to 5‐FU in SW48 (KRAS wild) and DLD‐1 (KRAS mutant) cells (Figure 5C).
Figure 5.
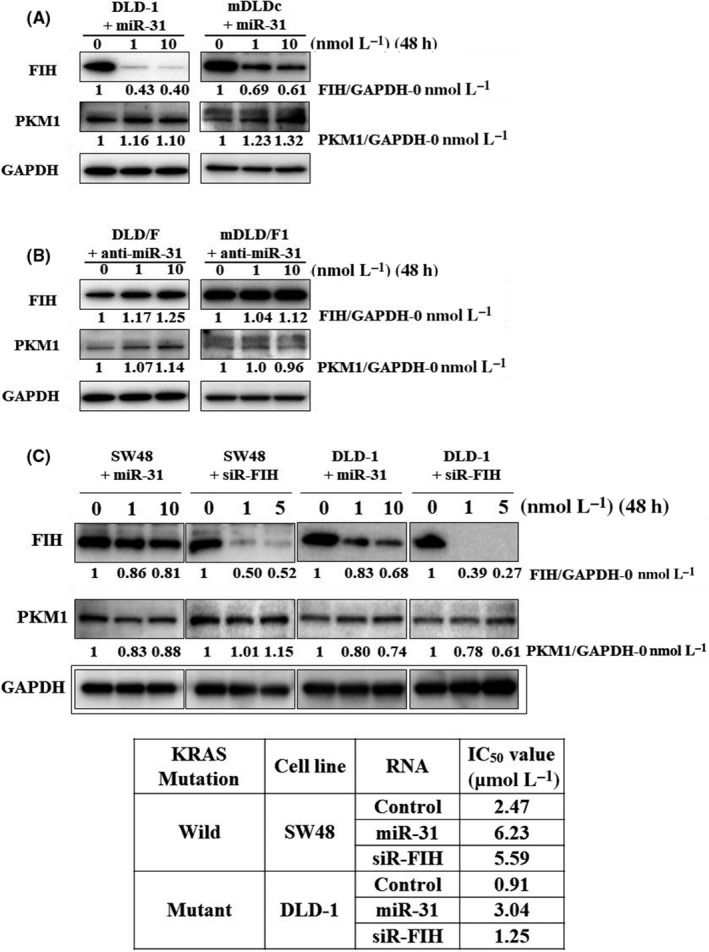
The expression levels of FIH‐1 and PKM‐1 protein in colorectal cells. These proteins were examined by western blot analysis. A, Mimic miR‐31 was transfected in DLD‐1 or mDLDc cells. B, miR‐31 inhibitor was transfected in DLD/F or mDLD/F1 cells. C, siRNA of FIH‐1 or mimic miR‐31 was transfected in SW48 (KRAS wild) and DLD‐1 (KRAS mutant) cells
Finally, we analyzed the expression level of miR‐31 in colorectal tumor tissues and compared this with that of adjacent normal colon tissues in the same patient. The expression level in each tumor sample was evaluated using the relative ratio of tumor to non‐tumor tissue. The expression level of miR‐31 was lower in adenoma or early cancer depth mucosa than early cancer depth submucosa or advanced cancer (Figure 6). Expression levels of >10.0 were considered upregulated. The expression levels of miR‐31 in adenoma and carcinoma in situ were significantly lower than those of carcinomas invading submucosa and advanced cancers (Table 1). The expression level of miR‐31was positively associated with the grade of the clinical stage of colorectal tumors.
Figure 6.
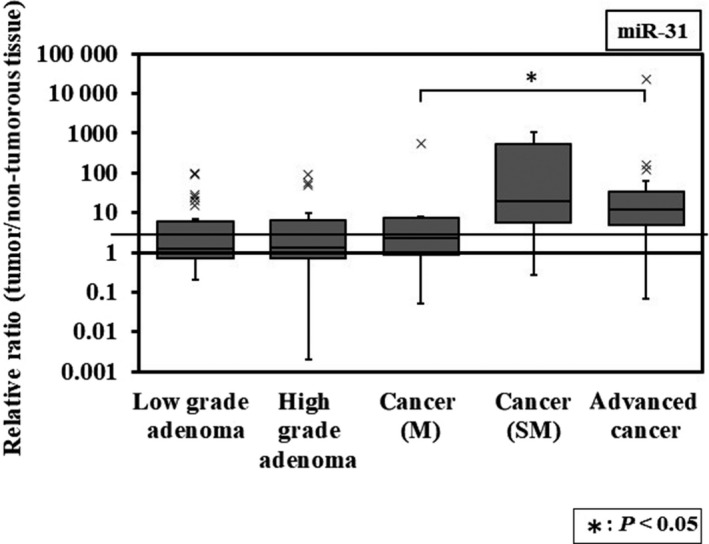
Box‐and‐whisker plots of miRNA‐31 expression in colorectal tumors. The relative expression levels were calculated using the ΔΔCt method, with RNU6B used as a control. The relative expression level in normal tissue was indicated as “1.” M, carcinoma in situ; SM, carcinoma invades submucosa
Table 1.
Expression of miR‐31 in human colorectal tumor tissues were evaluated by performing TaqMan real‐time PCR assays
| Colorectal tumor | n | Overexpression of miR‐31 | P‐value |
|---|---|---|---|
| Low‐grade adenoma | 28 | 6 (21.4%) | 0.008 |
| High‐grade adenoma | 18 | 3 (16.6%) | |
| Cancer (M) | 10 | 1 (10.0%) | |
| Cancer (SM) | 12 | 7 (58.3%) | |
| Advanced cancer | 44 | 25 (56.8%) | |
| Adenoma and cancer (M) | 56 | 10 (17.9%) | 0.001 |
| Cancer (SM and advanced) | 56 | 32 (57.1%) |
The relative expression levels were calculated using the ΔΔCt method, with RNU6B used as a control. The relative expression level in normal tissue was indicated as “1.” The expression levels in tumors were designated as upregulated when the fold change from the expression in the non‐tumorous tissue was 10.0. Statistical differences in miRNA levels were evaluated by using Pearson's χ2 test and, Fisher's exact test for differences between 2 groups. A P‐value of 0.05 was considered to be significant; statistical analysis was done in this manner for all subsequent tables. M, carcinoma in situ; SM, carcinoma invades submucosa.
4. DISCUSSION
Various regimens were developed with the aim of more effective treatment for metastatic and adjuvant treatment of colorectal cancer.13 For example, 5‐FU/leucovorin,30, 31, 32 FOLFOX (5‐FU, leucovorin and oxaliplatin)33, 34, 35 or FOLFIRI (5‐FU, leucovorin and irinotecan)34, 35, 36, 37 FOLFOXILI (5‐FU, leucovorin, oxaliplatin and irinotecan)35, 36, 37 are well‐known regimens globally. 5‐FU is one of most important anticancer drugs for treatment of colorectal adenocarcinoma.13
Drug resistance of anticancer drugs makes treatment with systemic chemotherapy difficult. Many studies have reported on the mechanisms of drug resistance.38 Recently, it has become clear that microRNA plays an important role in drug resistance for chemotherapy of cancer.18, 19 We previously reported that miR‐34a or miR‐145 was related to drug resistance in colorectal cancer, too.15, 16, 17 In this study, we suggested that miR‐31 was related to the 5‐FU resistance in colorectal cancer. There are some reports that miR‐31 is related to the 5‐FU resistance in colorectal cancer.39, 40 Korourian et al and Li et al reported that miR‐31 targeted RhoA,39 and a long non‐cording RNA for 5‐FU resistance, respectively.39 In our data, mimic miR‐31 caused a significant 5‐FU resistance in control mother cells (Figure 3A). Moreover, anti–miR‐31 caused significant growth inhibition in 5‐FU‐resistant cells after the expose of 5‐FU (Figure 3B). When we exposed a high dose of 5‐FU to parent or 5‐FU‐resistant cells, the expression levels of miR‐31 were increased more compared with no treatment cells (Figure 4). Our data suggested that miR‐31 played on important role in 5‐FU resistance of colorectal cancer. It is necessary to note that introduction of mimic‐miR‐31 suppresses cell proliferation of colorectal cancer cells but causes drug resistance (Figure 3A).
The Warburg effect is a well‐known feature of cancer cell metabolism.41 In addition, it is well known that there are many factors that establish the Warburg effect (eg, HIF‐1 and c‐Myc).42 We previously reported the relationship between drug resistance and the Warburg effect.20, 43 Hypoxia‐inducible factor 1α (HIF‐1α) is an important protein to maintain the Warburg effect, because HIF‐1α mediated transcriptional responses to localized hypoxia in normal tissues and in cancers and can promote tumor progression by altering cellular metabolism and stimulating angiogenesis.44 There were some reports concerning the relationship between drug resistance and HIF‐1.45, 46, 47 FIH‐1 inhibited HIF‐1α activity. FIH‐1 protein inhibited PKM‐1.20 Moreover, there were some reports that miR‐31 targeted FIH and enhanced the Warburg effect.26, 27, 48 In our data, the protein expression levels of FIH‐1 were decreased markedly; in contrast, those of PKM‐1 were increased by the transfection with mimic miR‐31 in DLD‐1 cells (Figure 5). Moreover, the growth ability of 5‐FU‐resistant cells was lower than that of control cells (Figure 1A). Our data suggested that the protein expression of CDK4 and Cyclin B1 was lower in 5‐FU cells than parent cells (Figure 1C). There was likely inhibition of transition from G1 to S1 phase in 5‐FU‐resistant cells. Furthermore, the expression level of miR‐31 was higher in early cancer invading submucosa or advanced cancer than carcinoma in situ or adenoma (Figure 6 and Table 1). These data might suggest that upregulated miR‐31 expression caused 5‐FU resistance in colorectal cancer through maintenance of the Warburg effect (Figure S1).
The serrated neoplastic pathway came with the discovery that mutations in the oncogene BRAF occur in serrated polyps.49, 50 In addition, high miR‐31 expression was significantly associated with BRAF mutation in colorectal cancers.50 We examined the expression levels of miR‐31 in serrated adenomas and hyperplastic polyps. The expression level of miR‐31 was higher in serrated adenomas than hyperplastic polyps (P = 0.078; Table S1). It was certain that BRAF mutant cells (WiDr and HT‐29) showed high expression of miR‐31 (Figure S2). However, a clear positive correlation was not found between BRAF mutation/miR‐31 high expression and 5‐FU resistance in the steady‐state cells. The signaling cascade by induced miR‐31 after the 5‐FU exposure may function for the 5‐FU resistance.
In this study, we mainly analyzed the relationship between 5‐FU resistance and the miRNA profile of colorectal tumors. Moreover, the expression level of miR‐31 was higher in carcinomas invading submucosa or advanced cancer than in carcinomas in situ or adenomas. These data might suggest that the increased expression level of miR‐31 caused 5‐FU resistance in colorectal cancer through silencing FIH‐1, which is associated with cancer‐specific energy metabolism.
Supporting information
5. ACKNOWLEDGMENT
We are grateful for the support of the staff of the Gastroenterology Department of Fujita Heath University. This work was supported in part by a Grant‐in‐Aid for Scientific Research (C) by Japan Society for the Promotion of Science.
Nakagawa Y, Kuranaga Y, Tahara T, et al. Induced miR‐31 by 5‐fluorouracil exposure contributes to the resistance in colorectal tumors. Cancer Sci. 2019;110:2540–2548. 10.1111/cas.14090
Funding information This study was supported by grants from Fujita Health University and by a Grant‐in‐aid for scientific research from the Ministry of Education, Science, Sports, and Culture of Japan. Nakagawa's research was supported by joint research funds from Eli Lilly Japan.
REFERENCES
- 1. Lee RC, Feinbaum RL, Ambros V. The C. elegans heterochronic gene lin‐4 encodes small RNAs with antisense complementarity to lin‐14. Cell. 1993;75:843‐854. [DOI] [PubMed] [Google Scholar]
- 2. Ambros V. The functions of animal microRNAs. Nature. 2004;431:350‐355. [DOI] [PubMed] [Google Scholar]
- 3. Lewis BP, Burge CB, Bartel DP. Conserved seed pairing, often flanked by adenosines, indicates that thousands of human genes are microRNA targets. Cell. 2005;120:15‐20. [DOI] [PubMed] [Google Scholar]
- 4. Bartel DP, Chen CZ. Micromanagers of gene expression: the potentially widespread influence of metazoan microRNAs. Nat Rev Genet. 2004;5:396‐400. [DOI] [PubMed] [Google Scholar]
- 5. Lim LP, Lau NC, Garrett‐Engele P, et al. Microarray analysis shows that some microRNAs downregulate large numbers of target mRNAs. Nature. 2005;433:769‐773. [DOI] [PubMed] [Google Scholar]
- 6. Kiriakidou M, Nelson PT, Kouranov A, et al. A combined computational experimental approach predicts human microRNA targets. Genes Dev. 2004;18:1165‐1178. [DOI] [PMC free article] [PubMed] [Google Scholar]
- 7. Croce CM, Calin GA. miRNAs, cancer, and stem cell division. Cell. 2005;122:6‐7. [DOI] [PubMed] [Google Scholar]
- 8. Gregory RI, Shiekhattar R. MicroRNA biogenesis and cancer. Cancer Res. 2005;65:3509‐3512. [DOI] [PubMed] [Google Scholar]
- 9. Nakagawa Y, Akao Y, Taniguchi K, et al. Relationship between expression of onco‐related miRNAs and the endoscopic appearance of colorectal tumors. Int J Mol Sci. 2015;16:1526‐1543. [DOI] [PMC free article] [PubMed] [Google Scholar]
- 10. Nakagawa Y, Akao Y, Tahara T, et al. Development and endoscopic appearance of colorectal tumors are characterized by the expression profiles of miRNAs. Med Mol Morphol. 2018;51:82‐88. [DOI] [PubMed] [Google Scholar]
- 11. Akao Y, Nakagawa Y, Hirata I, et al. Role of anti‐oncomirs miR‐143 and ‐145 in human colorectal tumors. Cancer Gene Ther. 2010;17:398‐408. [DOI] [PubMed] [Google Scholar]
- 12. Akao Y, Kumazaki M, Shinohara H, et al. Impairment of K‐Ras signaling networks and increased efficacy of epidermal growth factor receptor inhibitors by a novel synthetic miR‐143. Cancer Sci. 2018;109:1455‐1467. [DOI] [PMC free article] [PubMed] [Google Scholar]
- 13. Gustavsson B, Carlsson G, Machover D, et al. A review of the evolution of systemic chemotherapy in the management of colorectal cancer. Clin Colorectal Cancer. 2015;14:1‐10. [DOI] [PubMed] [Google Scholar]
- 14. Heidelberger C, Chaudhuri NK, Danneberg P, et al. Fluorinated pyrimidines, a new class of tumour‐inhibitory compounds. Nature. 1957;179:663‐666. [DOI] [PubMed] [Google Scholar]
- 15. Akao Y, Noguchi S, Iio A, et al. Dysregulation of microRNA‐34a expression causes drug‐resistance to 5‐FU in human colon cancer DLD‐1 cells. Cancer Lett. 2011;300:197‐204. [DOI] [PubMed] [Google Scholar]
- 16. Kumazaki M, Noguchi S, Yasui Y, et al. Anti‐cancer effects of naturally occurring compounds through modulation of signal transduction and miRNA expression in human colon cancer cells. J Nutr Biochem. 2013;24:1849‐1858. [DOI] [PubMed] [Google Scholar]
- 17. Akao Y, Khoo F, Kumazaki M, et al. Extracellular disposal of tumor‐suppressor miRs‐145 and ‐34a via microvesicles and 5‐FU resistance of human colon cancer cells. Int J Mol Sci. 2014;15:1392‐1401. [DOI] [PMC free article] [PubMed] [Google Scholar]
- 18. Xie T, Huang M, Wang Y, et al. MicroRNAs as regulators, biomarkers and therapeutic targets in the drug resistance of colorectal cancer. Cell Physiol Biochem. 2016;40:62‐76. [DOI] [PubMed] [Google Scholar]
- 19. Wu QB, Sheng X, Zhang N, et al. Role of microRNAs in the resistance of colorectal cancer to chemoradiotherapy. Mol Clin Oncol. 2018;8:528‐532. [DOI] [PMC free article] [PubMed] [Google Scholar]
- 20. Taniguchi K, Sakai M, Sugito N, et al. PKM1 is involved in resistance to anti‐cancer drugs. Biochem Biophys Res Commun. 2016;473:174‐180. [DOI] [PubMed] [Google Scholar]
- 21. Japanese Society for Cancer of the Colon and Rectum . Japanese Classification of Colorectal Carcinoma, 8th edn Tokyo: Kanehara Shuppan; 2013. [Google Scholar]
- 22. Akao Y, Nakagawa Y, Kitade Y, et al. Down‐regulation of microRNAs‐143 and ‐145 in B‐cell malignancies. Cancer Sci. 2007;98:1914‐1920. [DOI] [PMC free article] [PubMed] [Google Scholar]
- 23. Nakagawa Y, Iinuma M, Naoe T, et al. Characterized mechanism of α‐mangostin‐induced cell death: caspase‐independent apoptosis with release of endonuclease‐G from mitochondria and increased miR‐143 expression in human colorectal cancer DLD‐1 cells. Bioorg Med Chem. 2007;15:5620‐5628. [DOI] [PubMed] [Google Scholar]
- 24. Takagi T, Iio A, Nakagawa Y, et al. Decreased expression of microRNA‐143 and ‐145 in human gastric cancers. Oncology. 2009;77:12‐21. [DOI] [PubMed] [Google Scholar]
- 25. Akao Y, Nakagawa Y, Iio A, et al. Role of microRNA‐143 in Fas‐mediated apoptosis in human T‐cell leukemia Jurkat cells. Leuk Res. 2009;33:1530‐1538. [DOI] [PubMed] [Google Scholar]
- 26. Akao Y, Nakagawa Y, Naoe T. MicroRNAs 143 and 145 are possible common onco‐microRNAs in human cancers. Oncol Rep. 2006;16:845‐850. [PubMed] [Google Scholar]
- 27. Roskoski R Jr. Cyclin‐dependent protein kinase inhibitors including palbociclib as anticancer drugs. Pharmacol Res. 2016;107:249‐275. [DOI] [PubMed] [Google Scholar]
- 28. Liu CJ, Tsai MM, Hung PS, et al. miR‐31 ablates expression of the HIF regulatory factor FIH to activate the HIF pathway in head and neck carcinoma. Cancer Res. 2010;70:1635‐1644. [DOI] [PubMed] [Google Scholar]
- 29. Chen T, Yao LQ, Shi Q, et al. MicroRNA‐31 contributes to colorectal cancer development by targeting factor inhibiting HIF‐1α (FIH‐1). Cancer Biol Ther. 2014;15:516‐523. [DOI] [PMC free article] [PubMed] [Google Scholar]
- 30. Poon MA, O'Connell MJ, Moertel CG, et al. Biochemical modulation of fluorouracil: evidence of significant improvement of survival and quality of life in patients with advanced colorectal carcinoma. J Clin Oncol. 1989;7:1407‐1418. [DOI] [PubMed] [Google Scholar]
- 31. Petrelli N, Herrera L, Rustum Y, et al. A prospective randomized trial of 5‐fluorouracil versus 5‐fluorouracil and high‐dose leucovorin versus 5‐fluorouracil and methotrexate in previously untreated patients with advanced colorectal carcinoma. J Clin Oncol. 1987;5:1559‐1565. [DOI] [PubMed] [Google Scholar]
- 32. Petrelli N, Douglass HO Jr, Herrera L, et al. The modulation of fluorouracil with leucovorin in metastatic colorectal carcinoma: a prospective randomized phase III trial. Gastrointestinal Tumor Study Group. J Clin Oncol. 1989;7:1419‐1426. [DOI] [PubMed] [Google Scholar]
- 33. Goldberg RM, Sargent DJ, Morton RF, et al. A randomized controlled trial of fluorouracil plus leucovorin, irinotecan, and oxaliplatin combinations in patients with previously untreated metastatic colorectal cancer. J Clin Oncol. 2004;22:23‐30. [DOI] [PubMed] [Google Scholar]
- 34. Colucci G, Gebbia V, Paoletti G, et al. Phase III randomized trial of FOLFIRI versus FOLFOX4 in the treatment of advanced colorectal cancer: a multicenter study of the Gruppo Oncologico Dell'Italia Meridionale. J Clin Oncol. 2005;23:4866‐4875. [DOI] [PubMed] [Google Scholar]
- 35. Tournigand C, André T, Achille E, et al. FOLFIRI followed by FOLFOX6 or the reverse sequence in advanced colorectal cancer: a randomized GERCOR study. J Clin Oncol. 2004;22:229‐237. [DOI] [PubMed] [Google Scholar]
- 36. Souglakos J, Androulakis N, Syrigos K, et al. FOLFOXIRI (folinic acid, 5‐fluorouracil, oxaliplatin and irinotecan) vs FOLFIRI (folinic acid, 5‐fluorouracil and irinotecan) as first‐line treatment in metastatic colorectal cancer (MCC): a multicentre randomised phase III trial from the Hellenic Oncology Research Group (HORG). Br J Cancer. 2006;94:798‐805. [DOI] [PMC free article] [PubMed] [Google Scholar]
- 37. Falcone A, Ricci S, Brunetti I, et al. Phase III trial of infusional fluorouracil, leucovorin, oxaliplatin, and irinotecan (FOLFOXIRI) compared with infusional fluorouracil, leucovorin, and irinotecan (FOLFIRI) as first‐line treatment for metastatic colorectal cancer: the Gruppo Oncologico Nord Ovest. J Clin Oncol. 2007;25:1670‐1676. [DOI] [PubMed] [Google Scholar]
- 38. Elbadawy M, Usui T, Yamawaki H, et al. Development of an experimental model for analyzing drug resistance in colorectal cancer. Cancers. 2018;10:pii E164. [DOI] [PMC free article] [PubMed] [Google Scholar]
- 39. Korourian A, Roudi R, Shariftabrizi A, et al. MicroRNA‐31 inhibits RhoA‐mediated tumor invasion and chemotherapy resistance in MKN‐45 gastric adenocarcinoma cells. Exp Biol Med. 2017;242:1842‐1847. [DOI] [PMC free article] [PubMed] [Google Scholar]
- 40. Li J, Li X, Cen C, et al. The long non‐coding RNA ENST00000547547 reduces 5‐fluorouracil resistance of colorectal cancer cells via competitive binding to microRNA‐31. Oncol Rep. 2018;39:217‐226. [DOI] [PubMed] [Google Scholar]
- 41. Warburg O. On the origin of cancer cells. Science. 1956;123:309‐314. [DOI] [PubMed] [Google Scholar]
- 42. Doe MR, Ascano JM, Kaur M, et al. Myc posttranscriptionally induces HIF1 protein and target gene expression in normal and cancer cells. Cancer Res. 2012;72:949‐957. [DOI] [PMC free article] [PubMed] [Google Scholar]
- 43. Kumazaki M, Shinohara H, Taniguchi K, et al. Perturbation of the Warburg effect increases the sensitivity of cancer cells to TRAIL‐induced cell death. Exp Cell Res. 2016;347:133‐142. [DOI] [PubMed] [Google Scholar]
- 44. Keith B, Simon MC. Hypoxia‐inducible factors, stem cells, and cancer. Cell. 2007;129:465‐472. [DOI] [PMC free article] [PubMed] [Google Scholar]
- 45. Chen F, Zhuang M, Zhong C, et al. Baicalein reverses hypoxia‐induced 5‐FU resistance in gastric cancer AGS cells through suppression of glycolysis and the PTEN/Akt/HIF‐1α signaling pathway. Oncol Rep. 2014;33:457‐463. [DOI] [PubMed] [Google Scholar]
- 46. Yang SY, Song BQ, Dai SL, et al. Effects of hypoxia‐inducible factor‐1α silencing on drug resistance of human pancreatic cancer cell line Patu8988/5‐Fu. Hepatogastroenterology. 2014;61:2395‐2401. [PubMed] [Google Scholar]
- 47. Wu WD, Hu ZM, Shang MJ, et al. Cordycepin down‐regulates multiple drug resistant (MDR)/HIF‐1α through regulating AMPK/mTORC1 signaling in GBC‐SD gallbladder cancer cells. Int J Mol Sci. 2014;15:12778‐12790. [DOI] [PMC free article] [PubMed] [Google Scholar]
- 48. Zhu B, Cao X, Zhang W, et al. MicroRNA‐31‐5p enhances the Warburg effect via targeting FIH. FASEB J. 2019;33:545‐556. [DOI] [PubMed] [Google Scholar]
- 49. Leggett B, Whitehall V. Role of the serrated pathway in colorectal cancer pathogenesis. Gastroenterology. 2010;138:2088‐2100. [DOI] [PubMed] [Google Scholar]
- 50. Nosho K, Igarashi H, Nojima M, et al. Association of microRNA‐31 with BRAF mutation, colorectal cancer survival and serrated pathway. Carcinogenesis. 2014;35:776‐783. [DOI] [PubMed] [Google Scholar]
Associated Data
This section collects any data citations, data availability statements, or supplementary materials included in this article.
Supplementary Materials


