

Abstract
Abnormal tumor microenvironment and the epithelial‐mesenchymal transition (EMT) are important features of tumor metastasis. However, it remains unknown how signals can form complicated networks to regulate the sustainability of the EMT process. The aim of our study is to explore the possible interaction between tumor‐associated macrophages and tumor cells in the EMT process mediated by microRNA (miR)‐362‐3p. In this study, we found that by releasing TGF‐β, M2 macrophages mediate binding of Smad2/3 to miR‐362‐3p promoter, leading to overexpression of miR‐362‐3p. MicroRNA‐362‐3p maintains EMT by regulating CD82, one of the most important members of the family of tetraspanins. Our finding suggests that miR‐362‐3p can serve as a core factor mediating cross‐talk between the TGF‐β pathway in tumor‐associated macrophages and tetraspanins in tumor cells, and thus facilitates the EMT process.
Keywords: epithelial‐mesenchymal transition, miR‐362‐3p, Smad, TGF‐β, tumor‐associated macrophage
1. INTRODUCTION
Tumor cells and the tumor microenvironment are interrelated, tangled, and mutually promoted. Growth and invasion of tumor is closely related to its microenvironment, which plays a key role in tumor biology. Tumor‐associated macrophages (TAMs) are the main immune cells in the tumor microenvironment. They infiltrate tumor tissues to provide growth and invasion signals and conditions for tumor cells.1, 2 Tumor‐associated macrophages can be subdivided into 2 groups: classically activated macrophages (M1‐like) and alternatively activated macrophages (M2‐like). It is believed that TAMs act as a “double‐edged sword” in tumor development: M1‐like macrophages exert pro‐inflammatory or antitumor activity, whereas M2‐like macrophages act as tumor‐promoting cells.3, 4
MicroRNAs (miRNAs) are a class of endogenous small (approximately 15‐25 nucleotides in length) noncoding RNAs that can regulate gene expression by binding to the 3′‐UTR. MicroRNAs are involved in several cellular functions, including proliferation, differentiation, and death.5, 6 Recent studies have revealed that in response to microenvironmental signals, miRNAs regulate macrophage polarization by modulating transcription factors, that induce expression of M1 (miR‐21, miR‐27a/b, miR‐130a/b, and miR‐155) and M2 (miR‐125a/b, miR‐146a/b, miR‐124, miR‐181a, and let‐7c).7, 8, 9, 10, 11, 12, 13, 14, 15, 16
Epithelial‐mesenchymal transition (EMT) is an important catcher for connecting microenvironment and tumor cells. Current evidence suggests that EMT can be divided into 3 subtypes. Type 1 EMT involves in evolutional development. Type 2 EMT relates to epithelial or endothelial cells transitioning to resident tissue fibroblasts, which is induced in response to persistent inflammation; type 3 EMT is seen in carcinogenesis or metastasis.17 It is recognized that the 3 subtypes of EMT have some phenotypic similarities. For example, increased expression of N‐cadherin or vimentin, and complete or partial loss of epithelial markers such as E‐cadherin and ZO‐1.17, 18, 19 In general, EMT is accompanied by a loss of membrane localization of E‐cadherin: a “cadherin transition” from E‐cadherin to N‐cadherin. Level changes of epithelial and mesenchymal markers are often used to distinguish between EMT and partial EMT phenotypes.20, 21 Therefore, as a hallmark of EMT, cadherin switching stands a unique biological position.
In our previous study,22 we found that miR‐362‐3p levels in gastric cancer (GC) cell lines are higher than in normal gastric mucosa cell lines. Poorly differentiated GC cell lines (AGS and MKN45) with high expression of miR‐362‐3p showed lower expression of CD82 at both mRNA and protein levels, whereas highly differentiated GC cell lines (MKN28 and MGC803) showed only low expression levels of miR‐362‐3p. Furthermore, we also identified that miR‐362‐3p directly regulated CD82, one of the most important members of the tetraspanin family, which negatively regulated EMT progression in several human cancers. But is this a phenomenon confined to GC, or does it exist among other digestive cancers as well? To answer this question, we investigated the effect of miR‐362‐3p on hepatocellular carcinoma (HCC) cells after transformation of cells into M1 and M2 macrophages in the tumor microenvironment, and tried to explore whether miR‐362‐3p can be used as a core factor to connect TAMs and HCC cells, which then enlarge the EMT process.
2. MATERIALS AND METHODS
2.1. Cell line culture
Hepatocellular carcinoma cell lines (MHCC‐97H, MHCC‐97L, Huh7, Bel‐7402, SMCC‐7721, and HepG2) and normal human hepatocytes (LO2) were cultured in DMEM (Life Technologies, Ann Arbor, MI, USA) supplemented with 10% FBS (Life Technologies) and 1% penicillin/streptomycin, in a 37°C 5% CO2 incubator. The human monocytic cell line THP‐1 and human embryonic kidney (HEK) 293 cells were grown in RPMI‐1640 (Life Technologies) supplemented with 10% FBS and 1% penicillin/streptomycin. All cell lines used in this study were obtained from the Chinese Academy of Sciences and preserved in liquid nitrogen in our laboratory.
2.2. M1 and M2 macrophage phenotype induction
THP‐1 monocytes were seeded and incubated with 25 ng/mL PMA (Sigma‐Aldrich, St. Louis, MO, USA) for 36 hours, followed by washing‐out for 24 hours with drug‐free medium. Cells were further cultured with 20 ng/mL γ‐interferon (recombinant IFN‐γ, Sigma‐Aldrich) and 100 ng/mL lipopolysaccharide (R&D Systems) for 24 hours to induce M1 polarization. Alternatively, cells were incubated with 20 ng/mL interleukin (IL)‐4 (recombinant IL‐4; Sigma‐Aldrich) for 36 hours to induce M2 polarization. THP‐1 macrophage differentiation was verified by monitoring macrophage differentiation markers by flow cytometry. Briefly, PE‐conjugated CD68 Ab and PE‐conjugated CD163 antibody were used. The cells were washed and stained for 30 minutes at 4°C with the optimal dilution of each Ab. Cells were then washed again and analyzed by flow cytometry (EXL, Beckman Coulter). Data were analyzed using FlowJo software.
2.3. Coculture experiments
As described above, THP‐1 cells were induced into M1 or M2 macrophages. THP‐1 cells were seeded in Transwell inserts (0.4 ‐μm pores; Corning Costar, Corning, NY, USA). The inserts were placed in a 12‐well plate with preseeded HCC cells. The inserts containing newly generated THP‐1 macrophages were replaced each day. Cocultures were maintained for 3 days before collection of HCC cells.
2.4. Chromatin immunoprecipitation‐PCR
Chromatin immunoprecipitation‐PCR was carried out using Smad2/3 Ab (ab202445; Abcam, Cambridge, MA, USA). Briefly, DNA and proteins were cross‐linked using formaldehyde and subsequently sonicated. The DNA was then immunoprecipitated with agarose A/G beads and Ab followed by proteinase K digestion. Finally, the precipitated DNA was subjected to PCR amplification in agarose gel. The primer sequences covering the predicted Smad binding sites in the promoter of miR‐362‐3p are described in Table 1.
Table 1.
Primers for real‐time RT‐PCR and ChIP‐PCR
| Gene | Primers (5′‐3′) | Primer sequence |
|---|---|---|
| miR‐362‐3p | RT primer | GTCGTATCCAGTGCAGGGTCCGAGGTATTCGCACTGGATACGACTGAATC |
| Forward primer | CGCCAACACACCTATTCAAGG | |
| Reverse primer | GTGCAGGGTCCGAGGT | |
| U6 RNA | RT primer | CGTTCACGAATTTGCGTGTCAT |
| Forward primer | GCTTCGGCAGCACATATACTAAAAT | |
| Reverse primer | CGCTTCACGAATTTGCGTGTCAT | |
| SBEs in miR‐362‐3p promoter | ||
| SBE1 | Forward primer | CGGGATCATGAGCTTTGGC |
| Reverse primer | GCAAGGATTAGAGAGGGGGAG | |
| SBE2 | Forward primer | CCTTGCTACCTGGGTGAGAG |
| Reverse primer | CCTGCAGAGTTCCATGTGAGAT | |
| SBE3 | Forward primer | TTGTCTGCTCCCCCTCTTGA |
| Reverse primer | CGTTGTATCTCCACCACCCAG | |
miR, microRNA; SBE, Smad binding element.
2.5. Electrophoretic mobility‐shift assay
Electrophoretic mobility‐shift assay was undertaken with biotin‐labeled probes and nuclear extracts obtained from HEK293 cells. DNA‐protein complexes were separated in a 6% polyacrylamide gel and electrophoretically transferred to nylon membranes. The biotin‐labeled DNA was detected by chemiluminescence using a Lightshift Chemiluminescent EMSA Kit (cat. no. 20148; Thermo Fisher Scientific) following the manufacturer's protocol. Biotin‐labeled Smad binding element (SBE) probes of the miR‐362‐3p promoter were synthesized as follows: SBE1 forward (F), 5′‐tgagagaacagacaaaatgtgt‐3′, SBE1 reverse (R), 5′‐acacattttgtctgttctctca‐3′; SBE2‐F, 5′‐gagagtgctgtctgaatgcaat‐3′, SBE2‐R, 5′‐attgcattcagacagcactctc‐3′; SBE3‐F, 5′‐agccttcttgtctgctccccctct‐3′, SBE3‐R, 5′‐agagggggagcagacaagaaggct‐3′.
2.6. RNA isolation and quantitative real‐time PCR
Real‐time PCR was carried out as described in our previous report.22, 23 Total RNA was extracted using TRIzol Reagent (Invitrogen, San Diego, CA, USA). First‐strand cDNA was synthesized from 2 μg total RNA. Amplification and detection were tested using the ABI PRISM 7900 Sequence Detection System (Applied Biosystems, Foster City, CA, USA). Quantitative PCR conditions were as follows: 95°C for 10 minutes followed by 35 cycles of 95°C for 15 seconds and 60°C for 1 minute. The comparative cycle threshold (Ct) method was used to analyze the relative expression of specific mRNAs and miR‐362‐3p. The primer sequences are listed in Table 1.
2.7. Western blot analysis
Western blot analysis was undertaken as described in our previous reports.22, 23 Primary Abs were purchased from Abcam: for GAPDH (ab8235, diluted 1:3000) and CD82 (ab66400), Smad2/3 (ab63399), Smad4 (ab40759), E‐cadherin (ab76055), and N‐cadherin (ab98952; all diluted 1:1000). GAPDH was used as an internal control.
2.8. Vector and lentivirus production and cell transfection
Lentiviral vectors production was carried out as described in our previous report.22 In brief, the shRNAs targeting miR‐362‐3p were inserted into the pGreenPuro shRNA expression lentivector. The shRNAs were designed to be asymmetric and were expressed by the H1 promoter (GenePharma, Shanghai, China). This structure was used to knockdown miR‐362‐3p and named as miR‐362‐3p shRNA. The shRNAs were transfected into MHCC‐97H cells. Stable cell lines were obtained by using 5 μg/mL puromycin (Sigma‐Aldrich) selection for approximately 2 weeks.
2.9. Cell invasion assays
Cell invasion assays were carried out as described previously.23, 24 Briefly, THP‐1 cells were first induced into M2 macrophages as described above. THP‐1 were seeded in the lower inserts of Transwell plates, and HCC Cells (5 × 10⁵) were seeded in the upper inserts. The Transwell chambers were covered with 50 μL of a 1:2 mixture of Matrigel and PBS, and the cells were cultivated for 36 hours. Cells that invaded to the lower surface were stained with Giemsa solution and quantified by counting 3 randomly selected microscopic fields at ×200 magnification.
2.10. Wound healing assay
A cell migration assay was undertaken using the wound healing method as described in our previous report.25 Briefly, HCC cells (5 × 10⁵) were seeded in 6‐well plate. Linear scratch wounds were made using a 200‐μL sterile pipette tip. Next, cell debris was removed by washing the cells with PBS several times to remove the suspended cells and the remaining cells were cultured in serum‐free media. After 0 and 24 hours, we imaged the wounds at the same position under a microscope and the distance between the wound sides was calculated.
2.11. Immunofluorescence staining
Immunofluorescence staining assays were carried out as described previously.23 Cells were incubated overnight with the primary Abs against E‐cadherin (ab76055) and N‐cadherin (ab98952) (1:50 dilution; Abcam, USA) at 4°C. The cells were washed 3 times with PBS (5 minutes each) and then incubated in the dark for 1 hour at room temperature with Alexa Fluor 488 and 550 conjugated goat anti‐rat secondary Ab (1:200 dilution, ab150157 and ab150083; Abcam). Nuclei of cells were stained with DAPI (Sigma‐Aldrich). Images were obtained using a Zeiss LSM 510 META Confocal microscope using 20×/0.5 w and 40×/1.2 w objectives.
2.12. Assessment of tumorigenicity in vivo
Tumorigenicity in vivo was analyzed as described in our previous report.22, 26 In brief, miR‐362‐3p shRNA or Control shRNA‐infected MHCC‐97H cells (5 × 10⁶) suspended in 0.2 mL serum‐free culture medium were s.c. injected into the upper flank region of nude mice. Mice were killed 4 weeks later. These s.c. tumors were harvested, and tumor volume and weight were measured. Tumor volume was calculated using the following formula: volume (mm3) = (width)2 × length / 2. Orthotopic model was constructed by producing s.c. tumors as described above. Then, after 2 weeks, the s.c. tumor, which was 1.0 cm in diameter, was cut into small pieces of approximately 1.0 mm3 that were then orthotopically transplanted into the livers of another 10 nude mice. Of the 10 nude mice, 5 were randomly selected for the miR‐362‐3p shRNA group and the remaining 5 were the control shRNA group. These mice were allowed to grow for 3 months and then killed by cervical dislocation. Livers were resected and photographed using a high‐definition digital camera.
2.13. Statistical analysis
All statistical analyses were undertaken using SPSS 17.0 software (IBM, Armonk, NY, USA). Data are presented as mean ± SD. The statistical significance of multiple group comparisons was calculated using 1‐ or 2‐way ANOVA depending on the experiment, while the statistical significance of 2‐group unpaired comparisons was calculated using Student's t test. Correlation analysis was carried out to assess the relationship between miR‐362‐3p level and CD82, E‐cadherin, or N‐cadherin expression. The analysis of quantitative PCR results for miRNAs was calculated using the 2−ΔΔCt method.27 Differences between groups were considered statistically significant at P < .05 and highly statistically significant at P < .01.
3. RESULTS
3.1. MicroRNA‐362‐3p is upregulated and mediates its target CD82 or EMT markers in HCC cells
First, we confirmed that miR‐362‐3p expression was increased in HCC cells using stem‐loop quantitative real‐time PCR (Figure 1A,B), which was consistent with a previous study by Shen et al.28 In addition, we explored the relationship between the expression of miR‐362‐3p and its target gene CD82 as well as EMT markers (E‐cadherin and N‐cadherin) in different HCC cell lines. CD82 was highly expressed in HCC cells with low expression of miR‐362, and levels of epithelial marker E‐cadherin were also elevated, whereas expression of mesenchymal marker N‐cadherin was decreased (Figure 1A,B). The miR‐362‐3p level was negatively correlated with expression of CD82 (R = −0.792, P = .0337), and was positively related to N‐cadherin (R = 0.849, P = .0158; Figure 1C). These data indicated that miR‐362‐3p was highly expressed in HCC and it could possibly modulate its target CD82 and EMT markers. Although the relationship between miR‐362‐3p and E‐cadherin did not achieve statistical significance (P = .0514) due to the low repeats of experiments, the trend towards a positive correlation was very clear (R = −0.751; Figure 1C).
Figure 1.
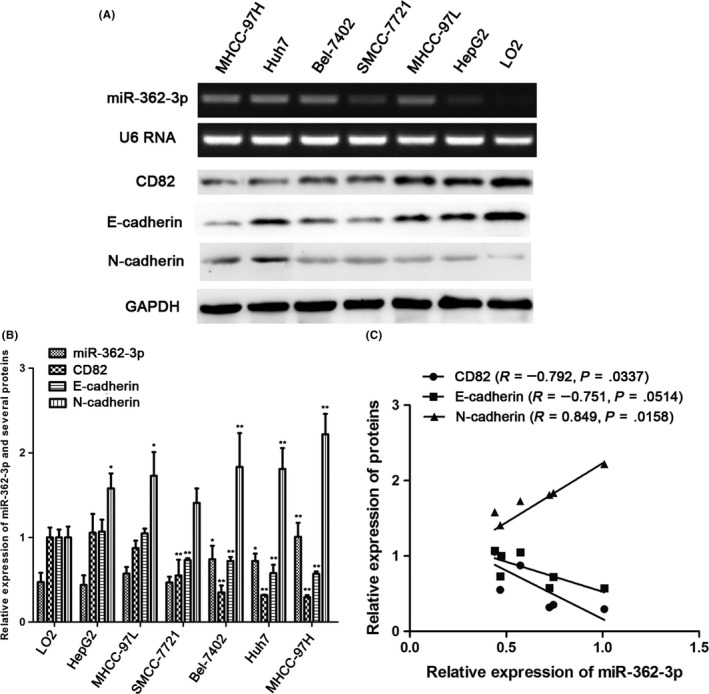
Analysis of microRNA (miR)‐362‐3p and downstream protein expression in hepatocellular carcinoma (HCC) cells. A,B, Expression of miR‐362‐3p, CD82, and epithelial‐mesenchymal transition markers (E‐cadherin and N‐cadherin) was examined in HCC cells and normal human hepatocytes. *P < .05 vs normal human hepatocytes, **P < .01 vs normal human hepatocytes. C, Spearman's correlations between the expression of miR‐362‐3p and its downstream proteins (CD82, E‐cadherin, and N‐cadherin) in HCC cells
3.2. MicroRNA‐362‐3p expression significantly promotes proliferation, invasion, and metastasis of HCC cells
To evaluate the roles of miR‐362‐3p in cell migration and invasion, wound healing and Transwell invasion assays were carried out using HCC cells. Wound healing assays showed that miR‐362‐3p mimics markedly increased HCC cell migration, whereas miR‐362‐3p inhibitors significantly inhibited HCC cell migration (Figure 2A,B). Results of Transwell invasion assays indicated that the invasiveness of HCC cells transfected with miR‐362‐3p mimics was significantly increased, whereas it was decreased in those transfected with the miR‐362‐3p inhibitors (Figure 2C‐F). These results indicate that miR‐362‐3p regulates the malignant biological behavior of HCC cells.
Figure 2.
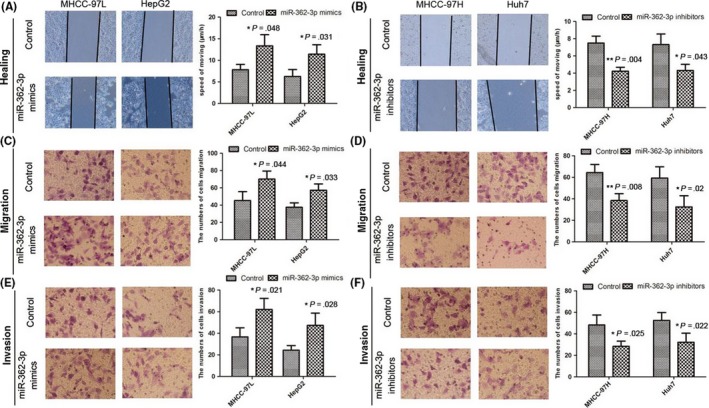
MicroRNA (miR)‐362‐3p expression significantly promotes proliferation, invasion, and metastasis of hepatocellular carcinoma cells. A,B, Cell migration activity was measured by wound healing assay after transfection with miR‐362‐3p mimics and miR‐362‐3p inhibitors. *P < .05; **P < .01. C‐F, To evaluate cell invasiveness, Transwell assays were carried out on miR‐362‐3p mimics and miR‐362‐3p inhibitors. *P < .05; **P < .01
3.3. MicroRNA‐362‐3p shRNA significantly inhibited the carcinogenesis of nude mouse and regulated the expression of CD82 and EMT markers in HCC
To substantiate the relationship between miR‐362‐3p and CD82 and EMT markers, HCC cells were stably transfected with miR‐362‐3p shRNA, which induced miR‐362‐3p silencing. MicroRNA‐362‐3p shRNA HCC cells and normal control HCC cells were implanted into the nude mice by s.c. injection. At 4 weeks postinjection, the mean weight and volume of tumors generated from the miR‐362‐3p shRNA cells were significantly smaller than those originated from normal control HCC cells (Figure 3A, B). Next, according to the method mentioned above, the orthotopic model was built after 3 months. The mice were killed and the livers were resected. These findings indicate that miR‐362‐3p effectively induces the tumorigenesis of HCC cells. Immunohistochemistry of the HCC xenograft tissues revealed that tumors with decreased miR‐362‐3p expression tended to express high levels of CD82 and E‐cadherin and lower levels of N‐cadherin (Figure 3C,D). These findings confirm that miR‐362‐3p promotes the process of EMT.
Figure 3.
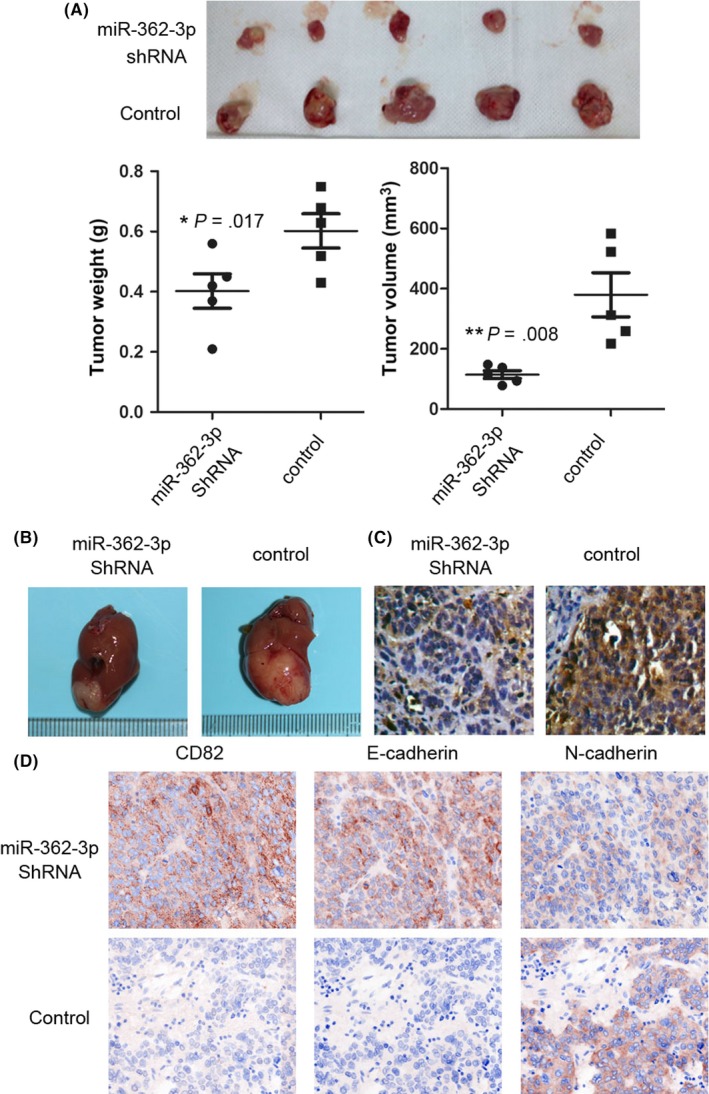
MicroRNA (miR)‐362‐3p shRNA significantly inhibited the carcinogenesis of nude mouse and the expression of CD82 and epithelial‐mesenchymal transition markers in hepatocellular carcinoma (HCC) cells. HCC cells stably transfected with miR‐362‐3p shRNA or normal control (NC) were s.c. injected into nude mice and the tumor weight and volume was calculated after injection. A,B, Representative images of tumor volume and immunohistochemistry photographs are shown. *P < .05; **P < .01. C, in situ hybridization of miR‐362‐3p was undertaken in a nude mice xenograft model. D, Images to visualize positive staining of CD82, E‐cadherin, and N‐cadherin in tumor which generated with miR‐362‐3p shRNA cells or NC cells
3.4. Transforming growth factor‐β stimulates miR‐362‐3p and its downstream proteins in HCC cells
We then investigated whether TGF‐β regulated miR‐362‐3p expression in HCC cells. The levels of miR‐362‐3p in HCC cells were analyzed after treatment with increasing concentrations of TGF‐β over different durations. As shown in Figure 4A,B, TGF‐β promoted miR‐362‐3p expression in a concentration‐ and time‐dependent manner in HCC cells. Twelve and 24 hours of TGF‐β treatment achieved maximal stimulation of miR‐362‐3p expression (Figure 4A). We then tested the optimal stimulatory concentration of TGF‐β on miR‐362‐3p. Results showed that TGF‐β at 5 ng/mL or higher induced miR‐362‐3p expression in HCC cells (Figure 4B). In addition, the effects of TGF‐β on expression of its downstream signaling proteins and EMT markers were detected. As expected, TGF‐β stimulated the expression of Smad2/3 and N‐cadherin while it downregulated E‐cadherin expression. However, Smad4 expression remained unchanged. Furthermore, TGF‐β also reduced CD82 expression, the target of miR‐362‐3p (Figure 4C).
Figure 4.
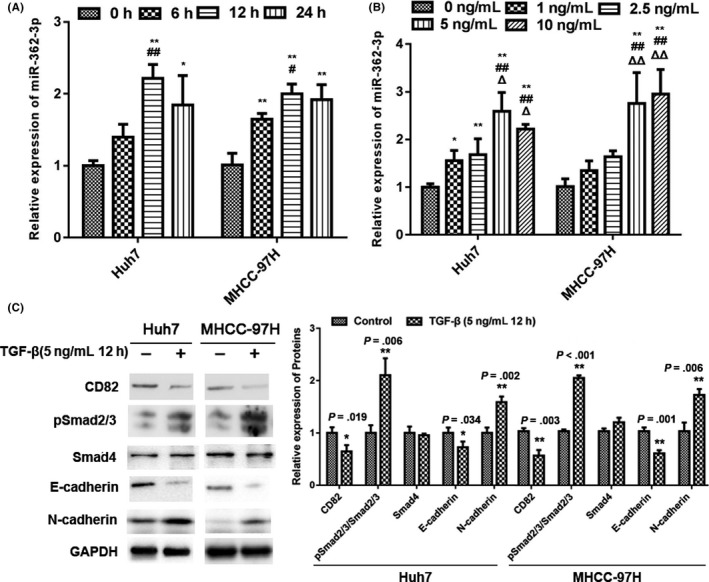
Transforming growth factor (TGF)‐β stimulates microRNA (miR)‐362‐3p and related protein expression in hepatocellular carcinoma (HCC) cells. A, TGF‐β stimulates miR‐362‐3p expression in a time‐dependent manner in HCC cells. *P < .05 vs TGF‐β treatment for 0 h; **P < .01 vs TGF‐β treatment for 0 h; #P < 0.05 vs TGF‐β treatment for 6 h; ##P < 0.01 vs TGF‐β treatment for 6 h. B, TGF‐β stimulates miR‐362‐3p expression in a dose‐dependent manner in HCC cells. Symbols (*, #, &, and △) represent P < .05 vs treatment with 0, 1, 2.5, and 5 ng/mL TGF‐β, respectively. C, TGF‐β mediates related protein expression. HCC cells were treated with 5 ng/mL TGF‐β for 12 h as indicated and western blot analysis was carried out. GAPDH was used as an internal control
3.5. M2 macrophages promote miR‐362‐3p expression and its effector protein change via TGF‐β signaling
It is well known that the differentiation of macrophages into the M2 subtype is reflected by increased expression of TGF‐β. Therefore, we tested the effect of TGF‐β on the expression of miR‐362‐3p and HCC cells during the directed polarization of macrophages. Macrophages were derived from THP‐1 cells (a human monocyte cell line) after treated with 50 ng/mL PMA for 24 hours (M0) and were subsequently polarized into the M1 or M2 phenotype (Figure 5A). As expected, secreted TGF‐β from both M1 and M2 macrophages was significantly increased; of them, the increase from M2 macrophages was greatest (Figure 5B).
Figure 5.
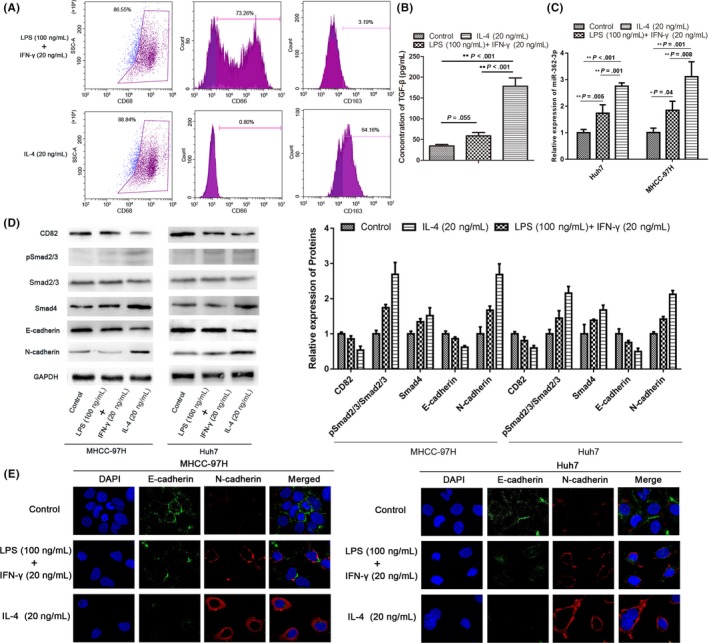
M2 macrophages promote microRNA (miR)‐362‐3p and subsequent effector protein changes through transforming growth factor (TGF)‐β signaling. A, THP‐1 cells were treated with PMA (25 ng/mL) for 36 h with subsequent addition of interleukin (IL)‐4 (20 ng/mL) for 36 h. THP‐1 cells treated with PMA/IL‐4 showed significant induction of CD68 (a marker of macrophage differentiation) and CD163 (a marker of M2 macrophages; upper panel). THP1 cells were incubated with 20 ng/mL γ‐interferon (IFN‐γ) and 100 ng/mL lipopolysaccharide (LPS) for 24 h after treatment with PMA (25 ng/mL) for 36 h. Culture‐derived M1 macrophages were positive for CD86 but not for CD163 (lower panel). B, Active TGF‐β is released by 2 types of differentiated macrophages. C, Expression of miR‐362‐3p was detected in hepatocellular carcinoma (HCC) cells cocultured with 2 types of differentiated macrophages. D, Subsequent effector protein expression was analyzed by western blot in HCC cells cocultured with 2 types of differentiated macrophages. E, Epithelial‐mesenchymal transition markers (E‐cadherin and N‐cadherin) expression in HCC cells in experimental groups were detected by immunofluorescence using confocal microscopy. Bars represent mean ± SD. *P < .05; **P < .01
To clarify whether differently polarized macrophages affected subsequent signaling through TGF‐β‐/miR‐362‐3p in HCC cells, a coculture system was used. Human HCC cells (Huh7 and MHCC‐97H) were cocultured with M1 or M2 macrophages. We found that the expression of miR‐362‐3p in HCC cells cocultured with M2 macrophages was significantly increased. In contrast, expression of miR‐362‐3p was only slightly increased when cells were cocultured with M1 macrophages compared with nondifferentiated monocytes (Figure 5C). These results confirmed that, similar to the exogenous TGF‐β stimulation experiments, M2 macrophages induced a decrease in CD82 expression, the direct target of miR‐362‐3p. Subsequently, E‐cadherin expression was downregulated and N‐cadherin expression was upregulated in GC and HCC cells (Figure 5D). However, unlike the exogenous TGF‐β stimulation experiments, M2 macrophages not only increased Smad2/3 phosphorylation, but also significantly enhanced Smad4 expression. Immunofluorescence showed that morphology of HCC cells cocultured with M2 macrophages was changed. The gap between cells is larger compared with control or cells cocultured with M1 macrophages, accompanied by a decrease in the expression of E‐cadherin, and an increase of N‐cadherin (Figure 5E). This phenomenon might occur because M2 macrophages also secrete other cytokines in addition to TGF‐β.
3.6. Transforming growth factor‐β signals regulate the EMT process in tumor cells by modulating miR‐362‐3p and its related protein expression
To further confirm our findings, we took advantage of a TGFβRI inhibitor (SB431542) and a specific inhibitor of Smad3 (SIS3).29 As shown in Figure 6A,B, treatment with 3 μmol/L SIS3 or 20 nmol/L SB431542 reduced phosphorylation of Smad2/3 induced by exogenous TGF‐β, accompanied by inhibition of miR‐362‐3p and N‐cadherin expression, while expression of CD82 and E‐cadherin was restored. However, there was no significant change in Smad4 expression. In addition, the increased level of Smad2/3 phosphorylation induced by endogenous TGF‐β released from M2 macrophages was also inhibited by specific TGF‐β signaling inhibitors (SB431542 and SIS3), and expression of mir‐362‐3p and related proteins was reversed. In this case, however, Smad4 expression might have been altered due to expression changes of other endogenous cytokines (Figure 6C,D).
Figure 6.
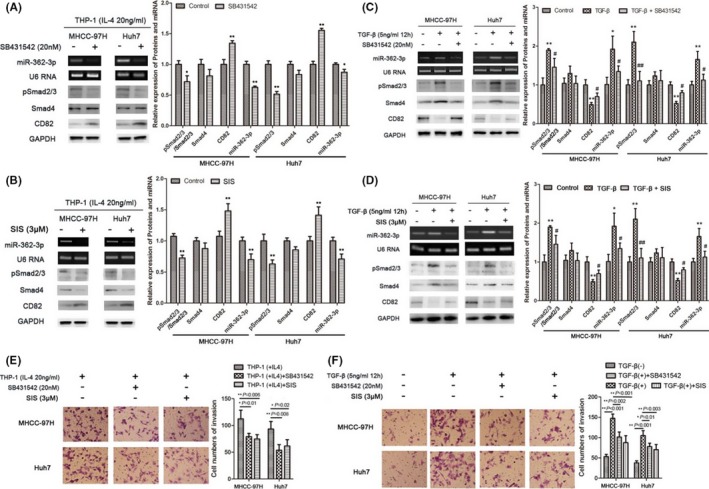
Endogenous and exogenous transforming growth factor (TGF)‐β signals regulate the epithelial‐mesenchymal transition process in tumor cells by regulating microRNA (miR)‐362‐3p and its effector protein expression. A‐D, Hepatocellular carcinoma (HCC) cells in the coculture system were treated with TGFβRI inhibitor (SB431542) and specific inhibitor of Smad3 (SIS3), followed by detection of proteins and miR‐362‐3p expression using western blotting and real‐time PCR, respectively. E,F, Transwell invasion assays were used in HCC cells treated with endogenous or exogenous TGF‐β in the presence or absence of inhibitors. Cells were stained and counted using light microscopy (magnification, ×200). Bars represent mean ± SD. *P < .05; **P < .01
In addition, invasion assays results suggested that both endogenous and exogenous TGF‐β signals enhanced the invasive activity of HCC cells (Figure 6E,F). Combined with the data above, we believe that TGF‐β regulates the EMT process by modulating miR‐362‐3p and its effector protein expression.
3.7. Smad2/3 positively regulates transcription of miR‐362‐3p
To explore the relationship between the TGF‐β/Smads signaling pathway and miR‐362‐3p, we analyzed the promoter region of miR‐362‐3p and screened homologous sequences of SBEs (CAGACA) using bioinformatics analysis. Through sequence analysis, we found that multiple SBE sequences were repeatedly distributed in the promoter region of miR‐362‐3p (Figure 7A).
Figure 7.
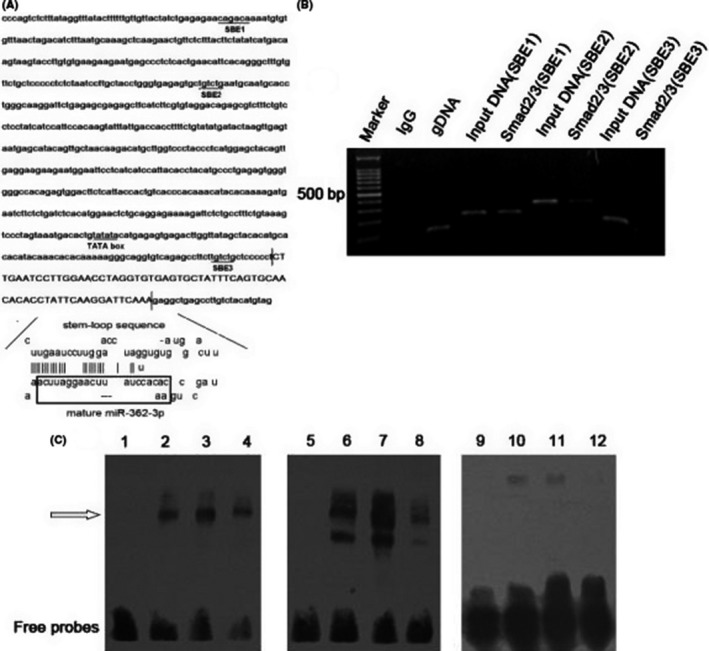
Smad2/3 positively regulates transcription of microRNA (miR)‐362‐3p. A, Schematic diagram of the miR‐362‐3p promoter. B, ChIP‐PCR assays using Smad2/3 Ab validated Smad binding elements (SBEs) in the miR‐362‐3p promoter. Rabbit IgG was used as a negative control. Genomic DNA was used as a positive control. C, EMSA for Smad2/3 with the miR‐362‐3p promoter. EMSA was carried out with biotin‐labeled probes and nuclear extracts obtained from HEK 293 cells. Retarded bands are indicated by the arrow. The probes used were SBE1‐biotin (lanes 1‐4), SBE2‐biotin (lanes 5‐8), and SBE3‐biotin (lanes 9‐12). For testing the contribution of Smad2/3 in nuclear protein‐SBE complexes, Smad2/3 Ab was included in the incubation mixture (lanes 2, 6, and 10). In lanes 4, 8, and 12, a 10‐fold molar excess of the untagged oligonucleotide was added as a cold competitor
Chromatin immunoprecipitation analysis was then carried out in HEK293 cells to determine whether Smad2/3 binds the miR‐362‐3p promoter in cell culture. Chromatin was immunoprecipitated using a Smad2/3 Ab, and PCR amplification was carried out using the DNA fragment of the expected size as a template. The ChIP‐PCR experiments showed that the SBE3 group did not have a specific band (191 bp) consistent with the input DNA, indicating that Smad2/3 did not bind to SBE3 in the transcription region. However, specific bands were amplified in both the SBE1 (277 bp) and SBE2 (374 bp) groups, consistent with their corresponding input DNA, suggesting that Smad2/3 might regulate the expression of mir‐362‐3p by binding SBE1 and SBE2 in the near‐transcriptional region (Figure 7B).
To further explore whether the transactivation of the miR‐362‐3p promoter by Smad2/3 was direct or indirect, we undertook an EMSA using oligonucleotide probes derived from the miR‐362‐3p promoter region. We designed 3 oligonucleotides named SBE1, SBE2, and SBE3. Nuclear extracts were prepared from HEK293 cells. As shown in Figure 7C (lanes 3, 7, and 11), the retarded bands were detected with SBE1/SBE2/SBE3 biotin‐labeled probes. In the case of SBE1‐biotin and SBE2‐biotin, inclusion of Ab against Smad2/3 caused attenuation of the retarded bands, demonstrating the specificity of the reaction (lanes 2 and 6). However, in the case of SBE3‐biotin, Smad2/3 Ab did not attenuate the retarded band (lane 10). Furthermore, the formation of protein‐DNA complexes with SBE1/SBE2/SBE3 biotin‐labeled probes was blocked by competition with a 10‐fold molar excess of the cold untagged SBE1/SBE2/SBE3 oligonucleotides (lanes 4, 8, and 12). These results suggested that Smad2/3 binds directly to the miR‐362‐3p promoter through SBE1 and SBE2, but not SBE3.
4. DISCUSSION
Chronic inflammatory stimuli play a role in the progression of various tumors, including HCC.30, 31, 32 The recruitment and differentiation of macrophages occurs during inflammation, in which immune imbalance can occur during tumorigenesis due to the simultaneous processing of both anti‐ and pro‐tumorigenic signals. In this process, macrophage heterogeneity is depending on inflammatory molecules in the microenvironment.33, 34, 35 In return, differently differentiated macrophages also affect the tumor microenvironment by releasing cytokines.36, 37, 38 The term “TAM” usually refers to macrophages that infiltrate tumors. Among them, M2 macrophages participate in immunoregulation by promoting the Th2‐type immune response and supporting further tumor progression through the release of vascular endothelial growth factor and TGF‐β.39, 40
Recently, miRNA‐transcription factor networks have been found to be involved in macrophage polarization, which participates in the progression of multiple tumors. Most studies focused on miRNAs as upstream signal regulators that control macrophage polarization through target genes. However, little is known about the role of macrophage polarization in miRNAs and downstream signals.
In the present study, we first investigated miR‐362‐3p expression in HCC cells. MicroRNA‐362‐3p is highly expressed in HCC cells and regulates the expression of target gene CD82 and downstream EMT markers. Most studies suggest that M2 macrophages are accumulated in liver and gastric cancers, which is characterized by high production of TGF‐β. We therefore investigated the relationship between miR‐362‐3p expression and TGF‐β. Results indicated that miR‐362‐3p expression was increased in HCC cells by exogenous TGF‐β stimulation. Using a coculture system to stimulate macrophage polarization, we found that M2 differentiation of macrophages could stimulate the expression of miR‐362‐3p in HCC cells and regulate downstream signals in the EMT process.
Some reports have indicated that macrophage infiltration and release of inflammatory factors mediate the regulation of miRNAs during tumorigenesis.7, 41 Our study showed that M2 macrophages regulated Smad2/3 binding to the miR‐362‐3p promoter by releasing TGF‐β, leading to overexpression of miR‐362‐3p.
In conclusion, our study showed that miR‐362‐3p overexpression in HCC cells was associated with M2 differentiation of macrophages partly through autocrine regulation of TGF‐β expression. Based on these data, we speculate that miR‐362‐3p might serve as a core factor to connect the TGF‐β/Smads pathway in TAMs and the tetraspanin network in HCC and GC cells, facilitating the EMT process (Figure 8). This finding provides a rationale for antagonizing macrophage‐directed polarization to inhibit HCC.
Figure 8.
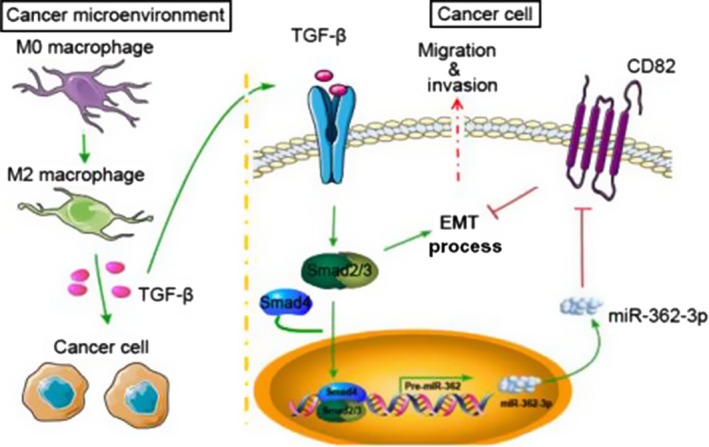
Illustration of how macrophages in the microenvironment might regulate microRNA (miR)‐362‐3p and downstream effector proteins through transforming growth factor (TGF)‐β signaling. miR‐362‐3p could be a “handle” for linking TGF‐β signals in macrophages with Smads or CD82, one of the key proteins of tetraspanin network, in tumor cells. In this model, Smads also regulate the transcription of miR‐362‐3p and influence the epithelial‐mesenchymal transition (EMT) process
CONFLICT OF INTEREST
The authors declare that they have no conflicts of interest in the contents of this article.
ACKNOWLEDGMENTS
This project was supported by the Shanghai Changning District Municipal Science and Technology Commission, China (Grant No. CNKW2017Y05).
Zhang Q, Huang F, Yao Y, et al. Interaction of transforming growth factor‐β‐Smads/microRNA‐362‐3p/CD82 mediated by M2 macrophages promotes the process of epithelial‐mesenchymal transition in hepatocellular carcinoma cells. Cancer Sci. 2019;110:2507–2519. 10.1111/cas.14101
Zhang and Huang contributed equally to this work.
Contributor Information
Shihao Xiang, Email: xiangshihao@sina.com.
Ling Xu, Email: xiaoling05@126.com.
REFERENCES
- 1. Goswami KK, Ghosh T, Ghosh S, et al. Tumor promoting role of anti‐tumor macrophages in tumor microenvironment. Cell Immunol. 2017;316:1‐10. [DOI] [PubMed] [Google Scholar]
- 2. Jinushi M, Komohara Y. Tumor‐associated macrophages as an emerging target against tumors: creating a new path from bench to bedside. Biochim Biophys Acta. 2015;1855(2):123‐130. [DOI] [PubMed] [Google Scholar]
- 3. Italiani P, Boraschi D. From Monocytes to M1/M2 Macrophages: phenotypical vs. Functional Differentiation. Front Immunol. 2014;5:514. [DOI] [PMC free article] [PubMed] [Google Scholar]
- 4. Mantovani A, Sica A. Macrophages, innate immunity and cancer: Balance, tolerance, and diversity. Curr Opin Immunol. 2010;22(2):231‐237. [DOI] [PubMed] [Google Scholar]
- 5. Baysal BE, Sharma S, Hashemikhabir S, et al. RNA editing in pathogenesis of cancer. Cancer Res. 2017;77(14):3733‐3739. [DOI] [PubMed] [Google Scholar]
- 6. Ohtsuka M, Ling H, Doki Y, et al. MicroRNA processing and human cancer. J Clin Med. 2015;4(8):1651‐1667. [DOI] [PMC free article] [PubMed] [Google Scholar]
- 7. Li H, Jiang T, Li MQ, et al. Transcriptional regulation of macrophages polarization by MicroRNAs. Front Immunol. 2018;9:1175. [DOI] [PMC free article] [PubMed] [Google Scholar]
- 8. Yao F, Yu Y, Feng L, et al. Adipogenic miR‐27a in adipose tissue upregulates macrophage activation via inhibiting PPARγ of insulin resistance induced by high‐fat diet‐associated obesity. Exp Cell Res. 2017;355(2):105‐112. [DOI] [PubMed] [Google Scholar]
- 9. Jennewein C, von Knethen A, Schmid T, et al. MicroRNA‐27b contributes to lipopolysaccharide‐mediated peroxisome proliferator‐activated receptor gamma (PPARgamma) mRNA destabilization. J Biol Chem. 2010;285(16):11846‐11853. [DOI] [PMC free article] [PubMed] [Google Scholar]
- 10. Lin L, Lin H, Wang L, et al. miR‐130a regulates macrophage polarization and is associated with non‐small cell lung cancer. Oncol Rep. 2015;34(6):3088‐3096. [DOI] [PubMed] [Google Scholar]
- 11. Zhang M, Zhou Z, Wang J, et al. miR‐130b promotes obesity associated adipose tissue inflammation and insulin resistance in diabetes mice through alleviating M2 macrophage polarization via repression of PPAR‐gamma. Immunol Lett. 2016;180:1‐8. [DOI] [PubMed] [Google Scholar]
- 12. Moore CS, Rao VT, Durafourt BA, et al. miR‐155 as a multiple sclerosis‐relevant regulator of myeloid cell polarization. Ann Neurol. 2013;74(5):709‐720. [DOI] [PubMed] [Google Scholar]
- 13. Kutty RK, Nagineni CN, Samuel W, et al. Inflammatory cytokines regulate microRNA‐155 expression in human retinal pigment epithelial cells by activating JAK/STAT pathway. Biochem Biophys Res Commun. 2012;402(2):390‐395. [DOI] [PMC free article] [PubMed] [Google Scholar]
- 14. Zhao JL, Huang F, He F, et al. Forced activation of notch in macrophages represses tumor growth by upregulating miR‐125a and disabling tumor‐associated macrophages. Cancer Res. 2016;76(6):1403‐1415. [DOI] [PubMed] [Google Scholar]
- 15. Chaudhuri AA, So AY, Sinha N, et al. MicroRNA‐125b potentiates macrophage activation. J Immunol. 2011;187(10):5062‐5068. [DOI] [PMC free article] [PubMed] [Google Scholar]
- 16. Ponomarev ED, Veremeyko T, Barteneva N, et al. MicroRNA‐124 promotes microglia quiescence and suppresses EAE by deactivating macrophages via the C/EBP‐α‐PU.1 pathway. Nat Med. 2011;17(1):64‐70. [DOI] [PMC free article] [PubMed] [Google Scholar]
- 17. Gloushankova NA, Rubtsova SN, Zhitnyak IY. Cadherin‐mediated cell‐cell interactions in normal and cancer cells. Tissue Barriers. 2017;5(3):e1356900. [DOI] [PMC free article] [PubMed] [Google Scholar]
- 18. Huang H, Wright S, Zhang J, et al. Getting a grip on adhesion: cadherin swithching and collagen signaling. Biochim Biophys Acta Mol Cell Res. 2019;2019: 10.1016/j.bbamcr.2019.04.002. [DOI] [PubMed] [Google Scholar]
- 19. Zeisberg M, Neilson EG. Biomarkers for epithelial‐mesenchymal transitions. J Clin Invest. 2009;119(6):1429‐1437. [DOI] [PMC free article] [PubMed] [Google Scholar]
- 20. Grigore AD, Jolly MK, Jia D, et al. Tumor Budding: the name is EMT. Partial EMT. J Clin Med 2016;5(5):pii: E51. [DOI] [PMC free article] [PubMed] [Google Scholar]
- 21. Saitoh M. Involvement of partial EMT in cancer progression. J Biochem. 2018;164(4):257‐264. [DOI] [PubMed] [Google Scholar]
- 22. Dai W, Wang C, Wang F, et al. Anti‐miR‐197 inhibits migration in HCC cells by targeting KAI 1/CD82. Biochem Biophys Res Commun. 2014;446(2):541‐548. [DOI] [PubMed] [Google Scholar]
- 23. Zhang QH, Yao YL, Wu XY, et al. Anti‐miR‐362‐3p inhibits migration and invasion of human gastric cancer cells by its target CD82. Dig Dis Sci. 2015;60(70):1967‐1976. [DOI] [PubMed] [Google Scholar]
- 24. Xu L, Wang T, Meng WY, et al. Salinomycin inhibits hepatocellular carcinoma cell invasion and migration through JNK/JunD pathway‐mediated MMP9 expression. Oncol Rep. 2015;33(3):1057‐1063. [DOI] [PMC free article] [PubMed] [Google Scholar]
- 25. Wang YG, Xu L, Jia RR, et al. DDR2 Induces Gastric Cancer Cell Activities via Activating mTORC2 Signaling and Is Associated with Clinicopathological Characteristics of Gastric Cancer. Dig Dis Sci. 2016;61(8):2272‐2283. [DOI] [PubMed] [Google Scholar]
- 26. Xu L, Dai W, Li J, et al. Methylation‐regulated miR‐124‐1 suppresses tumorigenesis in hepatocellular carcinoma by targeting CASC3. Oncotarget. 2016;7(18):26027‐26041. [DOI] [PMC free article] [PubMed] [Google Scholar]
- 27. Livak KJ, Schmittgen TD. Analysis of relative gene expression data using real‐time quantitative PCR and the 2(‐Delta Delta C(T)) method. Methods. 2001;25(4):402‐408. [DOI] [PubMed] [Google Scholar]
- 28. Shen H, Li W, Tian Y, et al. Upregulation of miR‐362‐3p Modulates Proliferation and Anchorage‐Independent Growth by Directly Targeting Tob2 in Hepatocellular Carcinoma. J Cell Biochem. 2015;116(8):1563‐1573. [DOI] [PubMed] [Google Scholar]
- 29. Jinnin M, Ihn H, Tamaki K. Characterization of SIS3, a novel specific inhibitor of Smad3, and its effect on transforming growth factor‐beta1‐induced extracellular matrix expression. Mol Phrmacol. 2006;69(2):597‐607. [DOI] [PubMed] [Google Scholar]
- 30. Marellli G, Sica A, Vannucci L, et al. Inflammation as target in cancer therapy. Curr Opin Pharmacol. 2017;35:57‐65. [DOI] [PubMed] [Google Scholar]
- 31. Li W, Xiao J, Zhou X, et al. STK4 regulates TLR pathways and protects against chronic inflammation‐related hepatocellular carcinoma. J Clin Invest. 2015;125(11):4239‐4254. [DOI] [PMC free article] [PubMed] [Google Scholar]
- 32. Wang F, Meng W, Wang B, et al. Helicobacter pylori‐induced gastric inflammation and gastric cancer. Cancer Lett. 2014;345(2):196‐202. [DOI] [PubMed] [Google Scholar]
- 33. Bingle L, Brown NJ, Lewis CE. The role of tumour‐associated macrophages in tumour progression: implications for new anticancer therapies. J Pathol. 2002;196(3):254‐265. [DOI] [PubMed] [Google Scholar]
- 34. Lewis CE, Pollard JW. Distinct role of macrophages in different tumor microenvironments. Cancer Res. 2006;66(2):605‐612. [DOI] [PubMed] [Google Scholar]
- 35. Guo Q, Jin Z, Yuan Y, et al. New mechanisms of tumor‐associated macrophages on promoting tumor progression: recent research advances and potential targets for tumor immunotherapy. J Immunol Res. 2016;2016:9720912. [DOI] [PMC free article] [PubMed] [Google Scholar]
- 36. Zhou D, Huang C, Lin Z, et al. Macrophage polarization and function with emphasis on the evolving roles of coordinated regulation of cellular signaling pathways. Cell Signal. 2014;26(2):192‐197. [DOI] [PubMed] [Google Scholar]
- 37. Bras JP, Silva AM, Calin GA, et al. miR‐195 inhibits macrophages pro‐inflammatory profile and impacts the crosstalk with smooth muscle cells. PLoS One. 2017;12(11):e0188530. [DOI] [PMC free article] [PubMed] [Google Scholar]
- 38. Zhao G, Miao H, Li X, et al. TGF‐β3‐induced miR‐494 inhibits macrophage polarization via suppressing PGE2 secretion in mesenchymal stem cells. FEBS Lett. 2016;590(11):1602‐1613. [DOI] [PubMed] [Google Scholar]
- 39. Krausgruber T, Blazek K, Smallie T, et al. IRF5 promotes inflammatory macrophage polarization and TH1‐TH17 responses. Nat Immunol. 2011;12(13):231‐238. [DOI] [PubMed] [Google Scholar]
- 40. Naldini A, Pucci A, Bernini C, et al. Regulation of angiogenesis by Th1‐ and Th2‐type cytokines. Curr Pharm Des. 2003;9:511‐519. [DOI] [PubMed] [Google Scholar]
- 41. Ostuni R, Kratochvill F, Murray PJ, et al. Macrophages and cancer: from mechanisms to therapeutic implications. Trends Immunol. 2015;36(4):229‐239. [DOI] [PubMed] [Google Scholar]