Abstract
Macrophages are essential inflammatory cells which regulate the features of immune reactions within tumors. Many studies have reported their regulatory roles in immunity through cytokines and cell signaling. However, relatively few studies have focused on their metabolic features and mechanisms. We aimed to determine the signaling pathway regulating cell metabolism and the mechanism related to the regulation of human tumor‐associated macrophages (TAMs) in gastric cancer (GC). Tumor‐infiltrated macrophages were isolated from human GC tissues using magnetic beads, gene transcription was determined by real‐time PCR, protein expression was monitored using western blots, metabolites were determined using HPLC, and transcriptional regulation was analyzed by the luciferase‐based reporter gene system. A significant decrease in microRNA (miR)‐30c and an increase in regulated in development and DNA damage responses 1 (REDD1) were detected in human GC TAMs, the transcription of miR‐30c was negatively correlated with REDD1. MicroRNA‐30c expression was suppressed by hypoxia‐inducible factor‐1α activation and related to decreased mTOR activity as well as glycolysis in human GC TAMs. Hypoxia‐regulated miR‐30c downregulated REDD‐1 expression by targeting its 3′UTR. Overexpression of miR‐30c or restored mTOR activity in macrophages with miR‐30cLow expression promoted M1 macrophage differentiation and function in TAMs. Therefore, hypoxia in the human GC microenvironment suppressed the expression of miR‐30c, and decreased mTOR activity as well as glycolysis in GC TAMs, thus inhibiting M1 differentiation and function. These results provide a novel metabolic strategy for tumor microenvironment‐based therapy.
Keywords: gastric cancer, macrophage, miR‐30c, mTOR, REDD‐1
1. INTRODUCTION
Macrophages are white blood cells that engulf exogenous and autogenous antigens and present to T cells to activate the immune system. Macrophages are present in almost all organs, some of which are tissue‐resident (eg, histiocytes, Kupffer cells, alveolar macrophages, and microglia) and some are transformed monocytes derived from peripheral blood. All these cells belong to the mononuclear phagocyte system.1, 2, 3 Monocytes/macrophages can differentiate into M1 or M2 macrophages following different stimulations. Tumor‐associated macrophages (TAMs) are similar to M2‐polarized macrophages which can be stimulated by Th2 cytokines (interleukin [IL]‐4, IL‐10, and IL‐13). Moreover, M1 and M2 (TAMs) cells can transform each other with appropriate stimuli, including cytokines and metabolites.2, 3
Macrophages are the best‐characterized tumor‐infiltrating immune cells, and it is not surprising that they play a prominent active role in processes ranging from early carcinogenesis to tumor progression, including metastasis.2 Currently, the majority of evidence supports the tumor‐promoting role of a specific subpopulation of macrophages. Furthermore, macrophages can constitute up to 50% of the tumor mass, forming a major component of the immune cell infiltrate in the tumor microenvironment (TME).1, 4, 5 The antitumor to protumor roles of infiltrating macrophages are hot topics in oncoimmunology. To date, the common view on the potential reasons related to the transformation of TAMs is mainly based on tumor‐specific factors and their downstream signaling, such as cytokines and chemokines. The metabolism‐related mechanism has rarely been addressed.1
Mammalian target of rapamycin signaling is the central mediator in cell metabolism, growth, proliferation, and survival. The activation of mTOR signaling is related to many cellular processes, such as insulin resistance, tumor development, and immune cell activation.6 Thus, the extracellular regulation of mTOR activity is one of the connections linking TME and intratumor immune cells.6 Recently, Wenes et al. reported that highly glycolytic development and DNA damage responses 1 (REDD1)‐deficient TAMs outcompete endothelial cells for glucose usage that prevents vascular hyperactivation and promotes the formation of quiescent vascular junctions. Reducing glycolysis in REDD1 knockout TAMs reestablishes abnormal angiogenesis and metastases.7, 8 The study by Wenes et al indicated that REDD1 activity through mTOR is a double‐edged sword in cancer therapy. On the one hand, mTOR activation promoted antitumor properties in hypoxic TAMs, and on the other hand, it had the opposite effect in cancer cells. These results implied that TAMs and their relation with the REDD1‐mTOR pathway in cancer is a complicated issue.7
Hypoxia is an essential feature in the neoplastic microenvironment. The fast growth of tumors can cause widespread low oxygenation, thus inducing increased invasion and resistance to chemotherapy. Genes (including noncoding RNAs) and signaling pathways related to the hypoxic microenvironment were extensively studied during the last decade.9, 10 Bandara et al11 reported that in breast cancer lines, significant reductions in Dicer mRNA and protein levels were observed in cells exposed to hypoxia, which was partly mediated by feedback effects through microRNAs. Another study obtained similar results to ours, which showed that microRNA (miR)‐30c was significantly downregulated in human renal cell carcinoma tissues and cell lines. Mathew et al12 found that miR‐30c downregulation could be induced by hypoxia in renal cell carcinoma cells in a hypoxia‐inducible factor (HIF)‐dependent manner. There were studies concerning the roles of miR‐30c in human gastric cancer (GC), regarding miR‐30c as a potential biomarker for human GC diagnosis. However, very few studies have been reported concerning its role in GC TAMs.
Our preliminary data also indicated that the expression of miR‐30c was related to hypoxia in human GC, and it was a potential regulator of REDD1. Moreover, we found that REDD1, an mTOR negative regulator, was significantly decreased in GC‐infiltrated macrophages, and its expression was associated with a decreased percentage of M1 macrophages in human GC. Therefore, to determine the reason for decreased miR‐30c, mTOR activity, as well as the percentage of M1 in GC infiltrated macrophages, we undertook the studies outlined below.
2. MATERIALS AND METHODS
2.1. Patients
This hospital‐based case‐control study included 76 GC patients and 42 cancer‐free controls. All subjects were recruited from the People's Hospital of Wujin (Changzhou, China) between January 2016 and January 2018. All patients underwent surgery for primary GC, and subjects with hematological disorders and a previous history of cancer or chemotherapy were excluded. The cancer‐free controls who were from the same geographic area showed no evidence of a genetic relationship to the GC patients. This study was approved by the Ethics Review Board of the People's Hospital of Wujin, and all patients provided a written informed consent. The clinical features of all cases and controls are presented in Table 1.
Table 1.
Clinical characteristic of gastric cancer patients and cancer‐free controls
| Features | Cases (n = 76) | Controls (n = 42) | P value | ||
|---|---|---|---|---|---|
| N | % | N | % | ||
| Age (years) | |||||
| ≤50 | 36 | 47.37 | 24 | 57.14 | .805 |
| >50 | 40 | 52.63 | 18 | 42.86 | |
| Gender | |||||
| Male | 38 | 50.00 | 19 | 45.24 | .248 |
| Female | 38 | 50.00 | 23 | 54.76 | |
| Helicobacter pylori infection | |||||
| Positive | 59 | 77.63 | 7 | 16.67 | <.0001 |
| Negative | 17 | 22.37 | 35 | 83.33 | |
| Differentiation | |||||
| G1 | 18 | 23.68 | |||
| G2 | 22 | 28.95 | |||
| G3 | 24 | 31.58 | |||
| G4 | 12 | 15.79 | |||
| TNM stage | |||||
| I | 12 | 15.79 | |||
| II | 22 | 28.95 | |||
| III | 24 | 31.58 | |||
| IV | 18 | 23.68 | |||
| Tumor size (cm) | |||||
| ≤5 | 37 | 48.68 | |||
| >5 | 39 | 51.32 | |||
| Metastasis | |||||
| Yes | 42 | 55.26 | |||
| No | 34 | 44.74 | |||
2.2. Cell lines and reagents
Human monocyte cell lines including THP‐1 were purchased from ATCC. All cells were cultured in DMEM purchased from Gibco supplemented with 10% FBS (Invitrogen) and maintained in a humidified atmosphere containing 5% CO2 at 37°C. For macrophage stimulation, THP‐1 cells were treated with 100 ng/mL PMA (Sigma‐Aldrich) for 2 days. The mTOR activator (MHY1485) was purchased from Millipore (500554). The HIF‐1α inhibitor (cryptotanshinone, CPT) was purchased from Sigma‐Aldrich (79852).
2.3. Real‐time PCR
Total RNA in GC‐infiltrated macrophages was isolated using TRIzol reagent. The expression of miR‐30C was detected using the TaqMan Advanced miRNA assay (A25576). The primers for genes used in the study were as follows: forward primer, TGAGGATGAACACTTGTGTGC; reverse primer, CCAACTGGCTAGGCATCAGC; amplicon size 110 bp for REDD1, and forward primer, TGTGGGCATCAATGGATTTGG; reverse primer, ACACCATGTATTCCGGGTCAAT, amplicon size 110 bp for GAPDH.
2.4. Isolation of human GC‐infiltrated macrophages and polarization stimulation
Fresh tissue‐infiltrating macrophages were obtained according to the following procedure.13 Briefly, cancer and peritumor tissues were cut into small pieces and digested in 100 U/mL collagenase type IV and 100 μg/mL DNase in RPMI + 10% FBS in RPMI‐1640 medium. Dissociated cells were filtered through a 75‐μm cell strainer, separated by Ficoll centrifugation, and the mononuclear cells were washed and resuspended in RPMI‐1640 supplemented with 10% FBS (Gibco). Macrophages were purified with anti‐CD14 magnetic Dynabeads (11367D; Thermo Fisher Scientific) according to the manufacturer's instructions. For M1 macrophage polarization stimulation, the macrophages were treated with 100 ng/mL lipopolysaccharide (LPS) for 7 days according to previous publications.
2.5. Flow cytometry detection
Untreated and polarization stimulated macrophages were stimulated with LPS for 4 hours before flow cytometry. Cells were stained with surface markers, fixed and permeabilized with IntraPre reagent (Beckman Coulter), and then stained with intracellular markers. The cells were detected by flow cytometry using BD Pharmingen FITC Mouse Anti‐Human CD68 (562117) and BD Phosflow PE Mouse anti‐human NOS (560103). Data were acquired on a FACSVantage SE and analyzed with CellQuest software.
2.6. Western blot analysis
For western blotting, proteins were extracted from cultured cells using RIPA buffer containing PMSF (Beyotime). Equal amounts of protein (100 μg) were separated by 7.5%/12.5% SDS‐PAGE and transferred to a PVDF membrane. Primary polyclonal Abs targeting HIF1a (ab92498), REDD1 (ab63059), mTOR Ser2481 (ab137133), mTOR Ser2448 (ab2486), mTOR (ab142349), and GLUT1 (ab652) were purchased from Abcam. The secondary Abs used were anti‐rabbit HRP‐linked (Abcam). The blots were developed using ECL reagent (Millipore). An equal amount of protein loading in each lane was confirmed using the β‐actin Ab. ImageJ software (National Health Institute US) was used to quantify the integrated density of the band.
2.7. Luciferase reporter assay and transfection of miR‐30c
The 3′UTR region of REDD1 containing the WT or mutant potential target site for miR‐30c was synthesized by Genescript and inserted into the pGL4.10[luc2] vector (Promega). For the luciferase assay, stimulated THP‐1 cells were cotransfected with pGL4‐REDD1‐WT 3′UTR or pGL4‐REDD1‐MU 3′UTR, and miR‐30c mimics or control (GenePharma) using Lipofectamine 2000 (Thermo Fisher Scientific). Cells were harvested 48 hours after transfection and analyzed using the Dual‐Luciferase Reporter Assay System (Promega) according to the manufacturer's protocol.
2.8. Sample preparation and metabolomics determination
Ice‐cold 50% methanol (5 mL) and 1 mL acetonitrile/methanol/water (4:4:2, V/V) were added to resuspend and extract the macrophages, respectively. The cells were then broken by ultrasonication for 10 minutes (300 W). The supernatant was obtained by centrifugation at 680 g for 15 minutes. Metabolite extraction was subsequently carried out to isolate metabolites from the freeze‐dried supernatant. Methanol (100 μL) was added to redissolve the samples, which were vortexed for 30 seconds, followed by centrifugation (6118 g, 15 minutes) at 4°C; the supernatant was used for metabolomics determination.
Metabolic profiling was carried out on a UPLC Ultimate 3000 system (Dionex), coupled to an Orbitrap mass spectrometer (Thermo Fisher Scientific) in both positive and negative mode simultaneously. The chromatographic separation was undertaken on a 1.9 μm Hypersil Gold C18 column (100 × 2.1 mm) (Thermo Fisher Scientific), and the column was maintained at 40°C. The multistep gradient had a mobile phase A of 0.1% formic acid in ultrapure water and mobile phase B consisted of acetonitrile acidified with 0.1% formic acid. The gradient was operated at a flow rate of 0.4 mL/min over a run time of 15 minutes. The UPLC autosampler temperature was set at 4°C, and the injection volume for each sample was 10 μL. For both positive and negative mode, the operating parameters were as follows: a spray voltage of 3.5 kV for positive, 2.5 kV for negative, capillary temperature of 300°C, sheath gas flow of 50 arbitrary units, and auxiliary gas flow of 13 arbitrary units.
2.9. Statistical analysis
Data are presented as mean ± SD. The χ2 test and Student's t test ANOVA were used to evaluate statistical differences in demographic and clinical characteristics. All expression experiments carried out in vitro were repeated at least 3 times with triplicate samples. Pearson's correlation analysis was used to analyze the relationship between associated factors. Statistical analysis was undertaken using Stata 9.2 (StataCorp) and presented with GraphPad Prism software (GraphPad). In all cases, P < .05 was considered significant.
3. RESULTS
3.1. Hypoxia‐regulated miR‐30c expression was associated with REDD1/mTOR signaling in tumor‐infiltrating macrophages in human GC
To investigate the potential effects of miR‐30c on REDD1 expression within TAMs, gene transcription was assessed. Both miR‐30c and REDD1 were significantly different between GC TAMs and normal control monocytes. Downregulated miR‐30c and increased REDD1 were detected in GC TAMs (Figure 1A,B). Interestingly, we also found that the expression of miR‐30c was negatively correlated with the expression of REDD1 in GC TAMs (Figure 1C), which might indicate that miR‐30c can downregulate REDD1 within GC TAMs.
Figure 1.
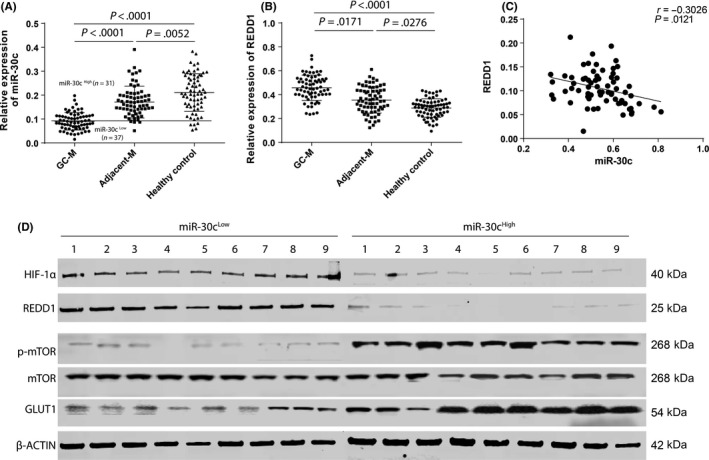
Hypoxia‐regulated microRNA (miR)‐31c expression was associated with regulated in development and DNA damage responses 1 (REDD1)/mTOR in tumor‐infiltrating macrophages in human gastric cancer (GC). A,B, The transcription of miR‐30c (A) and REDD1 (B) was determined by using real‐time PCR within macrophages extracted from GC (GC‐M), paired adjacent tissues (Adjacent‐M) (n = 68 for each group), and peripheral monocytes of healthy controls. C, Linear correlation between the expression of miR‐30c and REDD1 was analyzed. D, Protein was extracted from tumor‐infiltrating macrophages from miR‐30cLow and miR‐30cHigh groups (n = 9, each group). Expression of hypoxia‐inducible factor (HIF)‐1α, REDD1, p‐mTOR (s2448), mTOR, glucose transporter 1 (GLUT1), and β‐actin were detected by using western blot. Data are presented as mean ± SD. Student's t test
In addition, the protein and REDD1/mTOR‐related signaling activation were investigated using western blotting. First, GC patients were divided into 2 groups: miR‐30cHigh and miR‐30cLow according to the lower 95% confidence interval of miR‐30c expression in normal controls (Figure 1A). The results were similar to the real‐time PCR results in that the REDD1 protein in the miR‐30cHigh group was lower than that in the miR‐30cLow group. Activation of mTOR, downstream of REDD1, was also analyzed using mTOR Ab at the phosphate residue (2448), and TAMs mTOR activity in the miR‐30cHigh group was higher than that in the miR‐30cLow group. As mTOR activity is related to glycolysis level in most cells,14 one of the hallmark proteins, glucose transporter 1 (GLUT1), was investigated.15 It was found that the miR‐30cHigh group had higher expression of GLUT1, which could indicate that the TAMs in the miR‐30cHigh group had a stronger glycolysis level than those in the miR‐30cLow group. We also investigated HIF‐1α expression within TAMs and found that the miR‐30cHigh group had lower expression of HIF‐1α compared with the miR‐30cHigh group, which might indicate that HIF‐1α might suppress the transcription of miR‐30c in TAMs.
3.2. High expression of miR‐30c is related to increased glycolysis in TAMs
As mTOR is an essential gene related to cell metabolism, cell lysis was utilized in the metabolomics analysis. Thirteen metabolites related to glycolysis in 10 samples each from the miR‐30c High and Low groups were analyzed using HPLC. The results indicated that miR‐30cHigh macrophages showed significantly enhanced glycolysis compared with the miR‐30cLow macrophages (Figure 2A). These results could be due to increased activation of mTOR, based on the previous results. We then confirmed that 3 metabolites (fructose 6 phosphate, pyruvate, and lactate) were abundant in the samples (n = 40 for each group) from the miR‐30c High and Low groups, and these results confirmed those from metabolomics screening (Figure 2B‐D). In addition, the transcription of 2 essential enzymes (pyruvate kinase M2 [PKM2] and phosphofructokinase [PFK]) involved in glycolysis were determined using real‐time PCR, and the results revealed that the miR‐30cHigh group also had higher expression of PKM2 and PFK in miR‐30cHigh TAMs compared with miR‐30cLow TAMs.
Figure 2.
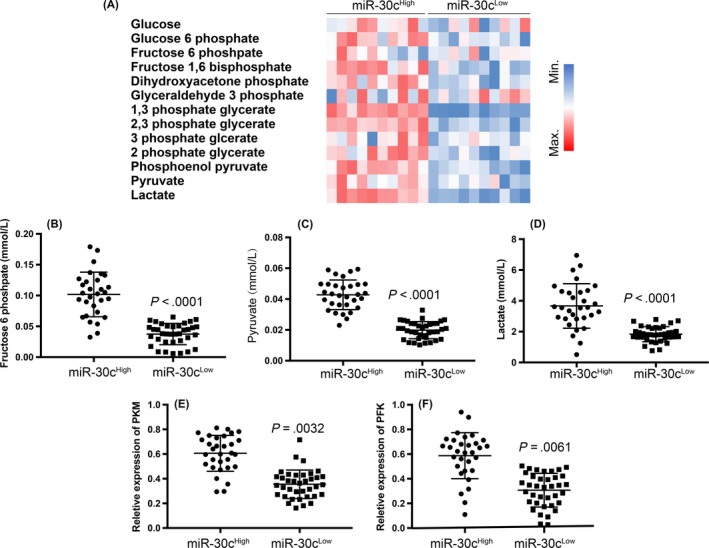
High expression of microRNA (miR)‐30c is related to increased glycolysis in tumor‐associated macrophages (TAMs). A, Hierarchical clustering analysis of glycolysis‐related metabolites that differentially existed between miR‐30cLow and miR‐30cHigh gastric cancer (GC) TAMs (n = 10, each group). B‐D, Determination and comparison of fructose 6 phosphate (B), pyruvate (C), and lactate (D) concentration between miR‐30cLow and miR‐30cHigh groups in GC TAMs. E,F, Transcription of PKM (E) and PFK (F) genes were determined by real‐time PCR in miR‐30cLow and miR‐30cHigh groups in GC TAMs. All experiments were undertaken in triplicate. Data are presented as mean ± SD. Student's t test
3.3. High expression of miR‐30c is related to an increased percentage of M1 cells within TAMs
In addition to determining the metabolism of TAMs, we also detected the percentage of M1 cells in tumor‐infiltrated macrophages. We used CD68 and inducible nitric oxide synthase (iNOS) double‐positive cells to define M1 cells and found that the miR‐30cHigh group had more M1 cells than the miR‐30cLow group (P = .0001) (Figure 3A). Similar results were also obtained using immunofluorescence staining, which showed that the percentage of iNOS in CD68 double‐positive cells was significantly higher in the miR‐30cHigh group compared with the miR‐30cLow group (Figure 3B). These results could indicate that miR‐30c is associated with the differentiation of M1 cells, and related to their metabolism.
Figure 3.
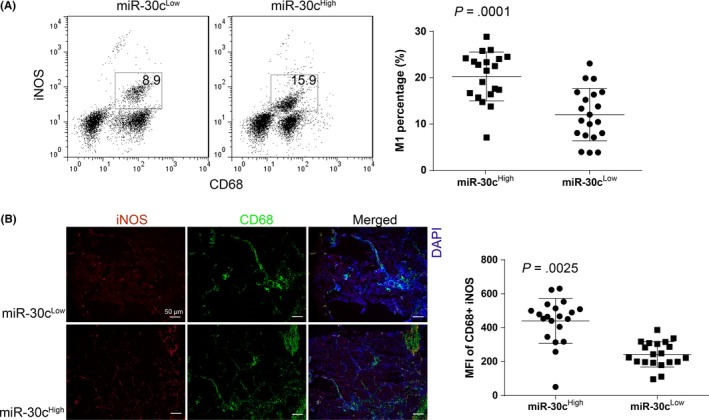
High expression of microRNA (miR)‐30c is related to the increased percentage of M1 cells within tumor‐associated macrophages (TAMs). A, Percentage of M1 cells (defined as CD68+ and inducible nitric oxide synthase [iNOS]+) with gastric cancer (GC) TAMs were determined by using flow cytometry. The comparison was undertaken between miR‐30cLow and miR‐30cHigh GC TAMs. B, Percentage of M1 cells with GC TAMs was determined by using immunofluorescence staining (×100), the integrated optical density value of each figure was obtained by using Image J analyzing 5 random visions. All experiments were undertaken in triplicate. Data are presented as mean ± SD. Student's t test. MFI, mean fluorescence intensity
3.4. Hypoxia decreases transcription of miR‐30c in macrophages due to HIF‐1α activation
As miR‐30High macrophages showed low expression of HIF‐1α, and previous publications have indicated that hypoxia can downregulate miR‐30c expression through HIF‐1α activation,16, 17, 18 we postulated that HIF‐1α could downregulate miR‐30c expression in a hypoxic environment. We first compared the expression of miR‐30c during hypoxia (1%) and normal O2 concentration (21%), and the results indicated that miR‐30c transcription was significantly decreased by hypoxia in THP‐1 cells. However, we found that miR‐30c could be restored by CPT which is a HIF‐1α inhibitor (Figure 4A). We used western blotting to confirm the activation of HIF‐1α both in hypoxia and hypoxia plus CPT treatment (Figure 4B). The results indicated that miR‐30c was downregulated due to HIF‐1α activation in macrophages.
Figure 4.
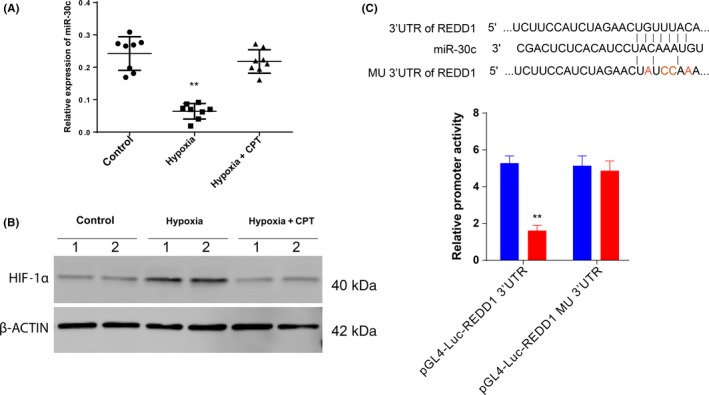
Hypoxia decreases transcription of microRNA (miR)‐30c in macrophages due to hypoxia‐inducible factor (HIF)‐1α activation. A,B, THP‐1 cells were treated as indicated. miR‐30c transcription was monitored by using real‐time PCR (A), and the expression of HIF1‐α was detected by using western blot analysis (B). C, Luciferase reporter assay using both WT and mutated (MU) 3′UTR. CPT, cryptotanshinone. Data are presented as mean ± SD. **P < .01, Student's t test
3.5. MicroRNA‐30c promotes M1 differentiation and function by targeting REDD1
Based on the above investigation, we proposed that miR‐30c can promote M1 cell differentiation and function through downregulation of REDD1. We first evaluated the possible binding of miR‐30c to the 3′UTR region of REDD1 using TargetScan (http://www.targetscan.org/vert_71/), and the results indicated that miR‐30c had a potentially complementary 8 mer to the 3′UTR of REDD1 (Figure 4C). We mutated the binding site in the 3′UTR of REDD1 and the promoter activity of REDD1 significantly decreased with the transfection of miR‐30c, but was restored by the binding site mutation (Figure 4C). These results confirmed our hypothesis that REDD‐1 was one of the potential targets of miR‐30c.
We then overexpressed miR‐30c in THP‐1 cells, and M1 cell polarization stimulation was carried out in THP‐1‐derived macrophages using LPS. The percentage of M1 (CD14+ iNOS+) cells significantly increased in THP‐1‐miR‐30c cells. However, the percentage of M1 significantly decreased when THP‐1 cells were treated with miR‐30c inhibitor. This increase induced by miR‐30c overexpression was attenuated in cells with REDD1 overexpression (THP‐1‐miR‐30c‐REDD1) and was further increased by the mTOR‐specific activator, MHY1485 (Figure 5A). We further determined M1 cytokine transcription in polarized cells under different treatments. It was found that the transcription of IL‐12, IL‐1β and IL‐6 increased in cells with miR‐30c overexpression and decreased in miR‐30c inhibitor‐treated cells. The increased M1 cytokines induced by miR‐30c overexpression were attenuated by overexpression of REDD1 and were boosted by MHY1485 (Figure 5B). We also investigated the activation of mTOR, and the activation of mTOR (Ser2448) was markedly increased in THP‐1‐miR‐30c cells and decreased in THP‐1 cells treated with miR‐30c inhibitor. The decrease in mTOR activity was restored by MHY1485 (Figure 5C). However, there was no apparent influence on the activity of mTORC2 (Ser2481) by the miR‐30c/REDD1 axis (Figure 5C).
Figure 5.
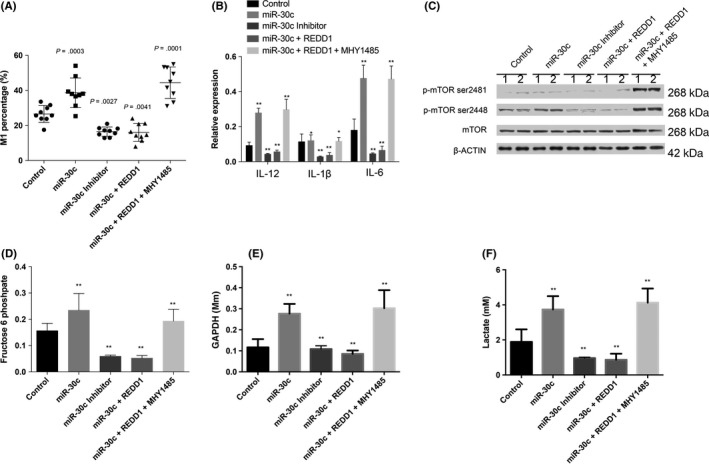
MicroRNA (miR)‐30c promotes M1 differentiation, function, and metabolism by targeting regulated in development and DNA damage responses 1 (REDD1). A, Percentage of THP‐1‐derived M1 cells (defined as CD68+ and inducible nitric oxide synthase [iNOS]+) determined by using flow cytometry. Comparisons were made between different indicated groups. B, Transcription of interleukin (IL)‐12, IL‐1b, and IL‐6 produced in THP‐1 cells with different treatments was determined by real‐time PCR. C, Protein was extracted for THP‐1 cells treated differently. Activation of mTOR (Ser2448 and Ser2481) was detected by western blot analysis. D‐F, Glycolysis‐related metabolites in THP‐1 cells treated as indicated were analyzed by HPLC, and the concentrations are presented. Data are shown as mean ± SD. *P < .05, **P < .01, Student's t test
3.6. MicroRNA‐30c can modify macrophage metabolism through mTOR activation
We also investigated cell glycolysis and found that glycolysis‐related metabolites increased in response to the overexpression of miR‐30c in THP‐1‐derived macrophages, these metabolites decreased due to overexpression of REDD1 and the inhibitor of miR‐30c, and were boosted by the mTOR activator, MHY1485 (Figure 5D‐F).
4. DISCUSSION
Tumor hypoxia is defined as relative oxygen deprivation due to fast tumor growth overloading blood supply, and the oxygen concentration is significantly lower than that in healthy tissues. To maintain continuous tumor growth during hypoxia, cancer cells have been found to alter their metabolism. Furthermore, hypoxia is known to change cell behavior and is associated with ECM remodeling and increased migratory and metastatic behavior.19, 20 Hypoxia is reported to alter many cellular characteristics, including the transcriptome, proteomics, metabolomics, DNA repair, and apoptosis. MicroRNAs are regulated by hypoxia in many tissues.21, 22, 23, 24 In the present study, our results indicated that miR‐30c was also regulated by hypoxia‐related HIF‐1α activation.
MicroRNA‐30c is a well‐studied miRNA, and it is relevant in the tumorigenesis and development of many cancers, such as breast cancer, ovarian cancer, lung cancer, clear cell renal cell carcinoma, and gastric cancer. It also has potential diagnostic and prognostic implications, and represents a potential therapeutic target in cancers.25, 26 However, some studies have found that miR‐30c is not related to the prognosis of GC patients.27 Other studies have reported similar results to those in our study, where pre‐miR‐30c transfection suppressed REDD1 expression in human osteoblast hFOB cells and resulted in cell death. Our data suggested that miR‐30c can respond to hypoxia and results in increased REDD1 expression. We also confirmed that miR‐30c could regulate REDD1 expression by targeting its 3′UTR.28
Regulated in development and DNA damage responses 1 is a sensor protein in the stress response. It was first identified as a gene induced by hypoxia and DNA damage.29, 30 It was also reported to respond to other environmental stresses, such as energy stress, glucocorticoid treatment, and reactive oxygen.31, 32 Many studies have also indicated that REDD1 is involved in the regulation of mTORC1 signaling and is regarded as a crucial target of the ubiquitin‐proteasome system.33, 34 We found that REDD1 was increased in human GC‐infiltrated macrophages, which induced a decrease in mTOR activity and a related decrease in the percentage of M1 macrophages. Furthermore, restoration of mTOR activity by its activator can increase the percentage of differentiated M1 cells.
A recent study reported that REDD1/mTOR signaling was involved in the function and differentiation of TAMs and their potential in metabolic regulation. Mechanistically, high mTOR activity‐related highly glycolytic REDD1‐deficient TAMs can prevent endothelial cell vascular hyperactivation and promote the formation of quiescent vascular junctions by increasing their glucose usage. Reducing motor‐related glycolysis in REDD1 knockout TAMs reestablishes abnormal angiogenesis and metastases.7, 8 Our study provided not only experimental evidence supporting the results obtained from the studies above, but also an explanation for increased REDD1 within GC TAMs.
In this study, we identified a novel metabolism‐related signaling pathway, HIF‐1α‐miR‐30c‐REDD1/mTOR, in human GC TAMs. This signaling was associated with a decreased percentage of M1 cells and potentially induced an immune‐suppressive TME (Figure 6). Cell‐specific therapy could be effective in the turn‐over of the TME from the cell signaling‐metabolism perspective.
Figure 6.
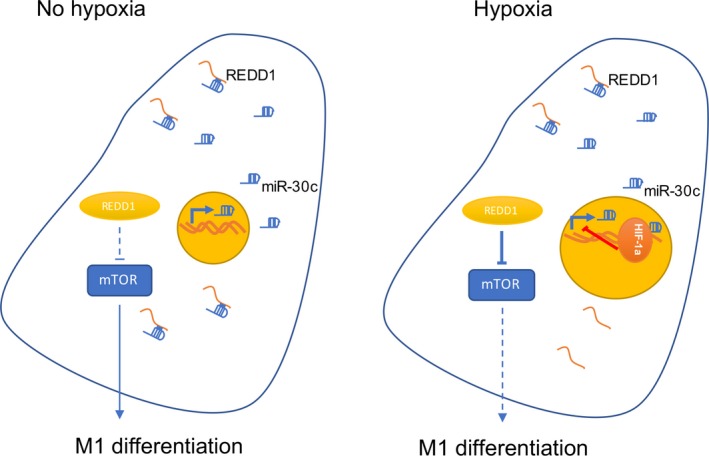
Illustration showing the hypoxia‐inducible factor (HIF)‐1α‐microRNA (miR)‐30c‐regulated in development and DNA damage responses 1 (REDD1)/mTOR regulatory axis and its function in tumor‐associated macrophages
DISCLOSURE
The authors declare no conflict of interest.
Zhihua Y, Yulin T, Yibo W, et al. Hypoxia decreases macrophage glycolysis and M1 percentage by targeting microRNA‐30c and mTOR in human gastric cancer. Cancer Sci. 2019;110:2368–2377. 10.1111/cas.14110
Contributor Information
Jiang Runqiu, Email: jiangrq@nju.edu.cn.
Xu Xuezhong, Email: zhangcyong888@126.com.
REFERENCES
- 1. Van den Bossche J, Saraber DL. Metabolic regulation of macrophages in tissues. Cell Immunol. 2018;330:54‐59. 10.1016/j.cellimm.2018.01.009 [DOI] [PubMed] [Google Scholar]
- 2. Kim J, Bae JS. Metabolic regulation of macrophages in tumor microenvironment. Curr Opin Hematol. 2018;25:52‐59. [DOI] [PubMed] [Google Scholar]
- 3. Moghaddam AS, Mohammadian S, Vazini H, et al. Macrophage plasticity, polarization and function in health and disease. J Cell Physiol. 2018;233:6425‐6440. 10.1002/jcp.26429 [DOI] [PubMed] [Google Scholar]
- 4. Netea‐Maier RT, Smit JWA, Netea MG. Metabolic changes in tumor cells and tumor‐associated macrophages: a mutual relationship. Cancer Lett. 2018;413:102‐109. [DOI] [PubMed] [Google Scholar]
- 5. Shi X, Shiao SL. The role of macrophage phenotype in regulating the response to radiation therapy. Transl Res. 2018;191:64‐80. [DOI] [PMC free article] [PubMed] [Google Scholar]
- 6. Aziz AUR, Farid S, Qin K, Wang H, Liu B. PIM kinases and their relevance to the PI3K/AKT/mTOR pathway in the regulation of Ovarian cancer. Biomolecules. 2018;8 10.3390/biom8010007 [DOI] [PMC free article] [PubMed] [Google Scholar]
- 7. Mantovani A, Locati M. Macrophage metabolism shapes angiogenesis in tumors. Cell Metab. 2016;24:653‐654. [DOI] [PubMed] [Google Scholar]
- 8. Wenes M, Shang M, Di Matteo M, et al. Macrophage metabolism controls tumor blood vessel morphogenesis and metastasis. Cell Metab. 2016;24:701‐715. [DOI] [PubMed] [Google Scholar]
- 9. Tarade D, Ohh M. The HIF and other quandaries in VHL disease. Oncogene. 2018;37:139‐147. [DOI] [PubMed] [Google Scholar]
- 10. Ananthakrishnan AN, Bernstein CN, Iliopoulos D, et al. Environmental triggers in IBD: a review of progress and evidence. Nat Rev Gastroenterol Hepatol. 2018;15:39‐49. [DOI] [PubMed] [Google Scholar]
- 11. Bandara V, Michael MZ, Gleadle JM. Hypoxia represses microRNA biogenesis proteins in breast cancer cells. BMC Cancer. 2014;14:533. [DOI] [PMC free article] [PubMed] [Google Scholar]
- 12. Mathew LK, Lee SS, Skuli N, et al. Restricted expression of miR‐30c‐2‐3p and miR‐30a‐3p in clear cell renal cell carcinomas enhances HIF2alpha activity. Cancer Discov. 2014;4:53‐60. [DOI] [PMC free article] [PubMed] [Google Scholar]
- 13. Kuang DM, Peng C, Zhao Q, Wu Y, Chen MS, Zheng L. Activated monocytes in peritumoral stroma of hepatocellular carcinoma promote expansion of memory T helper 17 cells. Hepatology. 2010;51:154‐164. [DOI] [PubMed] [Google Scholar]
- 14. Huang Y, Zhou J, Luo S, et al. Identification of a fluorescent small‐molecule enhancer for therapeutic autophagy in colorectal cancer by targeting mitochondrial protein translocase TIM44. Gut. 2018;67:307‐319. [DOI] [PubMed] [Google Scholar]
- 15. Valis K, Talacko P, Grobarova V, Cerny J, Novak P. Shikonin regulates C‐MYC and GLUT1 expression through the MST1‐YAP1‐TEAD1 axis. Exp Cell Res. 2016;349:273‐281. [DOI] [PubMed] [Google Scholar]
- 16. Huang J, Yao X, Zhang J, et al. Hypoxia‐induced downregulation of miR‐30c promotes epithelial‐mesenchymal transition in human renal cell carcinoma. Cancer Sci. 2013;104:1609‐1617. [DOI] [PMC free article] [PubMed] [Google Scholar]
- 17. Xing Y, Zheng X, Li G, et al. MicroRNA‐30c contributes to the development of hypoxia pulmonary hypertension by inhibiting platelet‐derived growth factor receptor beta expression. Int J Biochem Cell Biol. 2015;64:155‐166. [DOI] [PubMed] [Google Scholar]
- 18. Zou YF, Liao WT, Fu ZJ, Zhao Q, Chen YX, Zhang W. MicroRNA‐30c‐5p ameliorates hypoxia‐reoxygenation‐induced tubular epithelial cell injury via HIF1alpha stabilization by targeting SOCS3. Oncotarget. 2017;8:92801‐92814. [DOI] [PMC free article] [PubMed] [Google Scholar]
- 19. Martinello K, Hart AR, Yap S, Mitra S, Robertson NJ. Management and investigation of neonatal encephalopathy: 2017 update. Arch Dis Child Fetal Neonatal Ed. 2017;102:F346‐F358. [DOI] [PMC free article] [PubMed] [Google Scholar]
- 20. Filho IPT. 2017 Military supplement mini‐review: perfluorocarbons, oxygen transport and microcirculation in low flow states: in vivo and in vitro studies. Shock. 2017;354 10.1097/shk.0000000000000994 [DOI] [PubMed] [Google Scholar]
- 21. Byndloss MX, Baumler AJ. The germ‐organ theory of non‐communicable diseases. Nat Rev Microbiol. 2018;16:103‐110. [DOI] [PubMed] [Google Scholar]
- 22. Vela D. Hepcidin, an emerging and important player in brain iron homeostasis. J Transl Med. 2018;16:25. [DOI] [PMC free article] [PubMed] [Google Scholar]
- 23. Kunnumakkara AB, Sailo BL, Banik K, et al. Chronic diseases, inflammation, and spices: how are they linked? J Transl Med. 2018;16:14. [DOI] [PMC free article] [PubMed] [Google Scholar]
- 24. Kim R. Effects of surgery and anesthetic choice on immunosuppression and cancer recurrence. J Transl Med. 2018;16:8. [DOI] [PMC free article] [PubMed] [Google Scholar]
- 25. Hummel R, Hussey DJ, Haier J. MicroRNAs: predictors and modifiers of chemo‐ and radiotherapy in different tumour types. Eur J Cancer. 2010;46:298‐311. [DOI] [PubMed] [Google Scholar]
- 26. Irani S, Hussain MM. Role of microRNA‐30c in lipid metabolism, adipogenesis, cardiac remodeling and cancer. Curr Opin Lipidol. 2015;26:139‐146. [DOI] [PubMed] [Google Scholar]
- 27. Li CY, Liang GY, Yao WZ, et al. Identification and functional characterization of microRNAs reveal a potential role in gastric cancer progression. Clin Transl Oncol. 2017;19:162‐172. [DOI] [PubMed] [Google Scholar]
- 28. Li XH, Ha CT, Fu D, Xiao M. Micro‐RNA30c negatively regulates REDD1 expression in human hematopoietic and osteoblast cells after gamma‐irradiation. PLoS ONE. 2012;7:e48700. [DOI] [PMC free article] [PubMed] [Google Scholar]
- 29. Corradetti MN, Inoki K, Guan KL. The stress‐inducted proteins RTP801 and RTP801L are negative regulators of the mammalian target of rapamycin pathway. J Biol Chem. 2005;280:9769‐9772. [DOI] [PubMed] [Google Scholar]
- 30. Jin HO, An S, Lee HC, et al. Hypoxic condition‐ and high cell density‐induced expression of Redd1 is regulated by activation of hypoxia‐inducible factor‐1alpha and Sp1 through the phosphatidylinositol 3‐kinase/Akt signaling pathway. Cell Signal. 2007;19:1393‐1403. [DOI] [PubMed] [Google Scholar]
- 31. Pinno J, Bongartz H, Klepsch O, et al. Interleukin‐6 influences stress‐signalling by reducing the expression of the mTOR‐inhibitor REDD1 in a STAT3‐dependent manner. Cell Signal. 2016;28:907‐916. [DOI] [PubMed] [Google Scholar]
- 32. Williamson DL, Dungan CM, Mahmoud AM, Mey JT, Blackburn BK, Haus JM. Aberrant REDD1‐mTORC1 responses to insulin in skeletal muscle from Type 2 diabetics. Am J Physiol Regul Integr Comp Physiol. 2015;309:R855‐R863. [DOI] [PMC free article] [PubMed] [Google Scholar]
- 33. Gu Y, Kaufman JL, Bernal L, et al. MLN4924, an NAE inhibitor, suppresses AKT and mTOR signaling via upregulation of REDD1 in human myeloma cells. Blood. 2014;123:3269‐3276. [DOI] [PMC free article] [PubMed] [Google Scholar]
- 34. Steiner JL, Kimball SR, Lang CH. Acute alcohol‐induced decrease in muscle protein synthesis in female mice is REDD‐1 and mTOR‐independent. Alcohol Alcohol. 2016;51:242‐250. [DOI] [PMC free article] [PubMed] [Google Scholar]


