Abstract
Gallbladder cancer (GBC) is the most common malignancy of the bile duct and has a high mortality rate. Here, we demonstrated that BRD4 inhibitor JQ1 and histone deacetylase inhibitor suberoylanilide hydroxamic acid (SAHA) synergistically inhibited the GBC cells in vitro and in vivo. Our results showed that cotreatment with JQ1 and SAHA significantly inhibited proliferation, cell viability and metastasis, and induced apoptosis and G2/M arrest in GBC cells, with only minor effects in benign cells. In vivo, tumor volumes and weights of GBC xenograft models were significantly decreased after treatment with JQ1 or SAHA; meanwhile, the cotreatment showed the strongest effect. Further study indicated that the above anticancer effects was associated with the downregulation of BRD4 and suppression of PI3K/AKT and MAPK/ERK pathways. These findings highlight JQ1 and SAHA as potential therapeutic agents and their combination as a promising therapeutic strategy for GBC.
Keywords: BRD4, combination treatment, gallbladder cancer, histone deacetylases, PI3K/AKT and MAPK/ERK signaling pathways
1. INTRODUCTION
Gallbladder cancer (GBC) is the most common and aggressive malignancy of the biliary tract worldwide.1, 2 The only potentially curative approach is complete surgical resection in the early stage; however, GBC is often diagnosed at advanced stage because of its non‐specific symptoms and highly invasive character, and its response to traditional chemotherapy and radiotherapy is extremely limited.3, 4, 5, 6 As such, GBC remains a highly lethal disease, with the overall 5‐year survival rate <5%. The reported mean survival ranges from 13.2 to 19 months.5, 7, 8 Therefore, the current treatment options for GBC are very limited, which makes the development and exploration of novel and effective anticancer agents for GBC treatment vital.
Histone acetylation marks are among the most abundant post–translational modifications of the histones involved in regulating gene expression, which are written by histone acetyltransferases (HAT), erased by histone deacetylases (HDAC) and read by bromodomain‐containing proteins (BRD), such as bromodomain and extra‐terminal domain (BET) proteins.9, 10, 11 HDAC play a crucial role in the regulation of cell proliferation and cell death, inhibition of which causes the accumulation of acetylated forms of histones, and high relative levels of global histone acetylation are associated with a favorable prognosis in several cancer types.12, 13, 14, 15 The HDAC family consists of 18 members, which are classified into 4 major classes: Class I (HDAC 1,2,3,8), Class II (HDAC 4,5,6,7,9,10), Class III (Sirt1 to Sirt7) and Class IV (HDAC11).16 HDAC inhibitors represent the first success of epigenetic‐based cancer therapy.17 Among them, vorinostat (suberoylanilide hydroxamic acid [SAHA]) inhibits HDAC1, HDAC2, HDAC3, HDAC6 and HDAC8 through coordination with the catalytic Zn(II) structure and has been approved by the U.S. Food and Drug Administration (FDA) for the treatment of the cutaneous manifestations of cutaneous T‐cell lymphoma.18, 19, 20, 21
BRD4 is the most thoroughly studied member of the BET family proteins, which consists of 4 members in humans, BRD2, BRD3, BRD4 and the bromodomain testis‐specific protein (BRDT).10 BRD4 recognizes the acetylated lysine on the nucleosomal histones via its tandem N‐terminal bromodomains and functions as a transcription regulator via its C‐terminal bromodomains, through which BRD4 interacts and recruits positive transcription elongation factor b (pTEFb), a heterodimer composed of cyclin‐dependent kinase 9 (CDK9) and its regulator cyclin T, which phosphorylates serine 2 on the C‐terminal bromodomain of RNA pol II for mRNA transcript elongation.22, 23, 24, 25, 26, 27 BRD4 has been shown to couple histone acetylation to transcript elongation and increase the transcription of various important genes such as MYC and BCL2.28, 29, 30, 31, 32 Therefore, BRD4 is involved in modulation of a wide range of biological functions that are potentially relevant to the treatment of cancers, including apoptosis, cell cycle, growth, proliferation, differentiation and invasion.21 As a result, BET bromodomains are promising therapeutic targets for cancers, and several BET inhibitors, for example JQ1, have been developed in recent ten years that competitively bind to acetyl‐lysine recognition pockets and displace BET proteins from chromatin.21, 33
Both BRD4 and HDAC are related to epigenetic regulation of gene expression via histone acetylation, and their inhibitors have similar genes and biological effects in cancers.34 Combinations of HDAC inhibitors with BET inhibitors have become a research hotspot and have shown efficacy in several cancer types.10, 32, 35, 36 However, little is yet known about the effects or mechanisms of either HDAC inhibitors or BET inhibitors, let alone their cotreatment on human GBC cells.
In this study, we explored the anticancer effects of JQ1, SAHA and their combination on GBC cells and investigated the underlying mechanisms mediating these effects. We found that both JQ1 and SAHA suppressed cell viability, proliferation, metastasis and invasion, and induced apoptosis and cell cycle arrest in vitro. Meanwhile, JQ1 and/or SAHA treatments dramatically inhibited the growth of GBC in vivo. These effects were accompanied with a significant downregulation of BRD4 expression and suppression of PI3K/AKT and MAPK/ERK signaling pathways. More importantly, we found that cotreatment with JQ1 and SAHA is more effective than treatment with a single agent alone both in vitro and in vivo, suggesting that combination treatment with JQ1 and SAHA might be a promising new strategy for the treatment of GBC.
2. MATERIALS AND METHODS
2.1. Reagents
(+)‐JQ‐1, SAHA, entinostat (MS‐275), bortezomib, PI3K inhibitor (GDC‐0941) and ERK1/2 inhibitor (GDC‐0994) were obtained from MCE (MedChem Express), stored at −20°C as 10 mmol/L dissolved in 100% DMSO. All the inhibitors were subpackaged in 10‐μL aliquots for single use to avoid multiple freeze‐thaw cycles that could result in compound decomposition and loss of activity. The final DMSO concentration used was <0.1% and the negative control (NC) group was treated with DMSO only. A Cell Counting Kit‐8 (CCK‐8) was purchased from Sigma‐Aldrich. An Annexin V‐FITC Apoptosis Detection Kit was purchased from BD Pharmingen. All antibodies were obtained from Santa Cruz Biotechnology. All cell culture supplies were purchased from Invitrogen Gibco.
2.2. Cell culture
The human GBC cell lines (NOZ, SGC‐996 and GBC‐SD) and benign cells 293T were obtained from the Cell Bank of the Type Culture Collection of the Chinese Academy of Sciences (Shanghai, China). All experiments with cell lines were performed within 6 months after thawing or cells being obtained. NOZ cells were cultured in Williams’ medium and SGC‐996 were cultured in RPMI‐1640 medium (Hyclone). The GBC‐SD and 293T cells were cultured in DMEM (Gibco). All cells were supplemented with 100 μg/mL streptomycin, 100 U/mL penicillin (Hyclone) and 10% FBS (Gibco), and maintained at 37°C in a 5% CO2 humidified incubator.
2.3. Cell viability assay, calculation of GI50 and combination index
The viability of cells treated with drugs was measured by CCK‐8 assay. Cells were seeded into 96‐well plates at a density of 3000 cells/well, cultured for 16‐24 hours and subsequently treated with defined concentration ranges of JQ1 or SAHA for 48 hours to determine the GI50. And then the cells were treated with various concentrations of JQ1 or SAHA based on their GI50 in each cell line for 24, 48 or 72 hours. CCK‐8 (10 μL) was added to each well after treatment and the cells were incubated for exactly 120 minutes away from light. The absorbance value (OD) was measured at 450 nm using a microplate reader (Bio‐Tek). Cell viability was calculated as follows: cell viability = (OD of control − OD of treatment)/(OD of control − OD of blank) × 100%. The assay in each cell line was repeated 3 times. For determination of drug synergy, different combinations of dose of JQ1 and SAHA were chosen based on the 48 hour GI50 of each cell line and combination index (CI) scores were calculated using the Chou‐Talalay method and CompuSyn software.37 For this analysis, we entered the combination treatment data, along with the data obtained from single agent treatments, into CompuSyn to determine the CI value for each combination point. The CI value quantitatively defines antagonism (CI > 1.5), additivity (1 < CI < 1.5) and synergy (CI < 1), and the results are shown as the classic isobologram. The cell line‐dependent GI50 and 48 hour combination concentrations used for subsequent analyses are given in Table 1. As for the determination of the drug synergy using cell line‐dependent GI50, the value (q) was determined by the fractional product equation of Webb.37 In this part, the q value quantitatively defines antagonism (q < 1.0), additivity (q = 1.0) and synergy (q > 1.0), and the results are shown as a column chart.
Table 1.
Treatment doses for single and combined treatment
| Cell lines | JQ1 GI50 (μmol/L) | SAHA GI50 (μmol/L) |
|---|---|---|
| NOZ | 5.40 | 4.83 |
| SGC‐996 | 2.35 | 2.26 |
| GBC‐SD | 2.35 | 2.16 |
| 293T | 4.15 | 9.93 |
| JQ1 + SAHA combination doses | ||
| NOZ | 5.00 | 4.00 |
| SGC‐996 | 2.00 | 2.00 |
| GBC‐SD | 2.00 | 2.00 |
| 293T | 4.00 | 5.00 |
The cells were treated with various concentrations of JQ1, SAHA or their combination. Cell viability was measured by CCK‐8 assay right after treatment and 48 h later. The results were used to determine the GI50 in each cell line (upper part). The doses for combination treatment with synergistic effects in each cell line were determined according to the Chou‐Talalay method, and the respective doses applied for further assays are listed (lower part).
2.4. Colony‐forming assay
The cells were seeded into 6‐well plates at a density of 500 cells/well 48 hours post–drug treatment for 7‐10 days. Then the colonies were fixed with 4% paraformaldehyde for 30 minutes and stained with 0.1% crystal violet (Sigma‐Aldrich) for 20 minutes. The colonies were observed under a microscope (Leica) and photographed after washing and drying up the plates.
2.5. Migration and invasion assay
Twenty‐four‐well Transwell chamber inserts (Corning, Corning, NY, USA) and Corning BioCoat Growth Factor Reduced Matrigel Invasion Chambers (Corning) were used in migration and invasion assays, respectively; 2 × 10⁴ cells in 200 μL of serum‐free medium were seeded into the upper chamber, and 750 μL medium supplemented with 10% FBS was added into the lower chamber. The cells were incubated for 24 hours and then fixed with 4% paraformaldehyde for 30 minutes. The cells on the top of the chamber were washed with PBS and then scraped with a cotton swab. The cells adherent to the lower chamber were stained with 0.1% crystal violet for 20 minutes at room temperature and counted in 5 random visible fields under a microscope.
2.6. Apoptosis assay
NOZ, SGC‐996 and 293T cells were treated with JQ1 and/or SAHA for 48 hours and then collected and washed 3 times with PBS. The cells were resuspended with 100 μL 1× binding buffer, and then combined with 5 μL of annexin V‐FITC and 5 μL of propidium iodide (PI) and incubated for 30 minutes at room temperature in the dark. Then 400 μL of the binding buffer was added to the suspension. The samples were then immediately measured by flow cytometry (FACSCalibur BD).
2.7. Cell cycle analyses
After treatment with a single drug or their combinations for 48 hours, NOZ, SGC‐996 and 293T cells were harvested, washed 3 times with PBS and fixed with 75% ethanol at 4°C overnight. Then the cells were centrifuged (1465 g, 5 minutes), washed and resuspended in cold PBS and incubated with 10 mg/mL RNase and 1 mg/mL PI at 37°C for 30 minutes shielded from light. Cell cycle analyses were analyzed by flow cytometry.
2.8. Western blot analysis
Protein was extracted by lysis for 30 minutes on ice in RIPA buffer (Cell Signaling). Proteins were separated in SDS‐PAGE and then transferred onto PVDF membranes (Millipore). The membranes were blocked with 5% skim milk in TBS‐T (150 mmol/L NaCl, 10 mmol/L TRIS, PH 7.6 and 0.1% TWEEN‐20) at room temperature for 1 hour, washed for 5 minutes 3 times with TBS‐T and then incubated with primary antibodies at 4°C overnight. All the primary antibodies were obtained from Cell Signaling Technology. After that, membranes were then washed with TBS‐T for 10 minutes 3 times and incubated with appropriate HRP‐conjugated secondary antibody at room temperature for 1 hour. Ultimately, the proteins were measured using a Gel Doc 2000 (Bio‐Rad).
2.9. Quantitative real‐time PCR
Total RNA was extracted from cells using TRIzol Reagent. cDNA was synthesized by PrimeScript Reverse Transcriptase (Takara) following the manufacturer's instructions. The expression level of target was measured using the SYBR Green method and the StepOnePlus Real‐time PCR System (Applied Biosystems). The primers sequences are listed as follows: GAPDH forward: 5′‐CAACAGCCTCAAGATCATCAGC‐3′, GAPDH reverse: 5′‐TTCTAGACGGCAGGTCAGGTC‐3′; BRD4 forward: 5′‐ACAACAAGCCTGGAGATGACA‐3′, BRD4 reverse: 5′‐GTTTGGTACCGTGGAAACGC‐3′.
2.10. siRNA and plasmid transfection
BRD4 siRNA (5′‐CCUGAUUACUAUAAGAUCAdTdT‐3′) was designed and synthesized by Biotend. BRD4‐siRNA or NC‐siRNA was transfected into the cells plated in 6‐well plates at 30% density using Lipofectamine 2000 (Invitrogen) according to the manufacturer's protocol. The pcDNA4c hBrd4 was obtained from Addgene (Plasmid 14441) and the amino acid change T249P was modified by Longqian Biotech. BRD4 plasmids (Longqian Biotech) or control plasmids were transfected into cells by using Viafect Transfection Reagent (Promega).
2.11. In vivo nude mouse subcutaneous xenograft model
All in vivo studies were approved by the Ethics Committee of Xinhua Hospital Affiliated to Shanghai Jiaotong University School of Medicine. Male nude mice (aged 4 weeks, weighting 18‐22 g) were purchased from the Shanghai Laboratory Animal Center of the Chinese Academy of Sciences (Shanghai, China). The mice were allowed free access to food and water and were housed at 25 ± 2°C at a relative humidity of 70 ± 5% under natural light or dark conditions for 1 week. NOZ cells (2 × 10⁶ in 200 μL PBS) were injected into the left axilla of each mouse. The following day, the mice were randomly divided into 4 groups of 5 mice for each treatment: negative control with vehicle alone; 50 mg/kg/d JQ1; 50 mg/kg/d SAHA; and JQ1 plus SAHA. Both JQ1 and SAHA were formulated in vehicle (10% DMSO and 90% of 10% 2‐hydroxypropyl‐β‐cyclodextrin, CAS 128446‐35‐5). All treatments were administered intraperitoneally 3 days per week (Monday, Wednesday and Friday) for 4 weeks, starting on day 3 after injection of NOZ cells. The tumor volumes (0.5 × width2 × length; measured by caliper) were estimated weekly. Eight hours after the last treatment, the mice were killed by cervical dislocation, and the tumors were carefully dissected and weighed. Proteins were extracted from 2 tumors of each group and the others were stored in 4% paraformaldehyde for further analyses.
2.12. Immunohistochemistry
Tumors were stored in 4% paraformaldehyde were then embedded in paraffin, cut into 5‐mm sections and mounted on slides. The expression of BRD4, Ki‐67, PCNA, cleaved caspase‐3, p‐AKT and p‐ERK1/2 were analyzed by immunohistochemical streptavidin‐peroxidase staining (IHC). Pictures were taken using a microscope (Leica) and the analysis of IHC was done using ImageJ software by measuring pixel units.
2.13. Statistical analysis
All assays were performed at least 3 times. Statistical analysis was performed by Student's t test with GraphPad Prism when necessary and data are expressed as the mean ± SD unless otherwise stated. P values of <0.05 were considered significant. The combination index (CI) was analyzed by CompuSyn, with values of CI < 1 considered significant. As for the values (q) determined by the fractional product equation of Webb, q > 1.0 were considered synergistic.
3. RESULTS
3.1. JQ1 and suberoylanilide hydroxamic acid exert proliferation and viability inhibitory effects, and their combination treatment has synergistic effects in gallbladder cancer cell lines
The expression of BRD4 and HDAC in GBC cell lines (NOZ, SGC‐996 and GBC‐SD) and benign cells 293T were measured by western blotting. This showed that BRD4 and HDAC expression was notably increased in GBC cell lines and in proportion to the 48 hour GI50 values of either JQ1 or SAHA (Figure 1A‐D). Cell proliferation was determined by CCK‐8 assay, and the results suggested that single treatment with JQ1 or SAHA alone significantly inhibited the proliferative ability of GBC cell lines in a dose‐dependent and time‐dependent manner; however, these effects were less obvious in benign cells 293T (Figure 2A,B). Meanwhile, strong synergies (CI < 1) were detected in GBC cell lines based on cell viability results using the Chou‐Talalay method.37 In contrast, only mild synergy of the combination treatment was seen in 293T (Figure 2C). Dosages for the combined treatment were listed in the Table 1. Then, a colony formation assay was performed to determine the proliferation capacity of single cells. The co–treatment synergistically suppressed long‐term proliferation more than each inhibitor alone at the same doses in all GBC cell lines (Figure 2D). To further confirm that the synergistic effects by the combination of JQ1 and SAHA were mediated by HDAC inhibition, but not other off‐target effects. We repeated the colony formation assay using another HDAC inhibitor entinostat (MS‐275; the treatment dose of MS‐275 was 2.5 μmol/L (lower than its GI50 in each cell line). The results of MS‐275 were similar to those for SAHA, which proved that HDAC inhibition was involved in the synergistic effects of JQ1 and SAHA (Figure 2E).
Figure 1.
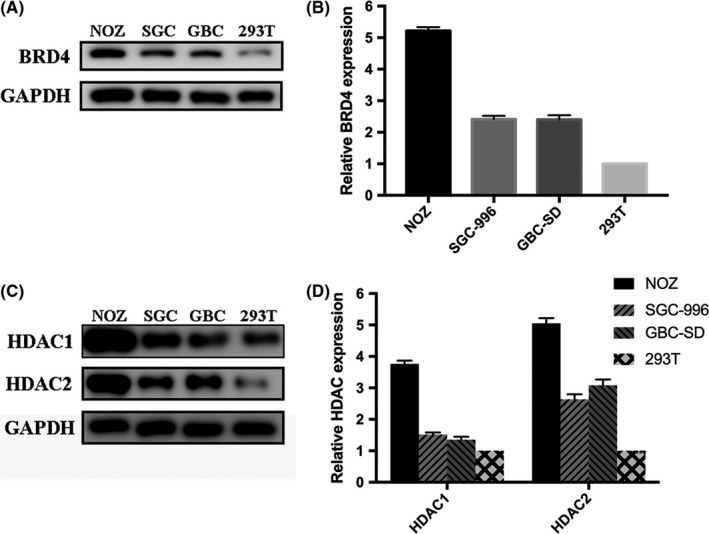
Expression levels of BRD4 and histone deacetylases (HDAC) in gallbladder cancer (GBC) cell lines (NOZ, SGC‐996 and GBC‐SD) and 293T. A and B, BRD4 expression in NOZ, SGC‐996, GBC‐SD and 293T. C and D, HDAC1 and HDAC2 expression in NOZ, SGC‐996, GBC‐SD and 293T
Figure 2.
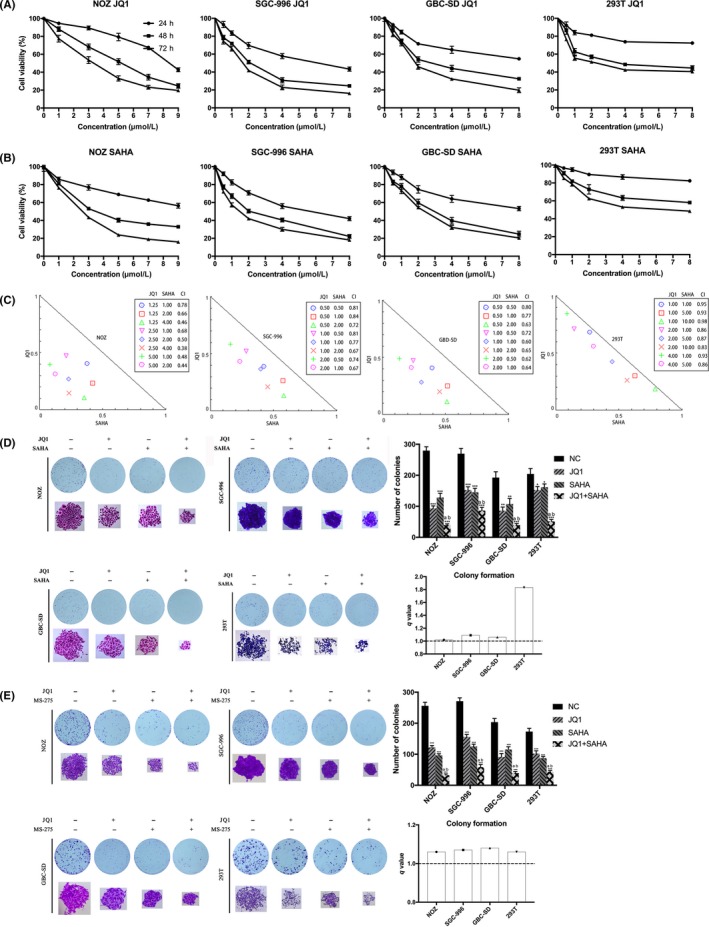
JQ1 and suberoylanilide hydroxamic acid (SAHA) synergistically inhibit the proliferation and viability of gallbladder cancer (GBC) cells. A and B, JQ1 or SAHA alone inhibited proliferation and cell viability of GBC cells in a dose‐dependent and time‐dependent manner. NOZ, SGC‐996, GBC‐SD and 293T cells were treated with various concentrations of JQ1 or SAHA for 24, 48 or 72 h, respectively. Cell viability was assessed using the CCK‐8 assay. C, JQ1 and SAHA exerted synergistic effects in GBC cell lines and 293T. All the cell lines were treated with various combinations with JQ1 and SAHA for 48 h, then the analyses were performed using the CompuSyn Software. Combination index (CI) values <1.0 indicate a synergistic effect of the combination with JQ1 and SAHA. D, JQ1 and SAHA synergistically suppressed colony formation of GBC cell lines and 293T. E, JQ1 and MS‐275 synergistically suppressed colony formation of GBC cell lines and 293T. Cells were treated with JQ1 and/or SAHA(MS‐275) and allowed to form colonies for 7‐10 d. Bar chart shows the number of colonies. All data are presented as mean ± SD and all the experiments were repeated 3 times. CI values: <1 indicates synergism, 1‐1.5 additive effect, >1.5 antagonism. q value is shown as column chart and: <1.0 indicates antagonism, =1.0 additivity, >1.0 synergy. Significant differences are indicated by *P < 0.05, **P < 0.01 and ***P < 0.001 vs negative control (NC); a: P < 0.05 JQ1 vs JQ1 + SAHA; b: P < 0.05, SAHA vs JQ1 +SAHA
3.2. Combination treatment with JQ1 and suberoylanilide hydroxamic acid synergistically inhibits the metastasis of gallbladder cancer cells
A Transwell assay was performed in GBC cell lines to evaluate the effect of JQ1 and SAHA in mediating cell migration and invasion. The results indicated that treatment with either JQ1 or SAHA alone significantly weakened the migration and invasion capacities of GBC cells and their cotreatment, resulting in synergies (Figure 3A‐E). Furthermore, the expression of epithelial‐mesenchymal transition (EMT)‐related proteins was analyzed by western blot. The results showed that the treatment increased the expression of ZO‐1 and E‐cadherin while inhibiting the expression of N‐cadherin, vimentin, MMP‐2 and MMP‐9, suggesting that JQ1 and SAHA inhibited and had synergistic effect in the EMT process of GBC (Figure 3F).
Figure 3.
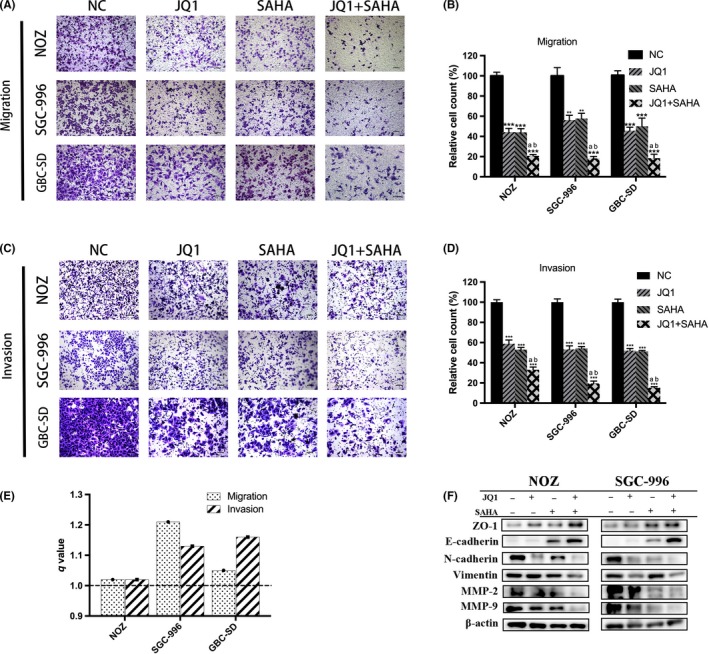
JQ1 and suberoylanilide hydroxamic acid (SAHA) synergistically inhibit metastasis of gallbladder cancer (GBC). A and C, Transwell migration and invasion assays showed that JQ1 and/or SAHA significantly inhibited GBC metastasis and the combination treatment exerted a stronger effect. B and D, Bar charts show the number of migrating or invading cells. E, q values of combination treatment in GBC are all >1.0, indicating that JQ1 and SAHA had synergistic effects. F, Epithelial‐mesenchymal transition (EMT)‐related proteins in NOZ and SGC‐996 cells were examined by western blot. All data are presented as mean ± SD and all the experiments were repeated 3 times. q value is shown as a column chart: <1.0 indicates antagonism, =1.0 additivity, >1.0 synergy. Significant differences are indicated by *P < 0.05, **P < 0.01 and ***P < 0.001 vs negative control (NC); a: P < 0.05 JQ1 vs JQ1 + SAHA; b: P < 0.05, SAHA vs JQ1 +SAHA
3.3. JQ1 and suberoylanilide hydroxamic acid synergistically induce apoptosis in gallbladder cancer cells
To explore whether cell apoptosis is implicated in anticancer effects caused by JQ1 and SAHA in GBC cells, we conducted flow cytometry analysis. Compared with the NC group, the ratio of apoptotic cells, especially the early apoptotic cells, was significantly increased in the cells treated with JQ1 and/or SAHA, and the combination treatment showed a remarkable synergistic effect in GBC cells. In addition, although the synergistic effect of JQ1 and SAHA in 293T was strong, the actual apoptotic effect was subtle compared to the GBC cells (Figure 4A,C). To further investigate the mechanism of apoptosis induced by JQ1 and SAHA, we examined the expression of caspase family, Bcl‐2 family and other important apoptosis‐related proteins by western blot. The results indicated that the treatment increased the expression of cleaved PARP, cleaved caspase‐3, cleaved caspase‐7, cleaved caspase‐8, cleaved caspase‐9, cytochrome c, p53, Bad, Bax and p27 Kip1, while decreasing the level of c‐MYC, NF‐κb, p‐p53 and Bcl‐2, in particular, the ratio of Bcl‐2/Bax. In addition, the cotreatment showed a stronger effect than single treatment (Figure 4D,E).
Figure 4.
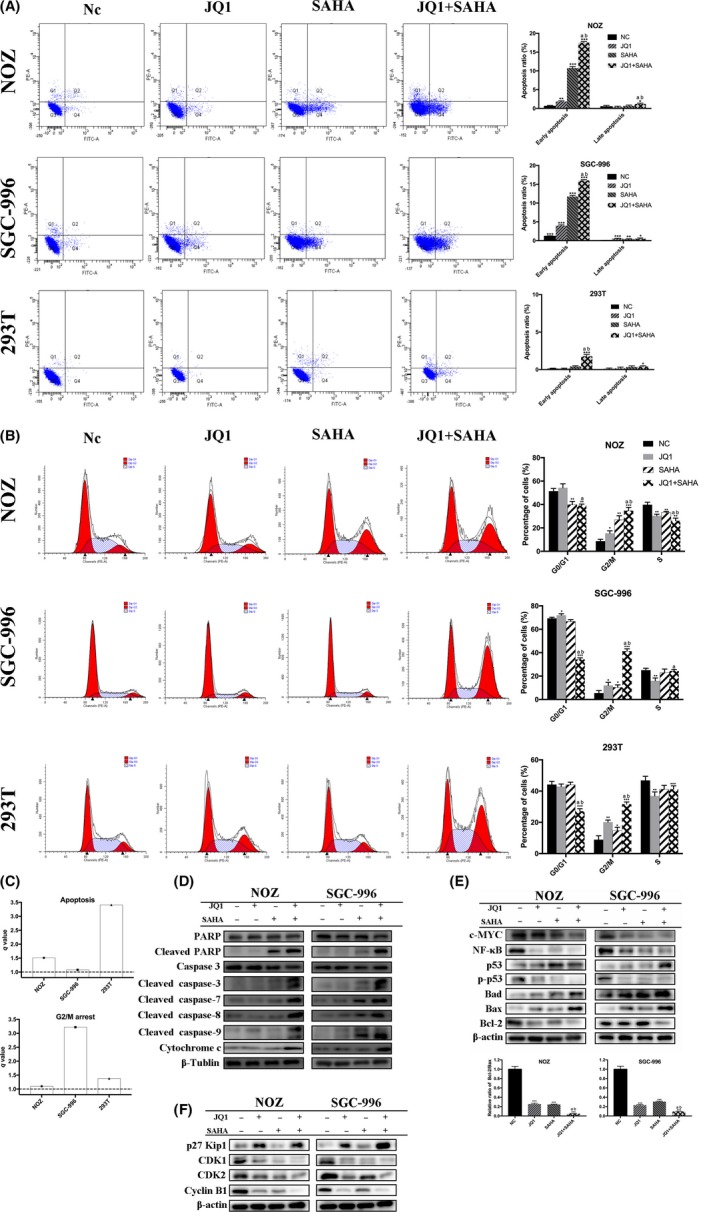
JQ1 and suberoylanilide hydroxamic acid (SAHA) synergistically induced apoptosis and G2/M arrest. A, Apoptosis assay was performed by flow cytometry. NOZ and SGC‐996 cells were treated with JQ1 and/or SAHA for 48 h. The Q3 quadrant, Q4 quadrant, Q2 quadrant and Q1 quadrant indicate the percentages of normal cells, early apoptotic cells, late apoptotic cells and dead cells, respectively. Bar charts showed the ratio of apoptotic cells. B, The cell cycle distribution was analyzed by flow cytometry. Bar charts show the percentages of cell cycle distribution. C, q values are all >1.0, indicating that JQ1 and SAHA showed synergistic effects in inducing apoptosis and G2/M arrest. D and E, Apoptosis‐related proteins and other important proteins were analyzed by western blot. Bar charts showed the relative ratio of Bcl‐2/Bax. F, Cell cycle‐related proteins were analyzed by western blot. All data are presented as mean ± SD and all the experiments were repeated 3 times. q value is shown as a column chart and: <1.0 indicates antagonism, =1.0 additivity, >1.0 synergy. Significant differences are indicated by *P < 0.05, **P < 0.01 and ***P < 0.001 vs negative control (NC); a: P < 0.05 JQ1 vs JQ1 + SAHA; b: P < 0.05, SAHA vs JQ1 +SAHA
3.4. JQ1 and suberoylanilide hydroxamic acid synergistically induce G2/M phase cell cycle arrest in gallbladder cancer cells
To characterize the cellular effects of JQ1, SAHA and their combination in more detail, we investigated cell cycle distribution by flow cytometry. The results showed that treatment with JQ1 or SAHA alone significantly arrested cell cycle progression in GBC and 293T cells by increasing the G2/M phase fraction, with even stronger effects observed in combination treatment (Figure 4B,C). Then we examined the levels of cell cycle‐related proteins by western blot. CDK1, CDK2 and cyclin B1 expression were clearly upregulated; in contrast, p27 Kip1 was downregulated in treatment, especially in the cotreatment group (Figure 4F). The results of the western blot were consistent with flow cytometry, indicating that JQ1 and SAHA synergistically induced G2/M phase arrest in these cells.
3.5. JQ1 and suberoylanilide hydroxamic acid significantly downregulated BRD4 and suppressed the activity of PI3K/AKT and MAPK/ERK signaling pathways, resulting in decreased cell viability in gallbladder cancer cells
It has been proved that downregulation of BRD4 inhibits GBC proliferation via PI3K/AKT pathway,38 and there is complicated cross‐talk between PI3K and MAPK pathways.39 Therefore, to reveal the molecular mechanisms resulting in the above effects of JQ1 and/or SAHA we focused our attention on the PI3K/AKT and MAPK/ERK signaling pathways. Indeed, after drug treatment, JQ1, SAHA and especially their combination dramatically decreased the protein levels of BRD4, HDAC, p‐AKT, p‐MTOR, p‐MEK and p‐ERK1/2 but increased the histone acetylation level (Figure 5B,C). To explore the mechanisms of BRD4 downregulation, we examined the mRNA level of BRD4 by quantitative RT‐PCR and the expression of LC3 A/B by western blot. The results showed that JQ1 and SAHA notably decreased the mRNA level of BRD4 and increased the expression of LC3B (Figure 5A,B). In addition, we pretreated NOZ and SGC‐996 cells with 5 μmol/L bortezomib (a proteasome inhibitor) for 2 hours and then with JQ1 and/or SAHA for 48 hours. The results showed how little the protein level of BRD4 had changed with or without bortezomib (Figure 5C). These results demonstrated that BRD4 protein degradation was a result of the BRD4 mRNA downregulation and autophagy activation; however, it might be irrelative to proteasome activation. Then we explored if the proliferation inhibition induced by JQ1 and/or SAHA was truly associated with downregulation of BRD4 and corresponding suppression in the activity of PI3K/AKT and MAPK/ERK signaling. We first examined the protein expression of BRD4 in NOZ cells after transfection with BRD4 siRNA or plasmid, respectively. The results showed that the levels of BRD4 were significantly decreased after transfection with siRNA, but, in contrast, increased after transfection with BRD4 plasmid. Then we evaluated cell viability after drug exposure with JQ1 and/or SAHA. As shown, knockdown or overexpression of BRD4 can either enhance or abolish the cytotoxicity following drug treatment (Figure 6A,B). To further confirm that blockade of the PI3K/AKT and MAPK/AKT pathways is involved in the effect of JQ1, SAHA and their combination treatment, we pretreated NOZ cells with 10 μmol/L GDC‐0941 (PI3K inhibitor) or 10 μmol/L GDC‐0994 (ERK1/2 inhibitor) for 2 hours, and then with JQ1 or SAHA alone or their combinations for 24 hours. We observed that either GDC‐0941 or GDC‐0994 led to a further decrease in cell viability in all combinations compared to their absence (Figure 6C,D).
Figure 5.
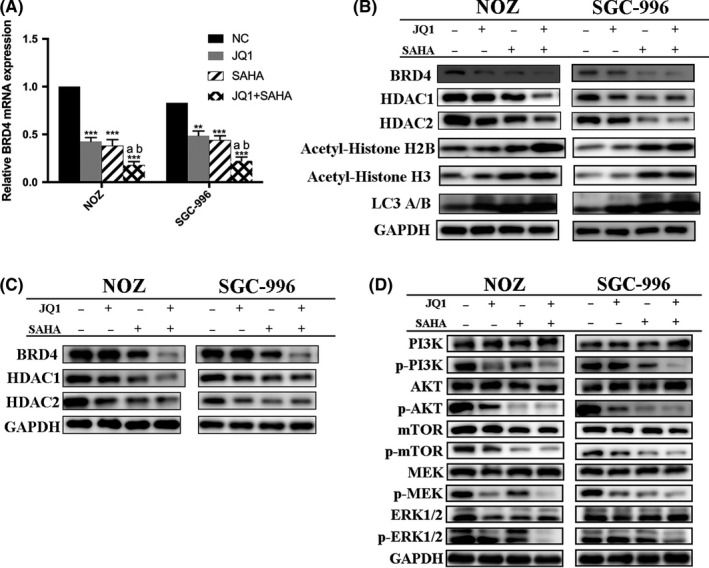
JQ1 and suberoylanilide hydroxamic acid (SAHA) exerted anticancer effects through downregulation of BRD4 and suppression of PI3K/AKT and MAPK/ERK pathways. A, The BRD4 mRNA expression was determined by quantitative RT‐PCR. B, BRD4, histone deacetylases (HDAC), histone acetylation and autophagy level were detected by western blot. C, Expression levels of BRD4 and HDAC after pretreatment with bortezomib and then JQ1 and/or SAHA. D, Expression levels of PI3K/AKT and MAPK/ERK pathway proteins were determined by western blot. Significant differences are indicated by *P < 0.05, **P < 0.01 and ***P < 0.001
Figure 6.
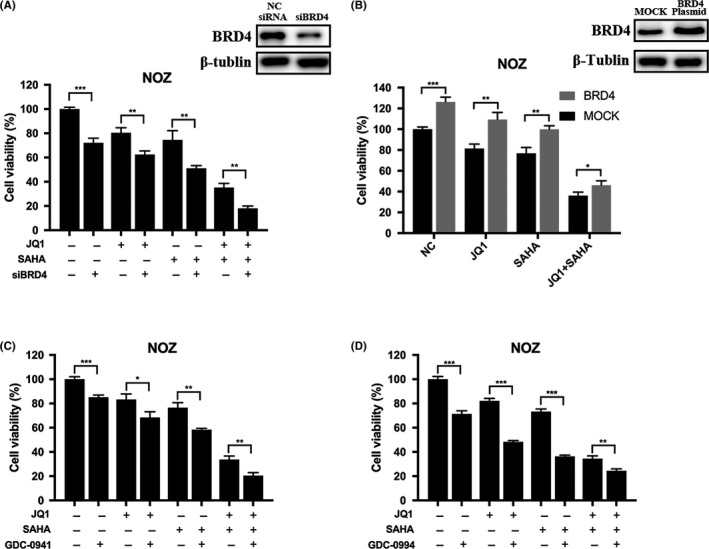
Anticancer effects induced by JQ1 and/or suberoylanilide hydroxamic acid (SAHA) were associated with downregulation of BRD4 and suppression of PI3K/AKT and MAPK/ERK signaling. A, NOZ cells were transfected with negative control (NC) siRNA or BRD4 siRNA, and the knockdown efficiency was examined by western blot. The cells were treated with JQ1 and/or SAHA for 24 h, then cell viability was determined by CCK‐8 assay. B, NOZ cells were transfected with vehicle plasmid or BRD4 full‐length plasmid, and western blot demonstrated that BRD4 expression was upregulated after transfection with BRD4 plasmid. Then cell viability was determined after treatment with JQ1 and/or SAHA for 24 h. C and D, After pretreatment with 10 μmol/L GDC‐0941 (PI3K/AKT inhibitor) or 10 μmol/L GDC‐0994 (MAPK/ERK inhibitor) for 2 h, NOZ cells were then incubated with JQ1 and/or SAHA for 24 h, and cell viability was determined. Bar charts showed the percentages of cell viability. All data are presented as mean ± SD and all the experiments were repeated 3 times. Significant differences are indicated by *P < 0.05, **P < 0.01 and ***P < 0.001
3.6. JQ1 and suberoylanilide hydroxamic acid synergistically inhibit tumor growth in vivo
We next determined the in vivo anticancer activity of JQ1 and/or SAHA against the NOZ tumor xenografts in the nude mice. The anticancer effects due to treatment with intraperitoneal JQ1 and/or SAHA for 4 weeks were compared with the effects of the treatment with vehicle alone. We found that treatment with either JQ1 or SAHA significantly inhibited the growth of tumor volume and weight, and co–treatment with JQ1 and SAHA together exerted the strongest effect (Figure 7A‐D). Then we performed western blot and IHC analysis. The results demonstrated that as compared with the NC group, treatment with either JQ1 or SAHA alone significantly decreased the levels of BRD4, Ki‐67, PCNA, p‐AKT and p‐ERK1/2, and markedly increased the level of cleaved caspase‐3. Moreover, combination treatment with JQ1 and SAHA was associated with further change in the levels of the above indicators (Figures 7E and 8). These in vivo results were in accordance with the in vitro results, and further confirmed the anticancer effects of JQ1 and SAHA and the synergistic effect of their combination.
Figure 7.
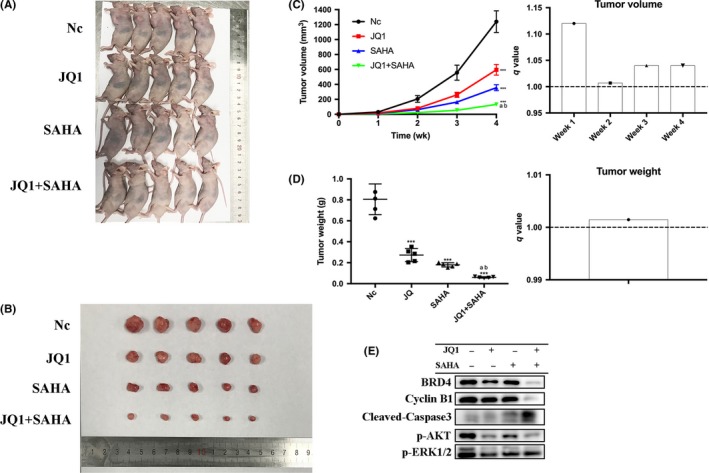
JQ1 and suberoylanilide hydroxamic acid (SAHA) synergistically inhibited tumor growth in vivo. A, NOZ cells (2 × 10⁶ in 200 μL PBS) were injected into the left axilla of each mouse. Three days later, the mice were randomly divided into 4 groups (negative control [NC], JQ1, SAHA and JQ1 + SAHHA) and treated with vehicle (10% DMSO and 90% of 10% 2‐hydroxypropyl‐β‐cyclodextrin, CAS 128446‐35‐5) alone, 50 mg/kg/d JQ1, 50 mg/kg/d SAHA or JQ1 + SAHA, respectively. All treatments were administered intraperitoneally 3 d per week (Monday, Wednesday and Friday) for 4 wk. B, Photo is presented to show the sizes of the tumors excised from the mice. C, The tumor volumes were measured by caliper and estimated (0.5 × width2 × length) weekly. q values all > 1.0 indicate synergistic effects. D, Tumors were weighed. q value > 1.0 indicates synergy. E, Proteins were extracted from the tumors and BRD4, cyclin B1, cleaved caspase‐3, p‐AKT and p‐ERK1/2 expression levels were analyzed by western blot. All data are presented as mean ± SD. q value is shown as a column chart and: <1.0 indicates antagonism, =1.0 additivity, >1.0 synergy. Significant differences are indicated by *P < 0.05, **P < 0.01, and ***P < 0.001 vs negative control (NC); a: P < 0.05 JQ1 vs JQ1 + SAHA; b: P < 0.05, SAHA vs JQ1 + SAHA
Figure 8.
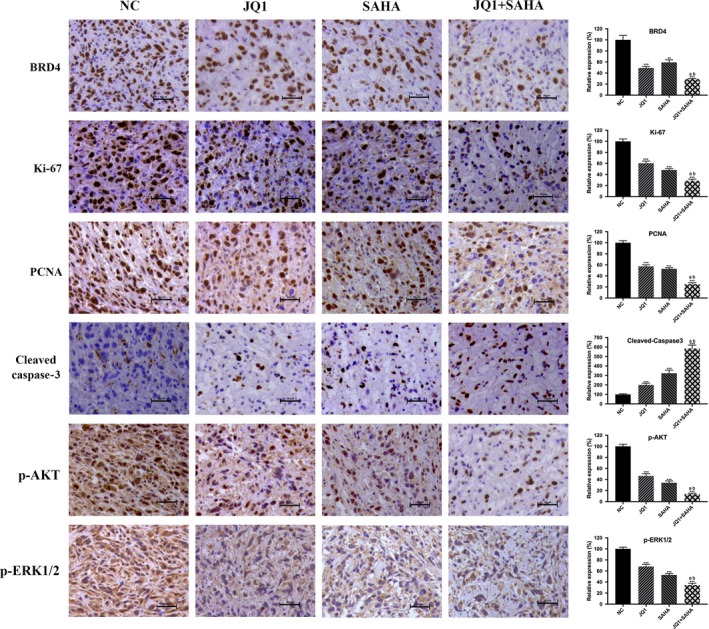
Immunohistochemistry results. BRD4, Ki‐67, PCNA, cleaved caspase‐3, p‐AKT and p‐ERK1/2 expression levels were analyzed using IHC staining. Bar charts showed the relative expression of the above indicators. All data are presented as mean ± SD. Significant differences are indicated by *P < 0.05, **P < 0.01 and ***P < 0.001 vs negative control (NC); a: P < 0.05 JQ1 vs JQ1 + SAHA; b: P < 0.05, SAHA vs JQ1 +SAHA
4. DISCUSSION
In this study, we demonstrated for the first time that BET inhibitor JQ1, HDAC inhibitor SAHA and especially their combination treatment exerted high levels of in vitro and in vivo anticancer activity against gallbladder cancer cells. Our in vitro study revealed that JQ1 and SAHA synergistically led to loss of cell viability, inhibition of metastasis and induction of apoptosis, accompanied with G2/M phase cell cycle arrest in GBC cells via downregulation of BRD4 and suppression of PI3K/AKT and MAPK/ERK pathways. In addition, the NOZ tumor xenografts study showed potent in vivo anticancer effects of JQ1 and SAHA in GBC, based on the dramatic inhibition of tumor volume and weight, and the decreasing expression of tested tumor proliferation markers (Ki‐67 and PCNA). Therefore, our findings suggest that BET inhibitor JQ1 and HDAC inhibitor SAHA are promising agents and their combination treatment is a novel and a potential treatment strategy for gallbladder cancer.
In recent years, the anticancer activity of BET inhibitors and/or HDAC inhibitors has been proved effective in various cancer types,10, 32, 36, 40, 41, 42 but their effects on GBC have remained largely unknown. In this study, it was found that either JQ1 or SAHA alone can significantly inhibit GBC cell viability and proliferation in GBC cells, and their combination is associated with synergistic effects; meanwhile, these effects on 293T cells were much weaker. Thus, we can assume that JQ1 and SAHA are effective and safe agents, and their combination is a promising strategy for the treatment of GBC.
Gallbladder cancer is characterized by high rates of recurrence, early lymph node invasion and metastasis to distant organs, due to which most deaths of patients occur.43 EMT plays a critical role in tumor invasion, metastasis and therapeutic resistance. Thus, inhibiting the EMT process is vital for improving the survival rate of GBC patients. In this study, we conducted migration and invasion assays which showed that JQ1 and SAHA remarkably decreased the migration and invasion ability and exerted synergistic effects in GBC cells. Moreover, the drug treatments altered the protein expression of EMT markers in GBC cells, increasing the expression of ZO‐1 and E‐cadherin whereas decreasing the expression of N‐cadherin, vimentin, MMP‐2 and MMP‐9. These results unequivocally established the role of JQ1 and SAHA in inhibiting the process of EMT as well as invasion and metastasis of GBC cells. Meanwhile, our findings support the rationale that co–treatment with JQ1 and SAHA is better than treatment with only 1 single agent.
Appropriate apoptotic signaling is fundamentally important to preserve a healthy balance between cell death and cell survival and for maintaining genome integrity.44 In this study, we found that JQ1 and/or SAHA‐induced apoptosis can occur via both the intrinsic and extrinsic pathways. Caspase‐3 is a key executioner that can subsequently cleave numerous important cellular substrates such as PARP, and, ultimately, lead to apoptosis. In this study, we found that JQ1 and/or SAHA significantly increased the expression of cleaved caspase‐3 both in vitro and in vivo. In addition, a significant increase in the expression of Bad and a decrease in the ratio of Bcl‐2/Bax, accompanied with a dramatic increase in cytochrome c, cleaved caspase‐9, caspase‐7 and PARP, were also observed, suggesting that intrinsic apoptosis was involved in the apoptosis induced by JQ1 and/or SAHA. Moreover, cleavage of caspase‐8 was also found to be significantly upregulated after treatment with JQ1 and/or SAHA, which is associated with the initiation of the extrinsic apoptosis pathway.45 In addition, other important apoptosis‐related proteins, such as c‐MYC, NF‐κB, p53 and p‐p53, were also found altered in this study, supporting the pro‐apoptotic effects of JQ1 and SAHA. More importantly, combination of JQ1 and SAHA exerted the strongest pro‐apoptotic effects. The above results further provide evidence that co–treatment with JQ1 and SAHA can be a valid strategy for the treatment of GBC.
Successful progression through the cell cycle is controlled by a number of different regulatory mechanisms termed checkpoints.46 The checkpoints are frequently observed defective and nonfunctional in many cancer types and, therefore, could be exploited to target tumor cells by anticancer treatment and result in cell cycle arrest at a specific checkpoint.46, 47 We performed flow cytometry to investigate the cell cycle distribution. The results showed that JQ1 and SAHA synergistically increased the proportion of G2/M cells. In addition, the major players that regulate induction and maintenance of the G2 checkpoint, such as p53, p27 Kip1, CDK1, CDK2 and cyclin B1, were found significantly altered by western blot.46, 47 The above results indicate that G2/M cycle arrest was induced by the treatment. Hence, combination with JQ1 and SAHA can be effective against GBC through inducing G2/M cycle arrest.
PI3K/AKT and MAPK/ERK pathways are often mutated in cancer, between which there exists complex cross‐talk.39 Therefore, we explored the roles of BRD4 and PI3K/AKT and MAPK/ERK pathways in the effectiveness of JQ1 and SAHA single agent treatment and combination treatment for GBC. The protein expression of BRD4, c‐MYC and Bcl‐2 and the phosphorylation levels of tested components (including PI3K, AKT, mTOR, MEK and ERK1/2) of the pathways were significantly decreased after treatments, especially cotreatment in vitro. JQ1 and/or SAHA decreased the mRNA expression of BRD4 and increased the protein expression of LC3 B. Moreover, BRD4 protein degradation remained almost the same after pretreatment with proteasome inhibitor bortezomib. These results indicated that the mechanisms of BRD4 downregulation by JQ1 and SAHA are due to the mRNA downregulation and autophagy activation but not proteasome activation. Consistent with the in vitro results, the protein expression of BRD4, c‐MYC, p‐AKT and p‐ERK1/2 also decreased in response to the treatments in vivo. In addition, combination of JQ1 and/or SAHA with siRNA mediated silencing of BRD4 and further decreased cell viability, while plasmid‐mediated overexpression of BRD4 rescued NOZ cells using all the treatments. Furthermore, combined JQ1 and/or SAHA treatments with either PI3K/AKT inhibitor (GDC‐0941) or MAPK/ERK inhibitor (GDC‐0994) resulted in further cell viability decline. The above results demonstrated that downregulation of BRD4 together with PI3K/AKT and MAPK/ERK pathways contribute to the effectiveness of JQ1 and SAHA against GBC.
In summary, this study demonstrates that JQ1 and SAHA inhibit cancer cell viability and tumor proliferation by inducing apoptosis and G2/M cycle arrest through downregulation of BRD4 and suppression of PI3K/AKT and MAPK/ERK1 pathways. More importantly, the anti–cancer effect can be remarkably enhanced through the combination treatment with JQ1 and SAHA, suggesting that such a strategy may be a novel and effective treatment for GBC.
DISCLOSURE
The authors declare no conflicts of interest for this article.
Liu S, Li F, Pan L, et al. BRD4 inhibitor and histone deacetylase inhibitor synergistically inhibit the proliferation of gallbladder cancer in vitro and in vivo. Cancer Sci. 2019;110:2493–2506. 10.1111/cas.14102
Shilei Liu, Fengnan Li, Ping Dong and Wei Gong contributed equally to this work.
Contributor Information
Ping Dong, Email: dongping@xinhuamed.com.cn.
Wei Gong, Email: gongweius@hotmail.com.
REFERENCES
- 1. Lai CHE, Lau WY. Gallbladder cancer–a comprehensive review. Surgeon. 2008;6:101‐110. [DOI] [PubMed] [Google Scholar]
- 2. Andrew XZ, Theodore SH, Aram FH, David AK. Current management of gallbladder carcinoma. Oncologist. 2010;15:168. [DOI] [PMC free article] [PubMed] [Google Scholar]
- 3. Bizama C, García P, Espinoza JA, et al. Targeting specific molecular pathways holds promise for advanced gallbladder cancer therapy. Cancer Treat Rev. 2015;41:222‐234. [DOI] [PubMed] [Google Scholar]
- 4. Yogesh B, Sujoy P, Usha D, et al. Gallbladder cancer in India: a dismal picture. J Gastroenterol Hepatol. 2010;20:309‐314. [DOI] [PubMed] [Google Scholar]
- 5. Zijah R, Deso M, Farid L, Muharem Z, Mirza M. Incidence and surgical treatment of cancer in gallbladder. Med Arh. 2007;61:30. [PubMed] [Google Scholar]
- 6. Ake n‐S, Yang D. Aspects on gallbladder cancer in 2014. Curr Opin Gastroenterol. 2014;30:326. [DOI] [PubMed] [Google Scholar]
- 7. Xiang‐Song W, Liu‐Bin S, Mao‐Lan L, et al. Evaluation of two inflammation‐based prognostic scores in patients with resectable gallbladder carcinoma. Ann Surg Oncol. 2014;21:449‐457. [DOI] [PubMed] [Google Scholar]
- 8. Butte JM, Matsuo K, Gönen M, et al. Gallbladder cancer: differences in presentation, surgical treatment, and survival in patients treated at centers in three countries. J Am Coll Surg. 2011;212:50‐61. [DOI] [PubMed] [Google Scholar]
- 9. Bhalla KN. Epigenetic and chromatin modifiers as targeted therapy of hematologic malignancies. J Clin Oncol. 2005;23:3971‐3993. [DOI] [PubMed] [Google Scholar]
- 10. Borbely G, Haldosen LA, Dahlman‐Wright K, Zhao C. Induction of USP17 by combining BET and HDAC inhibitors in breast cancer cells. Oncotarget. 2015;6:33623‐33635. [DOI] [PMC free article] [PubMed] [Google Scholar]
- 11. Kelly RDW, Cowley SM. The physiological roles of histone deacetylase (HDAC) 1 and 2: complex co‐stars with multiple leading parts. Biochem Soc Trans. 2013;41:741‐749. [DOI] [PubMed] [Google Scholar]
- 12. Davit M, Philip K, Claudia M, et al. Global histone acetylation levels: prognostic relevance in patients with renal cell carcinoma. Cancer Sci. 2010;101:2664‐2669. [DOI] [PMC free article] [PubMed] [Google Scholar]
- 13. Daniele M, Lucarini G, Filosa A, et al. Prognostic role of global DNA‐methylation and histone acetylation in pT1a clear cell renal carcinoma in partial nephrectomy specimens. J Cell Mol Med. 2010;13:2115‐2121. [DOI] [PMC free article] [PubMed] [Google Scholar]
- 14. Elsheikh SE, Green AR, Rakha EA, et al. Global histone modifications in breast cancer correlate with tumor phenotypes, prognostic factors, and patient outcome. Can Res. 2011;69:3802‐3809. [DOI] [PubMed] [Google Scholar]
- 15. Azadeh E, Jens S, Juergen H, Hermann S. Prognostic relevance of global histone 3 lysine 9 acetylation in ependymal tumors. J Neurosurg. 2013;119:1424. [DOI] [PubMed] [Google Scholar]
- 16. Kristensen LS, Nielsen HM, Hansen LL. Epigenetics and cancer treatment. Eur J Pharmacol. 2009;625:131‐142. [DOI] [PubMed] [Google Scholar]
- 17. Bolden JE, Peart MJ, Johnstone RW. Anticancer activities of histone deacetylase inhibitors. Nat Rev Drug Discovery. 2006;5:769. [DOI] [PubMed] [Google Scholar]
- 18. Codd R, Braich N, Liu J, Soe CZ, Pakchung AAH. Zn(II)‐dependent histone deacetylase inhibitors: suberoylanilide hydroxamic acid and trichostatin A. Int J Biochem Cell Biol. 2009;41:736‐739. [DOI] [PubMed] [Google Scholar]
- 19. Bradner JE, West N, Grachan ML, et al. Chemical phylogenetics of histone deacetylases. Nat Chem Biol. 2010;6:238. [DOI] [PMC free article] [PubMed] [Google Scholar]
- 20. Ping Q, Farid M, Iris K, et al. Effects of targeting endometrial stromal sarcoma cells via histone deacetylase and PI3K/AKT/mTOR signaling. Anticancer Res. 2014;34:2883‐2897. [PubMed] [Google Scholar]
- 21. Amemiya S, Yamaguchi T, Hashimoto Y, Noguchi‐Yachide T. Synthesis and evaluation of novel dual BRD4/HDAC inhibitors. Bioorg Med Chem. 2017;25:3677. [DOI] [PubMed] [Google Scholar]
- 22. Patel MC, Maxime D, Matthew S, et al. BRD4 coordinates recruitment of pause release factor P‐TEFb and the pausing complex NELF/DSIF to regulate transcription elongation of interferon‐stimulated genes. Mol Cell Biol. 2013;33:2497‐2507. [DOI] [PMC free article] [PubMed] [Google Scholar]
- 23. Jang MK, Mochizuki K, Zhou M, Jeong H‐S, Brady JN, Ozato K. The bromodomain protein Brd4 is a positive regulatory component of P‐TEFb and stimulates RNA polymerase II‐dependent transcription. Mol Cell. 2005;19:523‐534. [DOI] [PubMed] [Google Scholar]
- 24. Rahman S, Sowa ME, Ottinger M, et al. The Brd4 extraterminal domain confers transcription activation independent of pTEFb by recruiting multiple proteins, including NSD3. Mol Cell Biol. 2011;31:2641. [DOI] [PMC free article] [PubMed] [Google Scholar]
- 25. Shahbazi J, Liu PY, Atmadibrata B, et al. The bromodomain inhibitor JQ1 and the histone deacetylase inhibitor panobinostat synergistically reduce N‐Myc expression and induce anticancer effects. Clin Cancer Res. 2016;22:2534‐2544. [DOI] [PubMed] [Google Scholar]
- 26. Belkina AC, Denis GV. BET domain co‐regulators in obesity, inflammation and cancer. Nat Rev Cancer. 2012;12:465‐477. [DOI] [PMC free article] [PubMed] [Google Scholar]
- 27. Ran T, Xin L, Dan I, Koh F, Matija PB. Interaction between P‐TEFb and the C‐terminal domain of RNA polymerase II activates transcriptional elongation from sites upstream or downstream of target genes. Mol Cell Biol. 2002;22:321. [DOI] [PMC free article] [PubMed] [Google Scholar]
- 28. Lovén J, Hoke H, Lin C, et al. Selective inhibition of tumor oncogenes by disruption of super‐enhancers. Cell. 2013;153:320‐334. [DOI] [PMC free article] [PubMed] [Google Scholar]
- 29. Lockwood WW, Kreshnik Z, Bradner JE, Harold V. Sensitivity of human lung adenocarcinoma cell lines to targeted inhibition of BET epigenetic signaling proteins. Proc Natl Acad Sci USA. 2012;109:19408‐19413. [DOI] [PMC free article] [PubMed] [Google Scholar]
- 30. Lee TI, Young R. Transcriptional regulation and its misregulation in disease. Cell. 2013;152:1237‐1251. [DOI] [PMC free article] [PubMed] [Google Scholar]
- 31. Jean‐Marc G, Sharp PP, Burns CJ. BET bromodomain inhibitors: a patent review. Expert Opin Ther Pat. 2014;24:185‐199. [DOI] [PubMed] [Google Scholar]
- 32. Warren F, Sunil S, Jun Q, et al. Highly active combination of BRD4 antagonist and histone deacetylase inhibitor against human acute myelogenous leukemia cells. Mol Cancer Ther. 2014;13:1142‐1154. [DOI] [PubMed] [Google Scholar]
- 33. Panagis F. Selective inhibition of BET bromodomains. Nature. 2010;468:1067‐1073. [DOI] [PMC free article] [PubMed] [Google Scholar]
- 34. Joydeep B, Nilsson LM, Somsundar Veppil M, et al. BET and HDAC inhibitors induce similar genes and biological effects and synergize to kill in Myc‐induced murine lymphoma. Proc Natl Acad Sci USA. 2014;111:2721‐2730. [DOI] [PMC free article] [PubMed] [Google Scholar]
- 35. Enßle JC, Boedicker C, Wanior M, Vogler M, Knapp S, Fulda S. Co‐targeting of BET proteins and HDACs as a novel approach to trigger apoptosis in rhabdomyosarcoma cells. Cancer Lett. 2018;428:S0304383518302994. [DOI] [PubMed] [Google Scholar]
- 36. Hölscher AS, Schulz WA, Pinkerneil M, Niegisch G, Hoffmann MJ. Combined inhibition of BET proteins and class I HDACs synergistically induces apoptosis in urothelial carcinoma cell lines. Clin Epigenetics. 2018;10:1. [DOI] [PMC free article] [PubMed] [Google Scholar]
- 37. Chou TC, Talalay P. Quantitative analysis of dose‐effect relationships: the combined effects of multiple drugs or enzyme inhibitors. Adv Enzyme Regul. 1984;22:27‐55. [DOI] [PubMed] [Google Scholar]
- 38. Hao J, Yang Z, Wang L, et al. Downregulation of BRD4 inhibits gallbladder cancer proliferation and metastasis and induces apoptosis via PI3K/AKT pathway. Int J Oncol. 2017;51:823‐831. [DOI] [PMC free article] [PubMed] [Google Scholar]
- 39. Edita A, Anatoly K, Kholodenko BN. Cross‐talk between mitogenic Ras/MAPK and survival PI3K/Akt pathways: a fine balance. Biochem Soc Trans. 2012;40:139. [DOI] [PubMed] [Google Scholar]
- 40. Andrew B, Astrid R, Heather B, et al. Histone deacetylase inhibitors specifically kill nonproliferating tumour cells. Oncogene. 2004;23:6693‐6701. [DOI] [PubMed] [Google Scholar]
- 41. Hrzenjak A, Moinfar F, Kremser ML, et al. Histone deacetylase inhibitor vorinostat suppresses the growth of uterine sarcomas in vitro and in vivo. Mol Cancer. 2010;9:49. [DOI] [PMC free article] [PubMed] [Google Scholar]
- 42. Junpei Y, Motoko S, Yasunori S, et al. Histone deacetylase inhibitor (SAHA) and repression of EZH2 synergistically inhibit proliferation of gallbladder carcinoma. Cancer Sci. 2010;101:355‐362. [DOI] [PMC free article] [PubMed] [Google Scholar]
- 43. Ma Q, Zhang Y, Liang H, et al. EMP3, which is regulated by miR‐663a, suppresses gallbladder cancer progression via interference with the MAPK/ERK pathway. Cancer Lett. 2018;430:97‐108. [DOI] [PubMed] [Google Scholar]
- 44. Abraha AM, Ketema EB. Apoptotic pathways as a therapeutic target for colorectal cancer treatment. World J Gastrointest Oncol. 2016;8:583. [DOI] [PMC free article] [PubMed] [Google Scholar]
- 45. Matthews GM, Newbold A, Johnstone RW. Chapter Five – Intrinsic and extrinsic apoptotic pathway signaling as determinants of histone deacetylase inhibitor antitumor activity. Adv Cancer Res. 2012;116:165‐197. [DOI] [PubMed] [Google Scholar]
- 46. Andrzej S, Przemyslaw B, Michal S. DNA structure and integrity checkpoints during the cell cycle and their role in drug targeting and sensitivity of tumor cells to anticancer treatment. Chem Rev. 2009;109:2951. [DOI] [PubMed] [Google Scholar]
- 47. Shapiro GI, Harper JW. Anticancer drug targets: cell cycle and checkpoint control. J Clin Invest. 2000;104:1645‐1653. [DOI] [PMC free article] [PubMed] [Google Scholar]


