

Abstract
Aims
We investigated whether addition of diastolic dysfunction (DD) and longitudinal strain (LS) to Stage B heart failure (SBHF) criteria (structural or systolic abnormality) improves prediction of symptomatic HF in participants of the SCReening Evaluation of the Evolution of New Heart Failure study, a self‐selected population at increased cardiovascular disease risk recruited from members of a health insurance fund in Melbourne and Shepparton, Australia. Both American Society of Echocardiography and European Association of Cardiovascular Imaging (ASE/EACVI) criteria and age‐specific Atherosclerosis Risk in Communities (ARIC) study criteria, for SBHF and DD, and ARIC criteria for abnormal LS, were examined.
Methods and results
Inclusion criteria were age ≥60 years with one or more of self‐reported ischaemic or other heart disease, irregular or rapid heart rhythm, cerebrovascular disease, renal impairment, or treatment for hypertension or diabetes for ≥2 years. Exclusion criteria were known HF, or ejection fraction <50% or >mild valve abnormality detected on previous echocardiography or other imaging. Echocardiography was performed in 3190 participants who were followed for a median of 3.9 (interquartile range: 3.4, 4.5) years after echocardiography. Symptomatic HF was diagnosed in 139 participants at a median of 3.1 (interquartile range: 2.1, 3.9) years after echocardiography. ARIC structural, systolic, and diastolic abnormalities predicted HF in univariate and multivariable proportional hazards analyses, whereas ASE/EACVI structural and systolic, but not diastolic, abnormalities predicted HF. ARIC and ASE/EACVI SBHF criteria predicted HF with sensitivities of 81% and 55%, specificities of 39% and 76%, and C statistics of 0.60 (95% confidence interval: 0.57, 0.64) and 0.66 (0.61, 0.71), respectively. Adding ARIC DD to SBHF increased sensitivity to 94% with specificity of 24% and C statistic of 0.59 (0.57, 0.61), whereas addition of ASE/EACVI DD to SBHF increased sensitivity to 97% but reduced specificity to 9% and the C statistic to 0.52 (0.50, 0.54, P < 0.0001). Addition of LS to ARIC or ASE/EACVI SBHF criteria had minimal impact on prediction of HF.
Conclusions
Age‐specific ARIC DD criteria, but not ASE/EACVI DD criteria, predicted symptomatic HF, and addition of age‐specific ARIC DD criteria to ARIC SBHF criteria improved prediction of symptomatic HF in asymptomatic individuals with cardiovascular disease risk factors. Addition of LS to ASE/EACVI or ARIC SBHF criteria did not improve prediction of symptomatic HF.
Keywords: Heart failure, Stage B, Echocardiography, Diastolic dysfunction, Longitudinal strain
Introduction
Heart failure (HF) is a complex and progressive clinical syndrome that results from any structural or functional impairment of ventricular filling or ejection of blood,1 with a lifetime risk of 20% to 46%.2 HF may result from disorders of the pericardium, myocardium, endocardium, heart valves, or great vessels, or metabolic abnormalities, but most patients with HF have symptoms due to impaired left ventricular (LV) structure or function.1 The American College of Cardiology Foundation and American Heart Association guideline describes four stages of HF, Stages A and B that are asymptomatic and Stages C and D that are symptomatic.1 Stage A HF refers to asymptomatic individuals with cardiovascular disease (CVD) risk factors but without structural heart disease, whereas Stage B HF (SBHF) refers to asymptomatic individuals with structural heart disease, which may include any of LV dilatation, LV hypertrophy (LVH), reduced LV ejection fraction (LVEF), wall motion abnormalities (WMAs), and moderate or greater aortic or mitral stenosis or regurgitation.3, 4 SBHF predicts symptomatic HF,3, 4 and its recognition offers an opportunity to use cardioprotective medication and/or lifestyle modification to prevent or retard its progression to symptomatic HF. There has been discussion about how best to define SBHF with respect to cut‐offs for LV dimensions, LVH, and LVEF, and whether inclusion of diastolic dysfunction (DD) and longitudinal strain (LS) as part of SBHF criteria improves the prediction of symptomatic HF.3, 4, 5, 6
Age‐related changes in cardiac structure and function are well recognized, including smaller LV size, greater LVEF, and lower early diastolic mitral annular tissue Doppler velocities (TDI e′).7, 8 The American Society of Echocardiography and European Association of Cardiovascular Imaging (ASE/EACVI) guideline describes normal ranges based on populations with mean ages ranging from 37 to 50 years,7 whereas the Atherosclerosis Risk in Communities (ARIC) study defined 95th percentile limits derived from the ARIC study healthy subgroup aged 67–91 years. In comparison with the ASE/EACVI guidelines, ARIC cut points are higher for LVEF, lower for LV end diastolic volume indexed to body surface area (LVEDV/BSA), LV mass (LVM) indexed to height2.7 and TDI septal e′, and similar for the peak early diastolic mitral flow E/e′ ratio and left atrial volume (LAV) indexed to BSA.3, 7, 9, 10 In the present study, we compared the prevalence of SBHF in a community‐based cohort of individuals aged ≥60 years with CVD risk factors using ASE/EACVI and ARIC criteria and investigated whether addition of DD and LS to SBHF criteria improved the prediction of symptomatic HF. We hypothesized that addition of DD and LS to SBHF criteria improves the prediction of symptomatic HF.
Methods
Study population
The SCReening Evaluation of the Evolution of New Heart Failure (SCREEN‐HF) study was a community‐based evaluation of the use of serum amino‐terminal pro‐B‐type natriuretic peptide to identify individuals with cardiac dysfunction (as assessed by echocardiography) and increased risk of HF and other CVD events. The study has been described elsewhere,11, 12, 13 and participant recruitment and baseline assessment are described in the Supporting Information. A flow chart for participant recruitment and follow‐up is shown in Supporting Information, Figure S1 . The SCREEN‐HF study was approved by the Alfred Human Research Ethics Committee, conformed to the ethical standards of the Declaration of Helsinki, and written informed consent was obtained from all participants. The study was registered at ClinicalTrials.gov NCT00400257, NCT00604006, and NCT01581827.
Follow‐up
Participants were examined for signs of HF during Visits 2 and 3. Details of symptoms, interim clinical events, and medication were collected at each visit and also by telephone interview (Supporting Information, Figure S1 ). In order to capture all incident cases of HF, a participant was referred to their cardiologist or to a SCREEN‐HF study cardiologist if he or she reported symptoms consistent with HF or if signs consistent with HF were detected during a study visit, and information was requested from the participant's primary care provider, physician, and cardiologist. All participant files were reviewed by a cardiovascular physician, and documentation of all deaths and other events was requested from hospitals and the participant's primary care provider, physician, and cardiologist. All diagnoses of HF and suspicion of HF were submitted to adjudication by two HF specialists according to European Society of Cardiology criteria of 2012.14 When one adjudicator made a diagnosis of HF and the other did not, a third HF specialist adjudicated on the presence or absence of HF. We excluded 23 participants who developed HF before the echocardiography visit.
Echocardiographic assessment
Cardiac structure and function were assessed using transthoracic echocardiography with either a Vivid 7 (n = 2929) or Vivid i (n = 261) instrument (GE Healthcare, Chicago, Illinois, USA). Echocardiography was performed according to ASE/EACVI guidelines.7, 9, 10, 15 Data were stored in raw data format and analysed offline by two experienced cardiologists. Interobserver intraclass correlation coefficients (ICCs) for M‐mode measurements were >0.78 for wall thickness, >0.88 for LA diameter, and >0.9 for other M‐mode measurements, ≥0.87 for two‐dimensional measurements, >0.85 for standard Doppler measurements except pulmonary vein A wave velocity, and >0.92 for tissue Doppler measurements. Intraobserver ICCs were generally higher than for interobserver ICCs. Pulmonary vein A wave velocity and duration are not reported because interobserver and intraobserver ICCs were <0.6.
Left ventricular dimensions were estimated using the two‐dimensional‐guided M‐mode approach.7 LVM was calculated using the two‐dimensional area–length method when endocardial definition and alignment in the parasternal short‐axis view were satisfactory and also with the linear method.7 LVM from either method was indexed to BSA and, for LVM estimated by the linear method, was also indexed to height2.7.9 LVEF was calculated using the modified Simpson's biplane method. Where endocardial definition was poor in both four‐chamber and two‐chamber views, the LVEF was visually estimated, and LV volumes were not calculated. LV regional WMA was identified based on the presence of hypokinesis, akinesis, or dyskinesis of two or more contiguous segments of the LV.
Measures of diastolic function were estimated according to the 2016 ASE/EACVI guideline.10 LAV was calculated using the biplane method of disks from LA areas measured in the apical four‐chamber and two‐chamber views in the frame prior to mitral valve opening.7 LV inflow was obtained using pulsed wave Doppler in the apical four‐chamber view; peak early (E) and late (A) diastolic velocities, deceleration time, and E/A ratio were obtained. Peak early diastolic medial and lateral mitral annular e′ were measured from pulsed TDI and E/e′ obtained. Mitral and aortic valve function was assessed and graded according to American College of Cardiology Foundation guidelines.16 The right ventricle was assessed according to ASE guidelines.9, 17
Longitudinal strain was assessed using speckle‐tracking and EchoPac software (GE Healthcare) when the frame rate was ≥30 frames per cardiac cycle.18 The endocardial border of the left ventricle was traced in the apical four‐chamber and two‐chamber views at end‐systole where the region of interest was automatically defined and the integrity of the speckle tracking was visually assessed and manually corrected if required. Peak systolic strain in the two views was averaged to obtain LS. LS was not measured if more than two segments in either the four‐chamber or two‐chamber view could not be tracked. In the setting of a rhythm other than sinus rhythm, LS measurement was performed using 5 cycles and averaged. LS is not reported for participants with left bundle branch block or paced rhythm.
Definitions of Stage B heart failure
ASE/EACVI SBHF criteria were at least one of LVEF <52% (men) or <54% (women); WMA; LVEDV/BSA >74 mL/m2 (men) and >61 mL/m2 (women); LVM/BSA >115 g/m2 (men) or >95 g/m2 (women), linear method, or >102 g/m2 (men) or >88 g/m2 (women), area–length method; and moderate or greater stenosis or regurgitation of the aortic or mitral valve.7 We examined the effect of addition of ASE/EACVI DD criteria to this definition: at least one of septal e′ <7 cm/s; lateral e′ <10 cm/s; septal E/e′ ratio >15; lateral E/e′ ratio >13; average E/e′ ratio >14; and LAV/BSA >34 mL/m2.10
ARIC SBHF criteria were at least one of LVEF <59% (men) or <57.4% (women); WMA; LVEDV/BSA >60.2 mL/m2 (men) or >51.9 mL/m2 (women); LVM/height2.7 >45 g/m2.7 (men) or >41.5 g/m2.7 (women), linear method; and moderate or greater stenosis or regurgitation of the aortic or mitral valve.3 We examined the effect of addition of ARIC DD criteria to this definition: at least one of septal e′ <4.3 cm/s (men) or <4.1 cm/s (women); septal E/e′ ratio >14.8 (men) or >17.4 (women); and LAV/BSA >34.2 mL/m2 (men) or >32.4 mL/m2 (women).3
We also examined the effect of addition of LS to ASE/EACVI and ARIC SBHF criteria, using ARIC cut points (>−14.7% in men and >−15.2% in women) and a cut point of >−18%.5
Statistical analysis
Continuous variables are presented as median (interquartile range). Categorical variables are presented as percentages. Differences between groups were tested with Mann–Whitney U test for continuous variables and χ2 tests for categorical variables, and statistical significance was interpreted as a two‐tailed P value <0.05. Hazard ratios were calculated using a semiparametric proportional hazards model for the subdistribution of the competing risk of death,19 and follow‐up was restricted to 4 years (106 cases) to ensure proportional hazards assumptions were met. Receiver operating characteristic (ROC) C statistics were estimated from time‐dependent ROC curves for censored event times with the competing risk of death.20 Analyses were conducted using Statview 5.0.1 (SAS Institute, Cary, NC, USA) and R.
Results
Baseline clinical characteristics
The baseline characteristics of participants who attended and those who did not attend for echocardiography are shown in Supporting Information, Table S1 . At the time of echocardiography, participants who attended for echocardiography had a median age of 71 (interquartile range: 67, 77) years, 55% were male, 89% of men and 94% of women had hypertension, 20% of men and 15% of women had diabetes, 34% of men and 37% of women were obese (body mass index ≥30 kg/m2), 49% of men and 39% of women were overweight (25 < body mass index < 30 kg/m2), 19% of men and 20% of women had an estimated glomerular filtration rate <60 mL/min/1.73 m2, 14% of men and 10% of women had atrial fibrillation (AF), 15% of men and 5% of women had previous myocardial infarction, and 31% of men and 14% of women had a history of ischaemic heart disease.
Echocardiography
Measures of LV and LA structure are shown in Table 1. Approximately 3% of participants had increased LVEDV/BSA according to ASE/EACVI criteria, whereas 16% of men and 11% of women had increased LVEDV/BSA according to ARIC criteria. LVM/BSA was elevated in 16% to 29% of participants when LVM was estimated by either the area–length or linear method, according to ASE/EACVI criteria. However, the proportion with LVH was approximately two‐fold higher when LVM was indexed to height2.7, using either ASE and European Association of Echocardiography9 or ARIC criteria.3 Approximately half of participants had elevated LAV/BSA, with similar proportions according to ASE/EACVI and ARIC criteria.
Table 1.
Measures of left ventricular and left atrial structure in men and women
| Parameter | Men (n = 1762) | Women (n = 1428) | ||
|---|---|---|---|---|
| Number of measurements (%) | Value | Number of measurements (%) | Value | |
| LVEDD/BSA (mm/m2) | 1446 (82%) | 26 (24, 28) | 1223 (86%) | 27 (25, 29) |
| >Normala | >30 mm/m2 | 165 (11%) | >31 mm/m2 | 179 (15%) |
| LVEDV/BSA (mL/m2) | 1333 (76%) | 48 (42, 56) | 1036 (73%) | 41 (35, 47) |
| >Normala | >74 mL/m2 | 43 (3.2%) | >61 mL/m2 | 25 (2.4%) |
| >Normalb | >60.2 mL/m2 | 216 (16%) | >51.9 mL/m2 | 114 (11%) |
| LVMAL/BSA (g/m2) | 927 (62%) | 88 (80, 97) | 856 (68%) | 77 (70, 86) |
| >Normala | >102 g/m2 | 147 (16%) | >88 g/m2 | 173 (20%) |
| LVMLIN/BSA (g/m2) | 1439 (82%) | 95 (80, 110) | 1213 (85%) | 83 (71, 99) |
| >Normala | >115 g/m2 | 291 (20%) | >95 g/m2 | 354 (29%) |
| LVMLIN/height2.7 (g/m2.7) | 1439 (82%) | 43 (36, 51) | 1213 (85%) | 42 (35, 51) |
| >Normalc | >48 (g/m2.7) | 485 (34%) | >44 (g/m2.7) | 520 (43%) |
| >Normalb | >45 (g/m2.7) | 613 (43%) | >41.5 (g/m2.7) | 628 (52%) |
| LAV/BSA (mL/m2) | 1682 (95%) | 34 (28, 41) | 1362 (95%) | 32 (26, 39) |
| >Normala | >34.0 mL/m2 | 848 (50%) | >34.0 mL/m2 | 574 (42%) |
| >Normalb | >34.2 mL/m2 | 833 (50%) | >32.4 mL/m2 | 657 (48%) |
BSA, body surface area; LAV, left atrial volume; LVEDD, left ventricular end diastolic diameter; LVEDV, left ventricular end diastolic volume; LVMAL, LVM determined by area–length method; LVMLIN, LVM determined by the linear method.
Summary statistics are median (interquartile range) or n (%).
American Society of Echocardiography and European Association of Cardiovascular Imaging guidelines.7
Atherosclerosis Risk in Communities study 95th percentile limit.3
American Society of Echocardiography and European Association of Echocardiography guidelines.9
Measures of systolic function and valve abnormality are shown in Table 2. LVEF was reduced in 10.2% of men and 6.3% of women, according to ASE/EACVI criteria, and in 46% of men and 24% of women (36% of men and women), according to ARIC criteria. LS was measured in only 1401 participants (Table 2), who resembled the whole cohort in that 492 (35%) had reduced LVEF according to ARIC criteria. Among those with LS measurement, abnormal LS was present in 6% of men and 3% of women according to the ARIC criteria. LS was abnormal in only 1.8% of men and 1.3% of women with normal LVEF according to ASE/EACVI criteria who had LS measurement. These proportions were reduced to 0.5% of men and women when ARIC criteria were used to define normal LVEF.
Table 2.
Measures of left ventricular systolic function and valve abnormality in men and women
| Parameter | Men (n = 1762) | Women (n = 1428) | ||
|---|---|---|---|---|
| Number of measurements (%) | Value | Number of measurements (%) | Value | |
| Systolic function | ||||
| LVEF (%) | 1760 (99.9%) | 60 (55, 62) | 1427 (99.9%) | 60 (58, 63) |
| <Normala | <52% | 180 (10.2%) | <54% | 90 (6.3%) |
| <Normalb | <59% | 805 (46%) | <57.4% | 338 (24%) |
| LVEF <40% | 25 (1.4%) | 2 (0.1%) | ||
| WMA | 145 (8.2%) | 32 (2.2%) | ||
| LS (%) | 792 (45%) | −19.3 (−17.9, −20.8) | 609 (43%) | −20.1 (−18.8, −21.7) |
| Abnormal LSb | >−14.7% | 48 (6%) | >−15.2% | 17 (3%) |
| Aortic stenosis | >mild | 8 (0.5%) | >mild | 3 (0.2%) |
| Aortic regurgitation | >mild | 6 (0.3%) | >mild | 7 (0.5%) |
| Mitral stenosis | >mild | 0 (0%) | >mild | 0 (0%) |
| Mitral regurgitation | >mild | 19 (1.1%) | >mild | 12 (0.8%) |
| Tricuspid regurgitation | >mild | 23 (1.3%) | >mild | 29 (2.0%) |
| Pulmonary regurgitation | >mild | 7 (0.4%) | >mild | 10 (0.7%) |
| Aortic or mitral valve disease | >mild | 33 (1.9%) | >mild | 22 (1.5%) |
LS, longitudinal strain; LVEF, left ventricular ejection fraction; WMA, wall motion abnormality.
Summary statistics are median (interquartile range) or n (%).
American Society of Echocardiography and European Association of Cardiovascular Imaging guidelines.7
Atherosclerosis Risk in Communities study 95th percentile limit.3
Measures of diastolic LV function, and right ventricular function, are shown in Table 3. The higher e′ cut point of the ASE/EACVI criteria caused more than half of participants to have reduced septal or lateral e′, whereas only 6% of men and 5.9% of women had reduced septal e′ according to ARIC criteria. However, similar proportions of participants had elevated septal E/e′ ratio (6% to 15%) according to ASE/EACVI and ARIC criteria.
Table 3.
Measures of left ventricular diastolic function, and right ventricular function, in men and women
| Parameter | Men (n = 1762) | Women (n = 1428) | ||
|---|---|---|---|---|
| Number of measurements (%) | Value | Number of measurements (%) | Value | |
| Diastolic function (mitral valve Doppler and TDI measurements) | ||||
| E/A ratio | 1599 (91%) | 0.89 (0.74, 1.08) | 1343 (94%) | 0.87 (0.73, 1.05) |
| Reduced E/A ratioa | ≤0.8 | 550 (34%) | ≤0.8 | 491 (37%) |
| Increased E/A ratioa | ≥2 | 11 (0.7%) | ≥2 | 13 (1.0%) |
| Septal e′ (cm/s) | 1598 (91%) | 6.5 (5.5, 7.6) | 1331 (93%) | 6.3 (5.2, 7.4) |
| Reduced septal e′a | <7 cm/s | 972 (61%) | <7 cm/s | 875 (66%) |
| Reduced septal e′b | <4.3 cm/s | 96 (6.0%) | <4.1 cm/s | 78 (5.9%) |
| Lateral e′ (cm/s) | 1590 (90%) | 8.5 (7.0, 10.0) | 1332 (93%) | 7.9 (6.6, 9.3) |
| Reduced lateral e′a | <10 cm/s | 1184 (74%) | <10 cm/s | 1119 (85%) |
| Septal E/e′ ratio | 1565 (89%) | 9.5 (7.9, 11.8) | 1310 (92%) | 10.9 (9.0, 13.3) |
| >Normal septal E/e′ ratioa | >15 | 119 (7.6%) | >15 | 192 (15%) |
| >Normal septal E/e′ ratiob | >14.8 | 130 (8.3%) | >17.4 | 84 (6.4%) |
| Lateral E/e′ ratio | 1556 (88%) | 7.4 (5.9, 9.2) | 1301 (91%) | 8.6 (7.1, 10.8) |
| >Normal septal E/e′ ratioa | >13 | 87 (5.6%) | >13 | 140 (11%) |
| Average E/e′ ratio | 1548 (88%) | 8.6 (7.1, 10.4) | 1294 (91%) | 9.8 (8.3, 12.0) |
| Increased average E/e′ ratioa | >14 | 85 (5.5%) | >14 | 147 (11.3%) |
| PV S/D ratio | 1496 (85%) | 1.4 (1.2, 1.7) | 1211 (85%) | 1.5 (1.3, 1.7) |
| Reduced S/D ratioa | <1 | 151 (10%) | <1 | 95 (8%) |
| Right ventricle | ||||
| RV dilatation | 42 (2.4%) | 20 (1.4%) | ||
| RV dysfunction | 39 (2.2%) | 6 (0.4%) | ||
| RVSP (mmHg) | 691 (39%) | 27 (24, 31) | 670 (47%) | 26 (23, 31) |
| Increased RVSPc | >36 mmHg | 73 (10.6%) | >36 mmHg | 61 (9.1%) |
| TR max velocity (m/s) | 725 (41%) | 2.4 (2.3, 2.6) | 708 (50%) | 2.4 (2.2, 2.6) |
| Increased TR velocitya | >2.8 m/s | 74 (10%) | >2.8 m/s | 72 (10%) |
A velocity, peak mitral inflow during atrial contraction; E velocity, peak mitral inflow in early diastole; e′, peak mitral annular velocity in early diastole; PV S/D ratio, ratio of systolic and diastolic velocities in the pulmonary vein; RV, right ventricle; RVSP, RV systolic pressure; TDI, tissue Doppler imaging; TR, tricuspid regurgitation.
Summary statistics are median (interquartile range) or n (%).
American Society of Echocardiography and European Association of Cardiovascular Imaging guidelines for the evaluation of diastolic function.10
Atherosclerosis Risk in Communities study 95th percentile limit.3
Structural, systolic, and diastolic abnormalities and incident symptomatic heart failure
The 3190 participants were followed for a median of 3.9 (interquartile range: 3.4, 4.5) years, and symptomatic HF was diagnosed in 139 participants at a median of 3.1 (interquartile range: 2.1, 3.9) years after echocardiography, representing an incidence rate of 11.2 per 1000 person years. Symptomatic HF was diagnosed in 83 participants in the ambulant setting and in 56 participants on hospitalization; 35 diagnosed in the ambulant setting were subsequently hospitalized with HF.
The distributions of structural, systolic, and diastolic abnormalities according to ASE/EACVI and ARIC criteria are shown in Figure 1 . Higher numbers of participants had structural abnormality according to ARIC (n = 1390) than ASE/EACVI criteria (n = 584), reflecting the higher prevalence of LVH when LVM was indexed to height2.7 (Table 1). Moreover, higher numbers of participants had systolic abnormality according to ARIC (n = 1167) than ASE/EACVI criteria (n = 329), reflecting the higher LVEF cut points for ARIC than ASE/EACVI criteria (Table 2). By contrast, more participants had diastolic abnormality according to ASE/EACVI (n = 2848) than ARIC criteria (n = 1619), largely reflecting the higher e′ cut points for ASE/EACVI than ARIC criteria (Table 3).
Figure 1.

Venn diagram demonstrating the numbers of SCREEN‐HF participants (men and women) with structural, systolic, and diastolic abnormalities, according to the ASE/EACVI and ARIC guidelines, and the number (%) in each category who subsequently developed heart failure (HF). BSA, body surface area; LAV, left atrial volume; LVEDV, LV end diastolic volume; LVEF, left ventricular ejection fraction; LVM, left ventricular mass; WMA, wall motion abnormality.
ARIC structural, systolic, and diastolic abnormalities predicted HF in univariate and multivariable proportional hazards analyses, whereas ASE/EACVI structural and systolic, but not diastolic, abnormalities predicted HF (Table 4). ROC curve analysis confirmed the results of Cox regression analysis, with statistically significant C statistics for ARIC criteria for structural, systolic, and diastolic abnormalities, but only for ASE/EACVI structural and systolic, and not diastolic, abnormalities (Figure 2 ).
Table 4.
Cox regression: univariate and multivariable subdistribution hazard ratios
| Parameter | Univariate hazard ratios | Multivariable hazard ratios | ||
|---|---|---|---|---|
| (95% CI) | P values | (95% CI) | P values | |
| ASE/EACVI criteria | ||||
| Age (per decade) | 2.68 (2.03, 3.54) | <0.0001 | 2.33 (1.68, 3.24) | <0.0001 |
| Male gender | 1.37 (0.96, 1.95) | 0.085 | ||
| Structural abnormality | 3.27 (2.17, 4.93) | <0.0001 | 2.19 (1.42, 3.27) | 0.0004 |
| Systolic abnormality | 5.58 (3.77, 8.27) | <0.0001 | 3.82 (2.43, 6.01) | <0.0001 |
| Diastolic abnormality | 1.48 (0.69, 3.19) | 0.31 | ||
| ARIC criteria | ||||
| Age (per decade) | 2.68 (2.03, 3.54) | <0.0001 | 2.23 (1.62, 3.05) | <0.0001 |
| Male gender | 1.37 (0.96, 1.95) | 0.085 | ||
| Structural abnormality | 3.16 (2.00, 4.99) | <0.0001 | 2.40 (1.50, 3.83) | 0.0003 |
| Systolic abnormality | 2.48 (1.68, 3.64) | <0.0001 | 1.81 (1.19, 2.74) | 0.0056 |
| Diastolic abnormality | 5.35 (3.14, 9.12) | <0.0001 | 3.47 (1.94, 6.21) | <0.0001 |
ARIC, Atherosclerosis Risk in Communities; ASE/EACVI, American Society of Echocardiography and European Association of Cardiovascular Imaging; CI, confidence interval.
Figure 2.
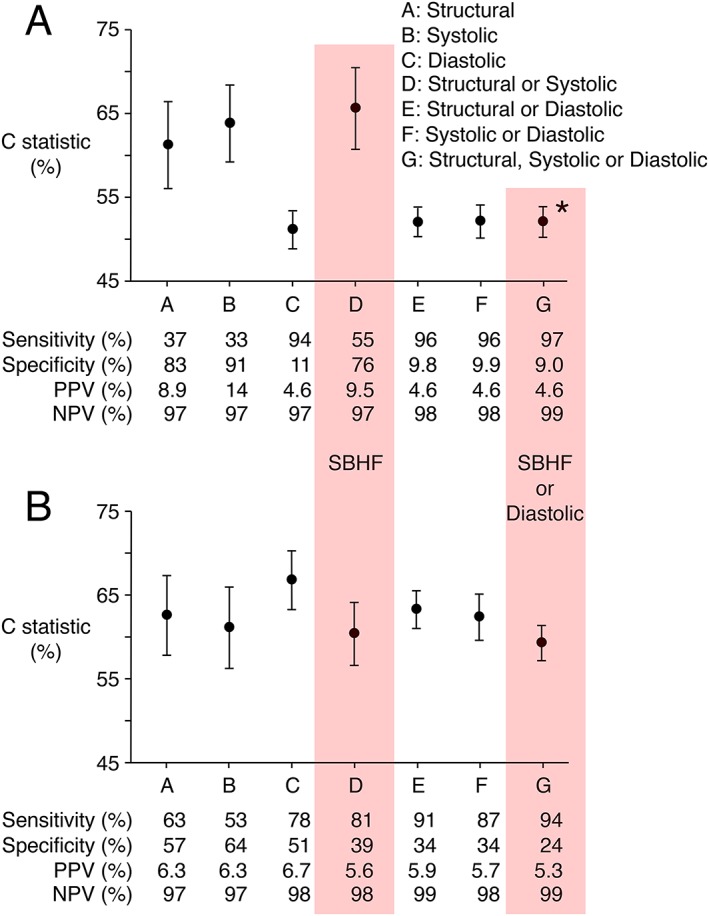
C statistics, sensitivities, specificities, positive (PPV) and negative (NPV) predictive values for the prediction of symptomatic HF by structural, systolic, and diastolic abnormalities, and their combination, according to ASE/EACVI (Panel A) and ARIC criteria (Panel B). C statistics were calculated from the receiver operating characteristic curve for 4 years follow‐up after echocardiography, adjusted for competing risk of death.20 Sensitivity, specificity, PPV, and NPV were calculated for complete follow‐up. * P < 0.0001 in comparison with ASE/EACVI SBHF criteria (Panel A) and in comparison with combined SBHF and DD according to ARIC criteria (Panel B). The C statistic for combined ARIC SBHF and DD criteria was not statistically significantly different from that for ARIC SBHF alone.
Stage B heart failure and incident symptomatic heart failure
Given the higher prevalence of structural and systolic abnormalities for ARIC criteria, 2.5‐fold more participants had ARIC SBHF (n = 1988) than ASE/EACVI SBHF (n = 804). The C statistics for ARIC SBHF [0.60, 95% confidence interval (CI): 0.57, 0.64] and ASE/EACVI SBHF (0.66, 95% CI: 0.61, 0.71) were not significantly different (P = 0.07 at 4 years), although ARIC SBHF criteria achieved 81% sensitivity for prediction of incident symptomatic HF, in comparison with 55% for ASE/EACVI SBHF criteria, at the expense of lower specificity (Figure 2 ).
Addition of diastolic dysfunction to Stage B heart failure criteria
Nearly twice as many participants had DD according to the ASE/EACVI (n = 2848) than the ARIC criteria (n = 1619), and addition of DD to SBHF criteria increased the total number with any structural, systolic, or diastolic abnormality to 2913 (91% of participants) according to ASE/EACVI criteria and 2462 (77% of participants) according to ARIC criteria (Figure 1 ). Addition of ASE/EACVI DD to ASE/EACVI SBHF criteria increased the sensitivity of prediction of symptomatic HF to 97%, at the expense of reduced specificity (9%), and reduction in the C statistic to 0.52 (95% CI: 0.50, 0.54, P < 0.0001 in comparison with ASE/EACVI SBHF criteria), whereas addition of ARIC DD to ARIC SBHF criteria increased sensitivity to 94%, without change in the C statistic (0.59, 95% CI: 0.57, 0.61), which was higher than for combined ASE/EACVI SBHF and DD criteria (P < 0.0001, Figure 2 ).
Addition of longitudinal strain to Stage B heart failure criteria
Of the 1401 participants with LS measurement, 45 developed symptomatic HF and 373 were classified as SBHF by ASE/EACVI criteria, which included 26 (58%) of the 45 participants who developed HF. This sensitivity of 58% was similar to the sensitivity of 55% for ASE/EACVI SBHF criteria applied to the whole cohort (Figure 2 ). Addition of ARIC LS criteria (>−14.7% for men, >−15.2% for women) to ASE/EACVI SBHF criteria increased the number with abnormality to 386 but did not identify additional participants who developed symptomatic HF. Addition of LS >−18% to ASE/EACVI SBHF criteria increased the number with abnormality to 522 and identified an additional six participants who developed symptomatic HF, bringing the number to 32 (sensitivity 71%).
ARIC criteria classified 723 of the 1401 participants with LS measurement as SBHF. Participants with ARIC SBHF included 35 of the 45 with LS measurement who developed symptomatic HF (sensitivity 78%), similar to the sensitivity of 81% for ARIC SBHF criteria applied to the whole cohort (Figure 2 ). Addition of ARIC LS criteria (>−14.7% for men, >−15.2% for women) to ARIC SBHF criteria increased the number with abnormality to 897 but did not identify additional participants who developed symptomatic HF. Addition of LS >−18% to ARIC SBHF criteria increased the number with abnormality to 938 and identified one additional participant who developed HF, bringing the number to 36 (sensitivity 80%).
Discussion
Both the ASE/EACVI and ARIC criteria identified a high prevalence of echocardiographic abnormalities in this community‐based Australian cohort ≥60 years of age with CVD risk factors, and both ASE/EACVI and ARIC SBHF criteria (cardiac structural or systolic abnormalities) predicted symptomatic HF. In contrast to previous studies that examined the prediction of a composite of HF hospitalization or death,3 or a composite of new onset HF and cardiovascular death,5 we examined the prediction of incident symptomatic HF using models adjusted for the competing risk of death,19, 20 and most cases of incident HF were diagnosed in the ambulant setting. We also showed that the addition of DD, but not LS, to SBHF criteria improved the prediction of symptomatic HF according to ARIC criteria, but not according to ASE/EACVI criteria.
The different performance of ASE/EACVI and ARIC SBHF criteria in predicting symptomatic HF in SCREEN‐HF participants may have been due in part to the different ages of the populations from which these criteria were derived. The age of our cohort (median 71 years) more closely resembled that of the ARIC study (median 75 years),3 whereas the ASE/EACVI guideline cut points were determined in younger populations.7 We were unable to define cut points for the SCREEN‐HF cohort because none were free of CVD risk factors.
Our finding that ARIC criteria for LVH, based on LVM/height2.7, identified more than twice as many SCREEN‐HF participants with structural abnormality than ASE/EACVI criteria for LVH based on LVM/BSA was in agreement with previous studies demonstrating that normalization of LVM to BSA underestimates LVH prevalence in obese and overweight hypertensive subjects, who comprised the majority of SCREEN‐HF participants.21, 22, 23, 24 In addition, ARIC criteria identified 3.5‐fold more SCREEN‐HF participants with systolic dysfunction than ASE/EACVI criteria, due to the higher LVEF cut points for ARIC criteria. Consequently, ARIC criteria classified 2.5‐fold more SCREEN‐HF participants as SBHF than ASE/EACVI criteria, thereby achieving higher sensitivity for the prediction of symptomatic HF while maintaining similar C indices.
The identification of nearly twice as many SCREEN‐HF participants with DD according to ASE/EACVI than ARIC criteria was largely due to the lower e′ cut points of the ARIC criteria. Our findings support the conclusion of Shah et al. that e′ values below the ASE/EACVI cut points, but above the ARIC cut points, are largely prognostically benign25 and support the use of the age‐specific ARIC cut points for e′.
Some authors have used alternative definitions of SBHF. For example, Yang et al. defined SBHF as at least one of LVM/BSA >115 g/m2 for men or >95 g/m2 for women, LAV/BSA >34 mL/m2, average E/e′ >13, and LS >−18%.5 Wang et al. used a similar definition except that the LS cut point was >−16%.6 Neither definition included LVEF.5, 6 Yang et al. reported a sensitivity of 82% and specificity of 41% for the prediction of symptomatic HF by their SBHF algorithm in asymptomatic patients ≥65 years of age with at least one HF risk factor,5 which is comparable with the 81% sensitivity and 39% specificity we obtained in the SCREEN‐HF cohort for ARIC SBHF criteria alone. There were, however, differences in study design and event rates between the study of Yang et al. and the SCREEN‐HF study. Unlike Yang et al., we did not exclude any participant because of poor images, AF, or known coronary artery disease. Moreover, despite these exclusions, Yang et al. reported an HF incidence rate of ~100 per 1000 person years, which was ~nine‐fold higher than we observed in the SCREEN‐HF cohort.5
In contrast to the studies of Yang et al. and Wang et al.,5, 6 we found that LS made little contribution to the prediction of symptomatic HF when added to either ASE/EACVI or ARIC SBHF criteria. The importance of this observation is that LVEF is an established echocardiographic parameter that can be measured in almost all patients, whereas reliable LS measurement may not be possible in the same high proportion of echocardiographic examinations. Moreover, use of an LS cut point is problematic because echocardiographic equipment from different manufacturers has different normal values and there is no consensus about the cut points that define abnormal LS.7
Strengths and limitations of the study
The strengths of our study include the diagnosis of HF in a predominantly ambulant setting and the long duration of observation before HF diagnosis. Our outcome data were for HF, and not a composite of HF and death, as used in previous studies.3, 25 We enrolled a cohort ≥60 years of age with CVD risk factors in order to achieve sufficient events during follow‐up. However, we excluded individuals known at baseline to have LVEF <50% or significant valve abnormality because such individuals have well‐recognized HF risk, and our aim was to identify otherwise unrecognized HF risk in a community cohort. The inclusion criteria with respect to age and CVD risk factors, and the SCREEN‐HF cohort comprising volunteers who were predominantly members of a health fund, may be cause for caution in the generalization of our findings to the general community. However, the SCREEN‐HF cohort was not that dissimilar to the general Australian population aged ≥60 years; of Australians aged 65–74 years, 70% have hypertension,26 17% have diabetes,27 38.2% of men and 32.7% of women are obese,28 5% have AF,29 and 53% have CVD,30 and our findings are therefore likely to be applicable to the general community.
Conclusions and implications
Both the ASE/EACVI and ARIC criteria demonstrated a high prevalence of echocardiographic abnormalities in an Australian cohort ≥60 years of age with CVD risk factors, and SBHF criteria (cardiac structural or systolic abnormalities) predicted symptomatic HF. Age‐specific ARIC DD criteria, but not ASE/EACVI DD criteria, predicted symptomatic HF, and addition of age‐specific ARIC DD criteria to ARIC SBHF criteria improved prediction of symptomatic HF in asymptomatic individuals with CVD risk factors. Addition of LS to ASE/EACVI or ARIC SBHF criteria did not improve prediction of symptomatic HF.
Conflict of interest
Bupa Australia was involved in study design, recruitment of participants, and funding but was not involved in data collection, analysis or interpretation, or writing of the article. Bupa Australia had no control or influence over the decision to submit the final manuscript for publication.
J.M.Ca. has received payments from Pfizer, Servier, Bayer, and Alphapharm for lectures. U.B. was an employee of Bupa Australia. D.L. has received honoraria from Pfizer, Sanofi, Astra‐Zeneca, Abbott, Bayer, MSD, GSK, Novartis, and Nycomed. S.S. has received unrestricted educational grants from Schering Plough and Boehringer Ingelheim and was Principal Investigator of the Novartis sponsored Valsartan Intensified Primary Care Reduction of Blood Pressure (VIPER‐BP) study. H.K. received support from Novartis, Bristol‐Myers Squibb, and Ardian/Medtronic. D.L.P. has received payment from Servier for sitting on their advisory board and from Boehringer Ingelheim, CSL, Merck Sharp & Dohme, and Sanofi Aventis for lectures. D.J.C. has received payments from the Australasian Renin Academy for lectures.
Funding
This work was supported by Bupa Australia, with subsequent support from the National Health and Medical Research Council of Australia (GTN0559010, GTN1044619, GTN1092642, GTN0395508 to D.J.C., GTN1045862, GTN1136372 to C.M.R., GTN1041796 to S.S., GTN0620241 to J.M.Co., GNT0519456 to M.M.), the National Heart Foundation of Australia (G 07M 3198), the Diabetes Australia Research Trust (Y15G‐CAMD), The University of Melbourne, St. Vincent's Hospital Melbourne, St. Vincent's Institute of Medical Research, and the Victorian Government's Operational Infrastructure Support Program.
Supporting information
Table S1. Characteristics on enrolment (Visit 1) of SCREEN‐HF participants who subsequently attended for echocardiography and those who did not
Figure S1. Flow chart of numbers of individuals invited to participate in the SCReening Evaluation of the Evolution of New Heart Failure (SCREEN‐HF) study who were subsequently enrolled and attended Visit 1 and subsequent echocardiography (Visit 2).
Acknowledgements
We thank all SCREEN‐HF study participants and the study nurses, echocardiographers, and administrative staff for their invaluable contribution.
Coller J. M., Gong F. F., McGrady M., Jelinek M. V., Castro J. M., Boffa U., Shiel L., Liew D., Stewart S., Krum H., Reid C. M., Prior D. L., and Campbell D. J. (2019) Age‐specific diastolic dysfunction improves prediction of symptomatic heart failure by Stage B heart failure, ESC Heart Failure, 6, 747–757. 10.1002/ehf2.12449.
References
- 1. Yancy CW, Jessup M, Bozkurt B, Butler J, Casey DE Jr, Drazner MH, Fonarow GC, Geraci SA, Horwich T, Januzzi JL, Johnson MR, Kasper EK, Levy WC, Masoudi FA, McBride PE, McMurray JJ, Mitchell JE, Peterson PN, Riegel B, Sam F, Stevenson LW, Tang WH, Tsai EJ, Wilkoff BL, American College of Cardiology F , American Heart Association Task Force on Practice G . 2013 ACCF/AHA guideline for the management of heart failure: a report of the American College of Cardiology Foundation/American Heart Association Task Force on Practice Guidelines. J Am Coll Cardiol 2013; 62: e147–e239. [DOI] [PubMed] [Google Scholar]
- 2. Huffman MD, Berry JD, Ning H, Dyer AR, Garside DB, Cai X, Daviglus ML, Lloyd‐Jones DM. Lifetime risk for heart failure among white and black Americans: cardiovascular lifetime risk pooling project. J Am Coll Cardiol 2013; 61: 1510–1517. [DOI] [PMC free article] [PubMed] [Google Scholar]
- 3. Shah AM, Claggett B, Loehr LR, Chang PP, Matsushita K, Kitzman D, Konety S, Kucharska‐Newton A, Sueta CA, Mosley TH, Wright JD, Coresh J, Heiss G, Folsom AR, Solomon SD. Heart failure stages among older adults in the community: the atherosclerosis risk in communities study. Circulation 2017; 135: 224–240. [DOI] [PMC free article] [PubMed] [Google Scholar]
- 4. Gong FF, Campbell DJ, Prior DL. Noninvasive cardiac imaging and the prediction of heart failure progression in preclinical Stage A/B subjects. JACC Cardiovasc Imaging 2017; 10: 1504–1519. [DOI] [PubMed] [Google Scholar]
- 5. Yang H, Negishi K, Wang Y, Nolan M, Saito M, Marwick TH. Echocardiographic screening for non‐ischaemic stage B heart failure in the community. Eur J Heart Fail 2016; 18: 1331–1339. [DOI] [PubMed] [Google Scholar]
- 6. Wang Y, Yang H, Huynh Q, Nolan M, Negishi K, Marwick TH. Diagnosis of nonischemic Stage B heart failure in type 2 diabetes mellitus: optimal parameters for prediction of heart failure. JACC Cardiovasc Imaging 2018; 11: 1390–1400. [DOI] [PubMed] [Google Scholar]
- 7. Lang RM, Badano LP, Mor‐Avi V, Afilalo J, Armstrong A, Ernande L, Flachskampf FA, Foster E, Goldstein SA, Kuznetsova T, Lancellotti P, Muraru D, Picard MH, Rietzschel ER, Rudski L, Spencer KT, Tsang W, Voigt JU. Recommendations for cardiac chamber quantification by echocardiography in adults: an update from the American Society of Echocardiography and the European Association of Cardiovascular Imaging. J Am Soc Echocardiogr 2015; 28: 1–39, e14. [DOI] [PubMed] [Google Scholar]
- 8. Eng J, McClelland RL, Gomes AS, Hundley WG, Cheng S, Wu CO, Carr JJ, Shea S, Bluemke DA, Lima JA. Adverse left ventricular remodeling and age assessed with cardiac MR imaging: the multi‐ethnic study of atherosclerosis. Radiology 2016; 278: 714–722. [DOI] [PMC free article] [PubMed] [Google Scholar]
- 9. Lang RM, Bierig M, Devereux RB, Flachskampf FA, Foster E, Pellikka PA, Picard MH, Roman MJ, Seward J, Shanewise JS, Solomon SD, Spencer KT, Sutton MS, Stewart WJ. Recommendations for chamber quantification: a report from the American Society of Echocardiography's Guidelines and Standards Committee and the Chamber Quantification Writing Group, developed in conjunction with the European Association of Echocardiography, a branch of the European Society of Cardiology. J Am Soc Echocardiogr 2005; 18: 1440–1463. [DOI] [PubMed] [Google Scholar]
- 10. Nagueh SF, Smiseth OA, Appleton CP, Byrd BF 3rd, Dokainish H, Edvardsen T, Flachskampf FA, Gillebert TC, Klein AL, Lancellotti P, Marino P, Oh JK, Popescu BA, Waggoner AD. Recommendations for the evaluation of left ventricular diastolic function by echocardiography: an update from the American Society of Echocardiography and the European Association of Cardiovascular Imaging. J Am Soc Echocardiogr 2016; 29: 277–314. [DOI] [PubMed] [Google Scholar]
- 11. Campbell DJ, Coller JM, Gong FF, McGrady M, Prior DL, Boffa U, Shiel L, Liew D, Wolfe R, Owen AJ, Krum H, Reid CM. Risk factor management in a contemporary Australian population at increased cardiovascular disease risk. Intern Med J 2018; 48: 688–698. [DOI] [PubMed] [Google Scholar]
- 12. Gong FF, Jelinek MV, Castro JM, Coller JM, McGrady M, Boffa U, Shiel L, Liew D, Wolfe R, Stewart S, Owen AJ, Krum H, Reid CM, Prior DL, Campbell DJ. Risk factors for incident heart failure with preserved or reduced ejection fraction, and valvular heart failure, in a community‐based cohort. Open Heart 2018; 5: e000782. [DOI] [PMC free article] [PubMed] [Google Scholar]
- 13. Campbell DJ, Gong FF, Jelinek MV, Castro JM, Coller JM, McGrady M, Boffa U, Shiel L, Wang BH, Liew D, Wolfe R, Stewart S, Owen AJ, Krum H, Reid CM, Prior DL. Prediction of incident heart failure by serum amino‐terminal pro‐B‐type natriuretic peptide level in a community‐based cohort. Eur J Heart Fail 2019; 21: 449–459. [DOI] [PubMed] [Google Scholar]
- 14. McMurray JJ, Adamopoulos S, Anker SD, Auricchio A, Bohm M, Dickstein K, Falk V, Filippatos G, Fonseca C, Gomez‐Sanchez MA, Jaarsma T, Kober L, Lip GY, Maggioni AP, Parkhomenko A, Pieske BM, Popescu BA, Ronnevik PK, Rutten FH, Schwitter J, Seferovic P, Stepinska J, Trindade PT, Voors AA, Zannad F, Zeiher A. ESC Guidelines for the diagnosis and treatment of acute and chronic heart failure 2012: The Task Force for the Diagnosis and Treatment of Acute and Chronic Heart Failure 2012 of the European Society of Cardiology. Developed in collaboration with the Heart Failure Association (HFA) of the ESC. Eur Heart J 2012; 33: 1787–1847. [DOI] [PubMed] [Google Scholar]
- 15. Nagueh SF, Appleton CP, Gillebert TC, Marino PN, Oh JK, Smiseth OA, Waggoner AD, Flachskampf FA, Pellikka PA, Evangelista A. Recommendations for the evaluation of left ventricular diastolic function by echocardiography. J Am Soc Echocardiogr 2009; 22: 107–133. [DOI] [PubMed] [Google Scholar]
- 16. Bonow RO, Cheitlin MD, Crawford MH, Douglas PS. Task Force 3: valvular heart disease. J Am Coll Cardiol 2005; 45: 1334–1340. [DOI] [PubMed] [Google Scholar]
- 17. Rudski LG, Lai WW, Afilalo J, Hua L, Handschumacher MD, Chandrasekaran K, Solomon SD, Louie EK, Schiller NB. Guidelines for the echocardiographic assessment of the right heart in adults: a report from the American Society of Echocardiography endorsed by the European Association of Echocardiography, a registered branch of the European Society of Cardiology, and the Canadian Society of Echocardiography. J Am Soc Echocardiogr 2010; 23: 685–713. [DOI] [PubMed] [Google Scholar]
- 18. Rosner A, Barbosa D, Aarsaether E, Kjonas D, Schirmer H, D'Hooge J. The influence of frame rate on two‐dimensional speckle‐tracking strain measurements: a study on silico‐simulated models and images recorded in patients. Eur Heart J Cardiovasc Imaging 2015; 16: 1137–1147. [DOI] [PubMed] [Google Scholar]
- 19. Fine JP, Gray RJ. A proportional hazards model for the subdistribution of a competing risk. J Am Stat Assoc 1999; 94: 496–509. [Google Scholar]
- 20. Blanche P, Dartigues JF, Jacqmin‐Gadda H. Estimating and comparing time‐dependent areas under receiver operating characteristic curves for censored event times with competing risks. Stat Med 2013; 32: 5381–5397. [DOI] [PubMed] [Google Scholar]
- 21. de Simone G, Daniels SR, Devereux RB, Meyer RA, Roman MJ, de Divitiis O, Alderman MH. Left ventricular mass and body size in normotensive children and adults: assessment of allometric relations and impact of overweight. J Am Coll Cardiol 1992; 20: 1251–1260. [DOI] [PubMed] [Google Scholar]
- 22. Gosse P, Jullien V, Jarnier P, Lemetayer P, Clementy J. Echocardiographic definition of left ventricular hypertrophy in the hypertensive: which method of indexation of left ventricular mass? J Hum Hypertens 1999; 13: 505–509. [DOI] [PubMed] [Google Scholar]
- 23. Cuspidi C, Meani S, Negri F, Giudici V, Valerio C, Sala C, Zanchetti A, Mancia G. Indexation of left ventricular mass to body surface area and height to allometric power of 2.7: is the difference limited to obese hypertensives? J Hum Hypertens 2009; 23: 728–734. [DOI] [PubMed] [Google Scholar]
- 24. Kuznetsova T, Haddad F, Tikhonoff V, Kloch‐Badelek M, Ryabikov A, Knez J, Malyutina S, Stolarz‐Skrzypek K, Thijs L, Schnittger I, Wu JC, Casiglia E, Narkiewicz K, Kawecka‐Jaszcz K, Staessen JA, European Project On Genes in Hypertension I . Impact and pitfalls of scaling of left ventricular and atrial structure in population‐based studies. J Hypertens 2016; 34: 1186–1194. [DOI] [PubMed] [Google Scholar]
- 25. Shah AM, Claggett B, Kitzman D, Biering‐Sorensen T, Jensen JS, Cheng S, Matsushita K, Konety S, Folsom AR, Mosley TH, Wright JD, Heiss G, Solomon SD. Contemporary assessment of left ventricular diastolic function in older adults: the atherosclerosis risk in communities study. Circulation 2017; 135: 426–439. [DOI] [PMC free article] [PubMed] [Google Scholar]
- 26. Australian Institute of Health and Welfare . Cardiovascular disease, diabetes and chronic kidney disease—Australian facts: risk factors. Cardiovascular, Diabetes and Chronic Kidney Disease; Series No 4, Cat no CDK 4. Canberra: AIHW; 2015.
- 27. Australian Institute of Health and Welfare . Diabetes compendium. https://www.aihw.gov.au/reports/diabetes/diabetes‐compendium/contents/how‐many‐australians‐have‐diabetes (21 May 2018).
- 28. Australian Institute of Health and Welfare . An interactive insight into overweight and obesity in Australia. https://www.aihw.gov.au/reports/overweight‐obesity/interactive‐insight‐into‐overweight‐and‐obesity/contents/how‐many‐people‐are‐overweight‐or‐obese (21 May 2018).
- 29. Ball J, Thompson DR, Ski CF, Carrington MJ, Gerber T, Stewart S. Estimating the current and future prevalence of atrial fibrillation in the Australian adult population. Med J Aust 2015; 202: 32–35. [DOI] [PubMed] [Google Scholar]
- 30. Australian Institute of Health and Welfare . Cardiovascular health compendium. https://www.aihw.gov.au/reports/heart‐stroke‐vascular‐disease/cardiovascular‐health‐compendium/contents/how‐many‐australians‐have‐cardiovascular‐disease (21 May 2018).
Associated Data
This section collects any data citations, data availability statements, or supplementary materials included in this article.
Supplementary Materials
Table S1. Characteristics on enrolment (Visit 1) of SCREEN‐HF participants who subsequently attended for echocardiography and those who did not
Figure S1. Flow chart of numbers of individuals invited to participate in the SCReening Evaluation of the Evolution of New Heart Failure (SCREEN‐HF) study who were subsequently enrolled and attended Visit 1 and subsequent echocardiography (Visit 2).