Abstract
A framework for the global analysis of multi-speed analytical ultracentrifugation sedimentation velocity experiments is presented. We discuss extensions to the adaptive space-time finite element fitting methods implemented in UltraScan-III to model sedimentation velocity experiments where a single run is performed at multiple rotor speeds, and describe extensions in the optimization routines used for fitting experimental data collected at arbitrary multi-speed profiles. Our implementation considers factors such as speed dependent rotor stretching, the resulting radial shifting of the finite element solution’s boundary conditions, and changes in the associated time invariant noise. We also address the calculation of acceleration rates and acceleration zones from existing radial acceleration and time records, as well as utilization of the time state object available at high temporal resolution from the new Beckman Optima AUC instrument. Analysis methods in UltraScan-III support unconstrained models that extract reliable information for both the sedimentation and the diffusion coefficients. These methods do not rely on any assumptions and allow for arbitrary variations in both sedimentation and diffusion transport. We have adapted these routines for the multi-speed case, and developed optimized and general grid based fitting methods to handle changes in the information content of the simulation matrix for different speed steps. New graphical simulation tools are presented that assist the investigator to estimate suitable grid metrics and evaluate information content based on edit profiles for individual experiments.
Introduction:
Analytical ultracentrifugation (AUC) is a well-established method for the characterization of composition, size and anisotropy of colloidal molecules in solutions. The preferred technique for studying such solutions by analytical ultracentrifugation is the sedimentation velocity (SV) technique, which separates the solutes based on their hydrodynamic properties and visualizes their sedimentation and diffusion transport with a range of optical systems. Currently available systems are based on UV/visible absorbance, refractive index (Rayleigh interference) detection, and fluorescence intensity emission. A novel multi-wavelength detector has been introduced more recently to add a spectral dimension to the hydrodynamic analysis [1]. All instruments are able to collect data at multiple speeds without restarting at rest. AUC can be used to measure a very broad range of molecular sizes, which range from Angstroms to several hundred nanometers. The molecular size and size resolution accessible by AUC is a function of the molecule’s density, the buffer density and the rotor speed. In many applications the analysis focuses on the heterogeneity of different sized molecules of similar density. Judicious selection of the rotor speed will optimize the accessible hydrodynamic information obtained from a single molecular size, but for heterogeneous systems it is common practice to select a single speed optimal for the average size, sacrificing accuracy and precision at either end of the size distribution. Therefore, when mixtures of particles that are heterogeneous in the sedimentation coefficient need to be distinguished, performing the experiment at multiple speeds promises to provide additional detail and resolution. The idea of using multiple speeds for such enhancements in resolution dates back to the work by Gehatia [2], a summary of previous efforts commonly referred to as gravity sweep methods can be found in [3, 4]. While a substantial body of work has been published on this topic, a rigorous look at the benefits and pitfalls of multi-speed analysis by finite element modelling is not yet available. In a SV experiment, a solution is placed into a sector-shaped cell and any solutes present in the solution are accelerated by the centrifugal force field generated by the spinning rotor. The resulting sedimentation transport creates a moving boundary that moves the solute with a speed that depends on its mass, anisotropy, density, and rotor speed. The observed speed is also a function of the density and viscosity of the solvent used in the experiment. Importantly, this moving boundary also creates a concentration gradient which leads to diffusional flow. These two transport processes occur simultaneously and determine the distribution of the solute over the course of the SV experiment. The sedimentation and diffusion transport of an ideally sedimenting and diffusing solute in a sector-shaped ultracentrifugation cell is described by the Lamm equation:
| Equ. 1 |
where C denotes the concentration, ω is the angular velocity, r is the radial position, t the time and s and D are the sedimentation and diffusion coefficients, respectively. Since an exact solution to this equation is not known, the equation is typically solved by finite element methods. In UltraScan [5], a software package for the analysis of AUC data, the adaptive space-time finite element solution is used to solve the Lamm equation for non-interacting systems [6] and reacting systems [7]. For non-interacting systems, a least squares fit of experimental data with a linear combination of finite element solutions of this equation for the appropriate range of sedimentation and diffusion coefficients will, in theory, recover the sedimentation and diffusion coefficients, as well as the partial concentration, of each solute in the system:
| Equ. 2 |
where ci is the amplitude and L the Lamm equation solution for solute i at point j, and xj is the experimental observation at point j, and j is a function of radius and time. Multiple optimization algorithms in UltraScan are based on this general theme, and produce concentration, sedimentation and diffusion coefficients for each solute [8, 9, 10, 11, 12]. When selecting a rotor speed for a SV experiment, it is important to consider the signal produced by the sedimenting particle for each of the fitted parameters. The larger the signal of a parameter, the higher is the confidence in the determination of the parameter. There exists an inverse relationship for the signal obtained for sedimentation and diffusion transport as a function of rotor speed and duration of the experiment. For example, if rotor speed is increased, separation is increased and the resolution in s improves. On the other hand, a fast sedimenting particle, while providing good signal on s, will not spend much time diffusing before being pelleted, reducing the information available to fit the diffusion coefficient. A fast sedimenting particle will also pellet before smaller particles have appreciably moved at all, providing no information at all in later scans. In contrast, reducing the rotor speed will provide more signal to diffusion, but also lower the resolution in s. Another factor affecting available information is the number of scans that can be collected during a given time period. Multiple samples measured in an 8-position An50Ti rotor places a practical limit on the time available for scanning a single sample, in particular the number of scans that can be collected from each individual sample. Furthermore, the transport by diffusion is proportional to the square root power of time, while transport due to sedimentation proceeds with the first power of time. This raises the question: what is the optimal speed for a given solute? This question is even more complicated for the case of a heterogeneous solution where no single speed will be optimal for all species, and depends in large part on the questions asked by the investigator. If molar mass or anisotropy need to be determined, a slow speed will be needed to generate sufficient diffusion information, while sacrificing information on composition detail. If composition detail is needed, a higher rotor speed is preferred. Balancing the signals from diffusion and sedimentation by applying a single best rotor speed is challenging since no analytical guide exists, and because the composition of a mixture is typically not known a priori. As we show below, simulations can provide a useful guide for the resolution and the information content to be expected for a single solute. For mixtures containing solutes exhibiting a range of sedimentation and diffusion coefficients, the experiment can be performed with speed profiles incorporating multiple speeds which better match the properties of each solute in the mixture in a single experiment or by global fits of the same mixture measured in separate experiments, each performed at a different speed. Below, we systematically evaluate the advantages of each approach, and illustrate the solutions implemented in the UltraScan software package for the analysis of AUC data [5] to address the technical challenges encountered when fitting multi-speed data with finite element solutions of the Lamm equation.
Methods.
1. Identification of optimal speed profiles for homogeneous and heterogeneous samples using simulated data.
Simulated data provide realistic test cases that permit a systematic evaluation of the information retrieved under conditions where rotor speed and experimental duration are varied and all other factors are held constant. In this section, we use simulated data to provide a framework for estimating optimal run parameters for designing successful SV experiments. Proper experimental designs play a crucial part in the recovery of information from a SV experiment, and should be optimized for a particular test system. The following factors contribute to the quality of the information retrieved:
A. Column length:
A longer solution column provides more data points for fitting, and improves the separation between solutes. Data from sections at the bottom of the cell provide more separation resolution than data at the top of the solution column, since heterogeneous mixtures of solutes are further separated near the bottom, and the longer the column, the better the separation. On the other hand, diffusion transport is maximized near the top of the cell, where steep concentration gradients near the meniscus enhance diffusional flows. At the bottom of the cell, diffusion will have a similar effect, where steep concentration gradients (due to pelleting) enhance diffusion information from the back-diffusional flow off the cell bottom. While high concentration regions at the bottom of the cell tend to be outside of the dynamic range of most detectors, and steep gradients also cause refractive artefacts, the curvature of the boundary near the bottom is often still significantly affected in concentration regions where measurements are still possible, but finite element solutions may not be able to match any refractive deviations and therefore steep gradients should not be included in the modelling.
B. Duration:
The duration of the experiment should be long enough to allow the solute to completely sediment (pellet). Aborting the experiment before the solute is pelleted or has reached equilibrium will lower the information available for fitting. Collecting data past the pelleting or equilibrium state is pointless since additional scans do not provide new information.
C. Signal concentration and duration:
The amount of signal available should be scaled to the noise expected from the experiment. For a well tuned instrument, the absorbance system of the Beckman Proteomelab XLA is capable of a signal-to-noise ratio (SNR) of 250–3001 for most wavelengths with sufficient intensity when measured in intensity mode, and from our observations, the SNR for the Beckman Optima AUC is at least 2 fold higher. For the purpose of this study, we will assume a SNR of 250 for all simulations, and optimize the duration of the experiment such that the midpoint of the boundary has reached the bottom of the edited data range. For all experimental datasets, we simulate a maximum column length of 1.3 cm, with a meniscus of 5.9 cm and a bottom of the cell position of 7.2 cm, leaving room for a small 1 mm air bubble above the meniscus, as can be achieved with about 0.45 ml loading volume. The optimal duration of the experiment for a given speed and solute can be derived from the definition of the sedimentation coefficient, which is given by the speed of the sedimentation, divided by the centrifugal field strength:
| Equ. 3 |
This leads to the differential equation:
| Equ. 4 |
where rm denotes the meniscus position (the position of the midpoint of the boundary at t0 (the start of the experiment), and rb denotes the midpoint of the boundary at some time t during the experiment. Solving for t, and taking t0 = 0, we obtain:
| Equ. 5 |
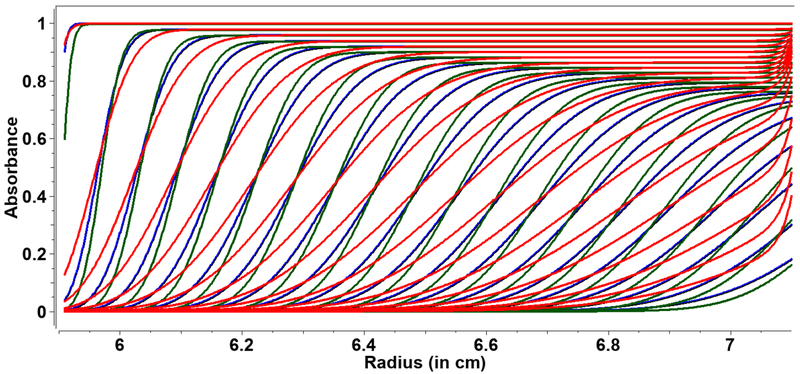
We are now able to predict the optimal duration of a SV experiment for any speed using Equ. 5, which is independent of diffusion coefficient and guarantees optimal coverage of the available column length, producing a pattern similar to that shown in Figure 1. We have added a calculator in UltraScan that estimates the optimal time for a given rotor speed and s value, and the optimal speed for a given experimental duration, given an s value.
Figure 1:
ASTFEM-simulated SV data at three different speeds and durations for a 5S species with a frictional ratio of 1.28. Red: 30,000 rpm (11h:12m), blue: 45,000 rpm (4h:58m), and green: 60,000 rpm (2h:48m). These duration and speed combinations result in the same amount of cumulative centrifugal force, but diffusion information is much more significant for slower speeds, as can be seen from the shallower traces and the increased back-diffusion effect on the boundary shape.
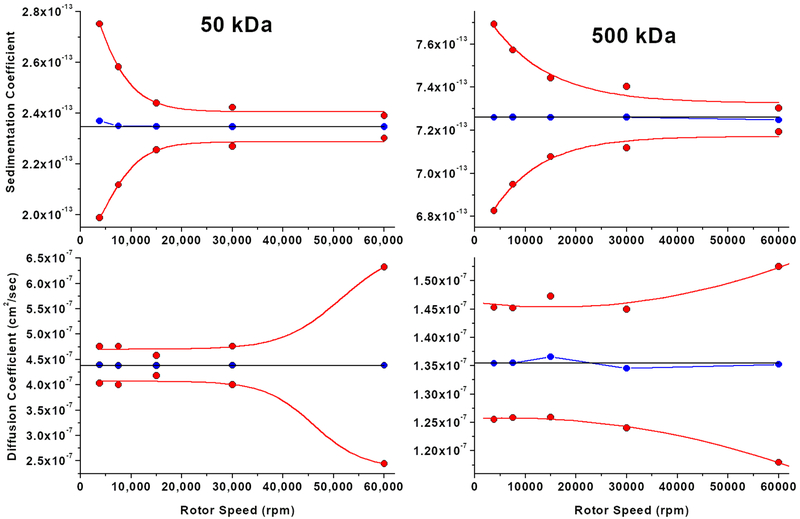
Once the duration is optimized for any speed and solute, we need a quantitative metric to assess the reliability with which the sedimentation and diffusion coefficients can be recovered as a function of speed for a given solute. This can be determined by measuring the confidence intervals for the fitted sedimentation and diffusion coefficients obtained from simulated SV experiments as a function of a range of different speeds. To illustrate the effect of speed on the observed confidence intervals, we simulated two separate, homogeneous systems containing representative molecules with 50 and 500 kDa molar mass, and with frictional ratios of 2.0 and 3.0, respectively, at 3,800, 7,500, 15,000, 30,000 and 60,000 rpm, using Equ. 5 to calculate the optimal time for each speed setting. The experiments were simulated with stochastic noise added, yielding a SNR value of 250, which corresponds to an RMSD of 0.004 at an absorbance value of 1.0. Due to the presence of stochastic noise, a unique solution can not be obtained in the fit. To measure the uncertainty in the fitted data, we employed 100 Monte Carlo iterations [13], and report here the 95% confidence intervals for the measured sedimentation and diffusion coefficients.
The results are shown in Figure 2, and clearly indicate the inverse relationship for the confidence intervals observed at different speeds for the two parameters s and D. Although we did not investigate different SNR values, we do not expect the general pattern to change, just the magnitude of the confidence bands. In addition, it is apparent that the magnitude of the confidence intervals increases as a function of increasing frictional ratio and size, suggesting that larger diffusion and sedimentation coefficients can be measured more accurately because they provide more signal in the AUC instrument. Furthermore, the results suggest that no single speed can provide equally high confidence for multiple species present in a mixture, and that multi-speed experiments will extract optimal signal of different species at different speeds.
Figure 2:
95% Confidence interval patterns (red) for sedimentation velocity experiments of a 50 kDa (left) and a 500 kDa species (right) observed in SV experiments simulated for different speeds with a SNR of 250. Confidence intervals were determined with 100 Monte Carlo iterations of the two-dimensional spectrum analysis. Top row: sedimentation coefficient, bottom row: diffusion coefficient. The blue lines indicate the predicted maximum likelihood estimate from the fit, the horizontal black lines indicate the theoretical value used in the simulation.
The fitting of SV experimental data acquired at multiple speeds poses a series of challenges that need to be addressed in the modelling of experimental data. In the next section we discuss reliable solutions to these challenges that have been implemented in the UltraScan software, so multi-speed experiments can be correctly and rigorously analyzed by finite element modelling approaches.
2. Solutions to challenges when fitting experimental multi-speed data.
A. Rotor stretch.
A fundamental challenge is related to the physical stretching of the rotor when rotor speeds are increased. A stretching rotor will change the position of the rotor hole to a longer radius range. This changes the boundary conditions required for an accurate solution of the Lamm equation (the meniscus position and the bottom of the cell position), and exposes the solutes to a higher centrifugal force field. Although the rotor stretch can be precisely measured and predicted, this potential correction is ignored in all other analysis software packages. UltraScan provides a utility for precisely measuring this stretch for each rotor in use at a laboratory, and applying a correction to the boundary conditions to each experimental dataset to assure correct solutions of the Lamm equation at any speed. Combining this information with the measured geometries for each type of centerpiece used, it is possible to calculate the precise boundary condition for the bottom of the cell position for each experiment. UltraScan incorporates a relational database with entries for each rotor and centerpiece in use at a laboratory, and maintains a database of precisely measured centerpiece geometries for commonly used centerpieces, including those manufactured by Beckman-Coulter, Spin Analytical and Nanolytics Instruments. To precisely determine the cell geometry, a high resolution scan on a flatbed scanner is performed of the centerpiece. The scanner should support at least 3,200 DPI optical resolution, which yields better than 10 micron resolution, exceeding the optical resolution of the Optima AUC. The centerpiece image is aligned precisely to 0 degrees along the septum axis, and Euclidean geometry is used to derive the bottom of the cell position at the channel center, assuming that the centerpiece center is positioned at 6.500 cm at rest and the center of the channel is positioned at 2.25 degrees from the septum center axis. The optical resolution of the scanner can easily be verified by scanning a ruler with a length grating; all measurements can be performed with open source software such as GIMP [14]. For the rotor stretch calibration, we utilized a 7-sector calibration mask (provided as a gift to us by Alexander Bepperling, Hexal, Germany) which provides 14 channel edges (edge positions are listed in Table 1).
Table 1:
Radius values for edge positions at rest for the radial calibration mask provided by Alexander Bepperling, Hexal, Germany. Measurements assume a 2.25 degree scanning angle from the angle at the center of the septum. Values were obtained from scanning a calibration mask on a high resolution scanner, and using Euclidean geometry interpolations to find the radial positions at each edge.
| Slot Number: | 1 | 2 | 3 | 4 | 5 | 6 | 7 |
|---|---|---|---|---|---|---|---|
| Inside edge (cm): | 5.850 | 6.053 | 6.253 | 6.453 | 6.654 | 6.854 | 7.054 |
| Outside edge (cm): | 5.956 | 6.157 | 6.358 | 6.558 | 6.760 | 6.959 | 7.160 |
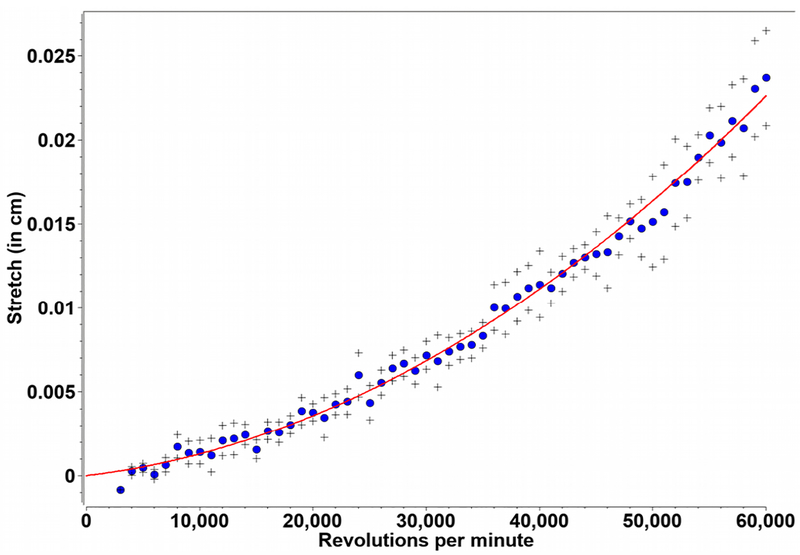
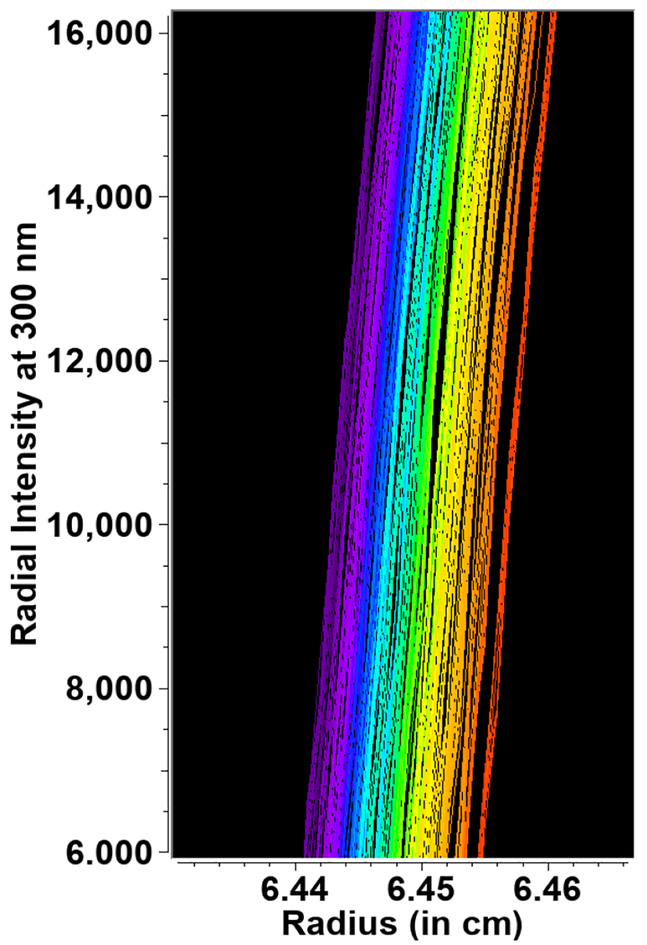
To calibrate the rotor, the following approach is used: The rotor to be calibrated is equipped with a counterbalance and a 3-mm calibration cell. The calibration mask is sandwiched between two windows, window holders, 3-mm spacers, and placed into a standard housing. Two O-rings are needed to fill the space between the screw ring and the upper window holder. The cell components are assembled in a standard housing and placed opposite from the counterbalance. The rotor is then accelerated to 3,000 rpm and a radial calibration is performed. The rotor continues to spin at 3,000 rpm for 20 minutes to equilibrate the stretching process. Next, the calibration mask is radially scanned ten times in intensity mode at a user-selected wavelength using the highest radial resolution setting. The rotor is then accelerated to 4,000 rpm, and after 20 minutes, again radially scanned ten times in intensity mode. This process is repeated in 1,000 rpm increments until the maximum rated rotor speed has been reached. The resulting data are analyzed with the rotor calibration routine in UltraScan, which averages the displacements between successive speeds from each edge and each scan. Since the centrifugal force increases with the square of the rotor speed, the displacement versus rpm data are fitted to a second order polynomial, which describes the rotor stretch with high precision (see Figure 3). This pattern reflects radial shifts as can already be seen in the primary data (see Figure 4). The zeroth-order coefficient, which should already be close to zero, is subtracted from all values to account for the finite rotor stretch incurred at 3,000 rpm, adjusting the intercept to a zero stretch value at rest. UltraScan maintains a database entry for each saved rotor calibration, which includes the 1st and 2nd order stretch coefficients. The calibrations are then associated with any experiment converted to openAUC format in single-wavelength [15] or multi-wavelength format [16]. The rotor calibration routine also provides the absolute edge positions measured in the rotor stretch calibration, which can be compared to the values shown in Table 1 to assess the accuracy of the radial calibration and counterbalance blade positions. During finite element calculations, the data-associated centerpiece geometry and rotor stretch calculations are automatically loaded from the database and, together with the rotor speed, are used to calculate the current boundary condition for the bottom of the cell position, rb, according to Equ. 6:
| Equ. 6 |
where si is the ith rotor stretch coefficient, rpm the rotor speed, and rbr the position of the cell bottom at rest. Since ASTFEM solutions [6, 7] are perfectly well suited for modelling equilibrium data, this approach assures an accurate bottom-of-cell position needed to correctly model back-diffusion, which is essential for fitting data near the bottom of the cell when sedimentation transport is at or near equilibrium conditions.
Figure 3:
Rotor stretch calibration data for a An60Ti rotor. Measurements were taken at 300 nm in intensity mode, at speeds between 3–60 krpm and fitted to a 2nd order polynomial. Black crosses indicate one standard deviation.
Figure 4:
Intensity scans of a single edge position from the radial calibration mask, where color represents increasing speed (and time) from purple=3,000 to red=60,000 rpm. Note the increasing separation with higher speed.
B. Considerations for shifting radial positions at different speeds.
When SV experiments are performed at multiple speeds, the cell position changes as a function of rotor speed as is explained in Section A. An accurate simulation of the sedimentation and diffusion transport of each particle requires that these changes are considered in the Lamm equation solutions. Furthermore, during acceleration, as the cell position shifts continuously, the adaptive time solutions used during constant speed zones cannot be implemented and a discrete 1-second time step is applied which requires a continuous interpolation of all radial positions during simulation as the rotor stretches during the acceleration zone. A further complication is encountered from the detection optics in the analytical ultracentrifuge. When measuring in intensity mode, a strong time-invariant systematic noise component is recorded that largely stems from variations in the sensitivity of the photomultiplier surface at different radial positions. Other optical imperfections such as scratches and fingerprints on cell windows, and oil droplets on windows in the slit assembly contribute to this fingerprint noise as well. The reference frame for these sources changes relative to the stretching rotor and different time-invariant contributions are observed as positions near the meniscus are lost and new points are recorded at the bottom of the cell. Unlike the contributions from the photomultiplier tube and slit assembly optics, any time-invariant noise originating from the window shifts along with the stretching rotor, adding to the noise from the other sources. This results in a different time-invariant noise profile at every speed step. Along with other systematic noise contributions, this time-invariant noise component must be corrected during the fitting of the experimental data [17]. This correction results in a vector of noise offsets, one for each radial point in every scan. This time invariant noise is also present in Rayleigh interference data and to a lesser degree in UV/visible absorbance data. When the radial reference frame shifts during acceleration, each new point added at the bottom of the cell during rotor stretching gives rise to a new offset that was not yet fitted in the previous speed step. Therefore, each new speed step requires a separate time invariant noise fit for optimal noise correction. In UltraScan, each speed step is therefore treated as a separate experiment, and each cell/channel/wavelength/speed combination should be analyzed initially as a separate experiment using all refinement steps typically applied during routine analysis [17].
C. The acceleration profile.
The Beckman Proteomelab XLA and XLI instruments do not record any system information during the time the rotor is accelerating. Time and ω2t records are only available for each recorded scan file, and scans are only recorded while rotor speed is constant. When the data acquisition software is programmed to collect data at multiple speed steps, it is not clear what exact acceleration rate was used during the acceleration period, when exactly after the last scan at the previous speed step the acceleration started, and when the acceleration reached a constant speed before the next scan at the next speed step was collected. Below we illustrate how this information can be reconstructed from the information available at different constant speed steps as long as at least one scan was recorded during each constant speed step and both time and ω2t records are available for those scans, and as long as a linear acceleration rate is assumed. Fortunately, the new Optima AUC instrument provides a centrifuge time state record, which by default is set to record the system state every ten seconds. This includes temperature, time, set and actual rotor speed, and ω2t records, even during the acceleration zone. Furthermore, this time state record can be re-programmed to record system status with 1-second granularity (contact Beckman Service for details on this procedure). UltraScan now includes procedures to generate estimated time state profiles for the acceleration zone for data acquired on the Beckman Proteomelab, and is able to utilize directly the time state file available on the Optima AUC to aid in the simulation of acceleration zones.
D. Time state implementation.
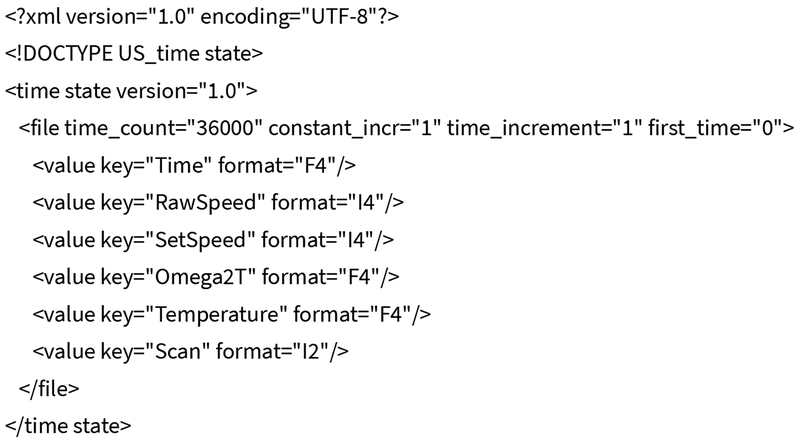
In UltraScan-III versions 4.0 and higher, a time state object is used to control the simulation grid for adaptive space-time finite element (ASTFEM) and finite volume (ASTFVM) solutions of the Lamm equation. The time state object is either provided by the Optima AUC instrument, is generated by the ASTFEM or ASTFVM simulator routine (a GUI routine available in the UltraScan software for simulation of arbitrary models), or calculated from available scan records when data was collected on the Proteomelab XLA/XLI. With this communication, we extend the openAUC standard to include the time state object as described here by the XML code, and as used in UltraScan (the example shown in Figure 5 is for a 10-hour experiment):
Figure 5:
XML code describing the time state for a 10-hour (36,000 second) experiment.
By default, the UltraScan implementation uses a one second time resolution, and the Time_Count variable signifies the number of rows in the time state object, and the number of seconds in the experiment. Each row contains the following variables:
“time_count” represents the total number of data records. “constant_incr” is a boolean type (“1” or “0”) and specifies whether or not data records are for times at a constant increment. If “0”, records must have a “Time” attribute.
“time_increment” is given if constant_incr=1, or defaults to 1 (in seconds).
“first_time” is given if constant_incr=1, or defaults to 0 (in seconds).
The contents of this file are stored in binary format and are further described on the UltraScan wiki at http://wiki.bcf2.uthscsa.edu/ultrascan3/wiki/time state. When a time state object is available (either from the instrument, the instruments database, i.e., Optima AUC’s PostGreSQL database, or from simulation, the time state object is stored in the UltraScan LIMS database as well as locally in the imports directory (i.e., $HOME/ultrascan/imports/<runID>). For the previous generation of AUC instruments (i.e., Beckman Proteomelab XLA/XLI) a time state object is not available and must be generated based on time, rpm and ω2t information available in the recorded scan file headers. This calculation is performed during the import of legacy data and saved to the database during the conversion of data to the openAUC format. Here, all scans must be taken into account before any data, scans, or triples are deleted to insure optimal accuracy. The first calculation that must be made is the calculation of the unknown acceleration rate at the beginning of the experiment. This is typically set on the instrument to a fixed linear rate, by default 400 rpm/sec, but our calculations show that this rate, while close, is not exact. To obtain the acceleration rate A, consider time t1 at the instant where constant speed has been reached, and time ts of an arbitrary scan s during the first constant rotor speed phase of the run. Since the instrument does not collect any data when t1 is reached, t1 cannot be retrieved from a scan file header and must be calculated. If we assume a linear acceleration rate, then:
| Eue. 7 |
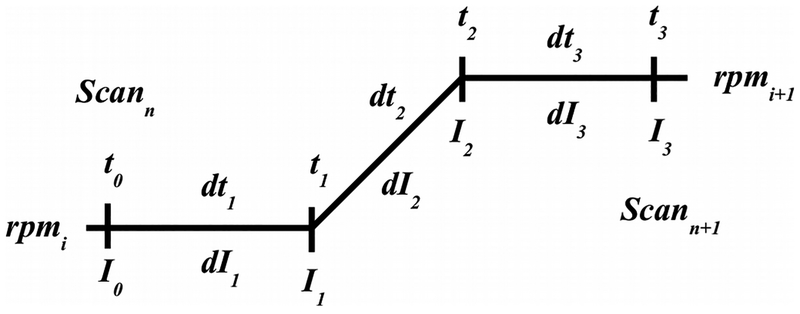
where Is is the ω2t integral value recorded for scan s in the file header, and ω is the angular velocity of the first constant speed step. This calculation can be performed using the t, rpm and ω2t integral information from any scan collected during the first constant speed step, but since the accuracy of the older instruments for recording t and ω2t integrals is rather poor2, UltraScan will average all available scans for a single constant speed step to obtain the best estimate for the acceleration rate. Experiments with multiple constant speed steps incur multiple acceleration zones whose precise start and end points need to be calculated as well for older instruments where time state objects are unavailable. In UltraScan, the assumption is made that the acceleration rate A is linear and constant for all acceleration zones. In the absence of time state information from the instrument, the acceleration rate calculated earlier is then assumed for all subsequent acceleration zones. For experiments with multiple speed steps we need to consider multiple acceleration zones. For older instruments, time state records are not available for the precise times when acceleration started and constant speed resumed again at the next speed step, therefore, these time points need to be calculated. As Figure 6 illustrates, the unknown times t1 and t2 occur after the last scan of the previous speed step and before the first scan at the next speed step are collected, respectively. Similarly, the ω2t integrals for these time points are also not readily available and need to be calculated. The unknown time points and integral values can be calculated from known quantities t0, t3, I0, I3, and A:
| Equ. 8 |
where dtk = tk - tk-1 and dIk = Ik - Ik-1. This leads to the pair of equations:
| Equ. 9 |
Solving these equations for dt1 and dt3 leads to:
| Equ. 10 |
Combining this result with the other known quantities we obtain the remaining unknowns:
| Equ. 11 |
From Equ. 11 we can now reconstruct a complete time state object for the older generation of instruments and simulate accurate acceleration profiles for an arbitrary number of speed steps in a multi-speed SV experiment.
Figure 6:
schematic view of the acceleration zone between two constant speed steps at speeds rpmi and rpmi+1. t0 and t3 are the time points for the last scan collected at rpmi and the first scan collected at rpmi+1, respectively. I0 and I3 are the corresponding ω2t integrals at these points. t1 is the unknown point where acceleration starts, and t2 the unknown point where the next constant speed step resumes. I1 and I2 are the corresponding unknown ω2t integrals at these points.
E. Modelling challenges.
For reasons illustrated above, SV analysis of very heterogeneous systems will greatly benefit from a multi-speed profile, since speeds can be customized for the composition of the sample and result in optimized sedimentation and diffusion signal for each individual solute in the mixture. At the beginning, slow rotor speeds will allow large solutes to diffuse sufficiently well, and slow their sedimentation so a statistically meaningful number of scans can be observed. Smaller solutes will barely sediment at these slow speeds. Once larger solutes are sedimented, higher rotor speeds are employed so smaller solutes start moving into the solution column, while larger solutes disappear from the solution column. This means that later speed steps performed at a higher rotor speed no longer need to consider solutes that are already sedimented out of view. Most modelling approaches implemented in UltraScan are based on a linear fitting approach for solving the system of linear combinations Ax = b using non-negatively constrained least squares (NNLS, [18]), where A is the matrix of simulated ASTFEM solutions [6] for a collection of solutes represented by a 2-dimensional s-D grid, x is the vector of partial concentrations where xi ≥0 for any solutes found in the fit, and b represents the experimental data to be fitted.
During the initial refinement of experimental data, the 2-dimensional spectrum analysis (2DSA, [8, 9]) is employed to remove systematic time- and radially invariant noise contributions [19], and to fit the meniscus positions [17]. Customarily, a single SV experiment is fitted by a single grid, representing the system of all solutes present in the mixture. However, for reasons enumerated in section B, each speed step must initially be treated as a separate analysis, allowing for the use of a different 2DSA grid (and matrix A) at each speed step. Here, it is important to note that each speed step requires simulation of all prior speed steps (though not the fitting of prior speed step’s experimental data), because the acceleration history needs to be preserved over all speed steps to obtain the appropriate initial concentration distribution for each modelled solute at the beginning of each speed step. As mentioned earlier, faster sedimenting solutes may have disappeared from the solution column due to pelleting and therefore no longer need to be modelled in later speed steps. In fact, if such solutes were continued to be modelled in later speeds steps, their concentration distributions will be close to zero, adding multiple columns of essentially empty vectors to matrix A. Numerically, this has a destabilizing effect on the NNLS fit and should be avoided, and of course, adding zero-vectors to A wastes computer memory and computational resources. We have therefore implemented a check of the norms of each vector in A before performing the NNLS fit. Vectors whose norms fall below a preset tolerance are excluded from the fit. Furthermore, for each speed step, a test is performed that evaluates the concentration of each solute in the model at a position close to the bottom of the cell from the last scan of the previous speed step (which can be an acceleration zone). If the concentration near the bottom falls below a set tolerance value (0.001, which is less than half than the magnitude of the optimal stochastic noise observed in the Optima AUC), simulation of subsequent speed steps is skipped since no additional boundary information would be obtained. As a result, a user can start a fit of a multi-speed SV experiment with the appropriate grid, covering all putative solutes in the system, and the UltraScan software will automatically filter out non-essential components from the fit. The selection of meaningful grid points is evaluated separately for each speed step and therefore, an optimal grid size and spacing is automatically generated for each speed step, avoiding user bias in the selection of the fitting model and maintaining the ability to provide a general, model-independent solution.
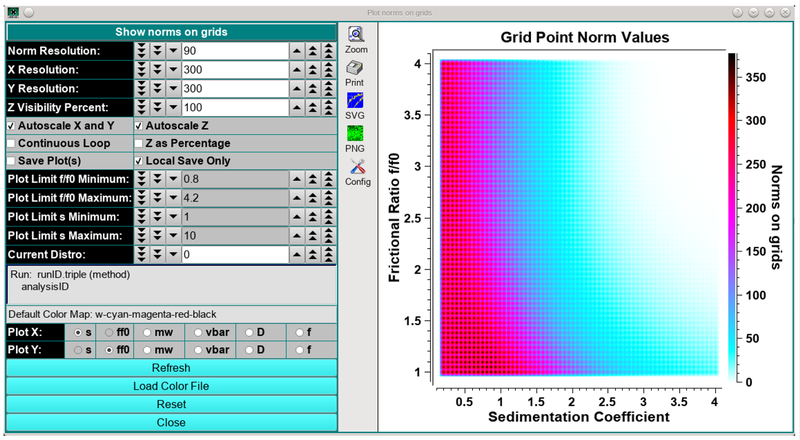
A new utility in UltraScan allows a user prior to fitting to graphically display a grid by visualizing the norm of each solute point in the grid as a color density value. This utility immediately provides visual feedback on the grid’s information content and signal distribution. An example is shown in Figure 7 for a grid from 0.2–4 s for a late 60,000 rpm speed step of a multi-speed experiment which indicates that a significant number of solutes have a near-zero norm value and should not be included in the analysis.
Figure 7:
UltraScan utility representing the norm values of individual columns in the A matrix for NNLS fits as a color gradient. White represents norm values approaching zero. The utility can be used to predict appropriate grid selections for a given experimental dataset. Norm values are functions of rotor speed, experiment duration, column length, radial editing limits and sedimentation and diffusion coefficients.
Summary:
We have described the implementation of multi-speed sedimentation velocity experiments in the UltraScan-III software, and discussed the theoretical considerations for optimal analysis of heterogeneous systems. We have developed software capable of simulating finite element experiments conducted at multiple speeds for both the older Beckman Proteomelab XLA/XLI and the new Beckman-Coulter Optima AUC instruments. We have developed methods in UltraScan that for the first time take into account speed dependent rotor stretching and the resulting changes in boundary conditions required for accurate finite element solutions. A new OpenAUC data structure addition for the time state object is described, and improvements to model-independent, two-dimensional grid searches that eliminate unneeded and zero-norm vectors in the linear combinations of NNLS fits are discussed.
Acknowledgements:
This work was supported by NIH grant GM120600 and NSF grants NSF-ACI-1339649 (to BD). Supercomputer calculations were performed on Comet at the San Diego Supercomputing Center (support through NSF/XSEDE grant TG-MCB070039N to BD) and on Lonestar-5 at the Texas Advanced Computing Center (supported through UT grant TG457201 to BD). We thank Beckman-Coulter, Indianapolis, for the use of an Optima AUC instrument, and Eric von Seggern (Beckman-Coulter, Fort Collins) for excellent technical assistance with the time state development.
Footnotes
The SNR is calculated by dividing the total signal (loading concentration) by the root-mean-square deviation of the fitted data when random residuals are obtained.
We have seen deviations of up to 11 minutes for a 3-day run, and ω2t integrals were inconsistent to about 0.08% with the recorded time and rotor speed, while on our Optima AUC the time accuracy was precise to within one second and no deviations in the calculated ω2t integrals could be identified within the accuracy of the recorded values
References:
- 1.Pearson JZ, Krause F, Haffke D, Demeler B, Schilling K, and Cölfen H. Next-Generation AUC Adds a Spectral Dimension: Development of Multiwavelength Detectors for the Analytical Ultracentrifuge Methods in Enzymology 526(1); 1–26 (2015) [DOI] [PubMed] [Google Scholar]
- 2.Gehatia M 1965. Technical Report AFML-TR-64–377 Ultracentrifugation at variable angular velocity-derivation of basic equations. Air Force Materials Lab, Wright-Patterson Air Force Base, Ohio: AD-615 966/XAB; ML; TR-64–377; 340; 734004 [Google Scholar]
- 3.Ma J, Zhao H, Sandmaier J, Alexander Liddle J, Schuck P. Variable Field Analytical Ultracentrifugation: II. Gravitational Sweep Sedimentation Velocity. Biophys J. 2016. January 5;110(1):103–12. [DOI] [PMC free article] [PubMed] [Google Scholar]
- 4.Walter J, Löhr K, Karabudak E, Reis W, Mikhael J, Peukert W, Wohlleben W, Cölfen H. Multidimensional analysis of nanoparticles with highly disperse properties using multiwavelength analytical ultracentrifugation. ACS Nano. 2014. September 23;8(9):8871–86. [DOI] [PubMed] [Google Scholar]
- 5.Demeler B, and Gorbet G. Analytical Ultracentrifugation Data Analysis with UltraScan-III. Ch. 8, In Analytical Ultracentrifugation: Instrumentation, Software, and Applications. Eds: S. Uchiyama, W. F. Stafford and Laue T. Springer, 119–143 (2016) [Google Scholar]
- 6.Cao W, Demeler B. Modeling analytical ultracentrifugation experiments with an adaptive space-time finite element solution of the Lamm equation. (2005) Biophys J. 89(3):1589–602. [DOI] [PMC free article] [PubMed] [Google Scholar]
- 7.Cao W and Demeler B Modeling Analytical Ultracentrifugation Experiments with an Adaptive Space-Time Finite Element Solution for Multi-Component Reacting Systems. Biophys. J (2008) 95(1):54–65. [DOI] [PMC free article] [PubMed] [Google Scholar]
- 8.Brookes E, Boppana RV, Demeler B. (2006) Computing Large Sparse Multivariate Optimization Problems with an Application in Biophysics. Supercomputing ‘06 ACM 0-7695-2700-0/06 [Google Scholar]
- 9.Brookes E, Cao W, Demeler B. A two-dimensional spectrum analysis for sedimentation velocity experiments of mixtures with heterogeneity in molecular weight and shape. Eur Biophys J. (2010) 39(3):405–14. [DOI] [PubMed] [Google Scholar]
- 10.Brookes E, Demeler B. Parsimonious Regularization using Genetic Algorithms Applied to the Analysis of Analytical Ultracentrifugation Experiments. GECCO Proceedings ACM 978-1-59593-697-4/07/0007 (2007) [Google Scholar]
- 11.Gorbet G, Devlin T, Hernandez Uribe B, Demeler AK, Lindsey Z, Ganji S, Breton S, Weise-Cross L, Lafer EM, Brookes EH, Demeler B. A parametrically constrained optimization method for fitting sedimentation velocity experiments. Biophys. J (2014) Vol 106(8), pp1741–1750 [DOI] [PMC free article] [PubMed] [Google Scholar]
- 12.Demeler B, Nguyen TL, Gorbet GE, Schirf V, Brookes EH, Mulvaney P, El-Ballouli AO, Pan J, Bakr OM, Demeler AK, Hernandez Uribe BI, Bhattarai N, and RL Whetten. Characterization of Size, Anisotropy, and Density Heterogeneity of Nanoparticles by Sedimentation Velocity. Anal Chem. 2014. August 5;86(15):7688–95. [DOI] [PMC free article] [PubMed] [Google Scholar]
- 13.Demeler B and E Brookes. Monte Carlo analysis of sedimentation experiments. Colloid Polym Sci (2008) 286(2) 129–137 [Google Scholar]
- 14.GIMP, ver. 2.8.22 - GNU image manipulation program, a cross-platform image editor available for GNU/Linux, Macintosh OSX, and Windows. https://www.gimp.org
- 15.Cölfen H, Laue TM, Wohlleben W, Schilling K, Karabudak E, Langhorst BW, Brookes E, Dubbs B, Zollars D, Rocco M, Demeler B The Open AUC Project. Eur Biophys J. (2010) 39(3):347–59 [DOI] [PMC free article] [PubMed] [Google Scholar]
- 16.Gorbet GE, Pearson JZ, Demeler AK, Cölfen H, and Demeler B. Next-Generation AUC: Analysis of Multiwavelength Analytical Ultracentrifugation Data Methods in Enzymology, August 2015. doi: 10.1016/bs.mie.2015.04.013 [DOI] [PMC free article] [PubMed] [Google Scholar]
- 17.Demeler B Methods for the Design and Analysis of Sedimentation Velocity and Sedimentation Equilibrium Experiments with Proteins. Cur. Protoc. Prot. Sci (2010) Chapter 7:Unit 7.13. [DOI] [PMC free article] [PubMed] [Google Scholar]
- 18.Lawson CL and Hanson RJ 1974. Solving Least Squares Problems. Prentice-Hall, Inc. Englewood Cliffs, New Jersey [Google Scholar]
- 19.Schuck P, Demeler B. Direct Sedimentation Boundary Analysis of Interference Optical Data in Analytical Ultracentrifugation. Biophysical Journal, 76:2288–2296 (1999). [DOI] [PMC free article] [PubMed] [Google Scholar]


