Abstract
Colorectal cancer (CRC) is a tumor that derives from the rectum or colon, and colon adenocarcinoma (COAD) is the most common type of CRC. The present study was performed to identify genes that serve critical roles in the survival of patients with COAD. RNA-sequencing data of COAD was extracted from The Cancer Genome Atlas database, which included 480 tumor samples and 41 normal samples. Using the limma package, differential expression analysis was performed to identify the differentially expressed genes (DEGs). In addition, the potential functions and pathways for the identified DEGs were analyzed using the clusterProfiler package. After the samples were divided into high and low expression groups, survival analysis for the two groups was performed using the Kaplan-Meier model. Using Cytoscape software, a protein-protein interaction network was generated for the survival-associated genes. A total of 1,519 DEGs, including 568 upregulated genes and 951 downregulated genes, were identified in the COAD samples. Enrichment analysis suggested that the DEGs were implicated in numerous functional terms and pathways. Furthermore, 109 DEGs were identified to be survival-associated genes in COAD. According to the degrees of the network nodes, 5-hydroxytryptamine receptor 1D (HTR1D), TIMP metallopeptidase inhibitor 1 (TIMP1), serpin family E member 1 (SERPINE1), matrix metallopeptidase 3 (MMP3) and cannabinoid receptor 2 (CNR2) were key nodes, and the expression levels of these genes were analyzed in clinical samples of CRC. Therefore, the results of the present study suggest HTR1D, TIMP1, SERPINE1, MMP3 and CNR2 may affect the prognosis of patients with COAD.
Keywords: colon adenocarcinoma, differentially expressed genes, enrichment analysis, survival analysis, protein-protein interaction network
Introduction
Colorectal cancer (CRC) refers to cancer originating from the rectum or colon (1), and symptoms include bloody stool, altered bowel movements, prolonged fatigue and weight loss (2). Risk factors for CRC include diet, lack of exercise, smoking and obesity (3). CRC is the third most frequent type of tumor and is more common in men compared with women in developed countries based on 2009 global statistics (4). Globally, the incidence rate of CRC was 1.4 million and there were 694,000 CRC-associated mortalities reported in 2012 (5). As the most common type of CRC, colon adenocarcinoma (COAD) is a malignant epithelial carcinoma that derives from superficial glandular epithelial cells (6). COAD accounts for 75–85% of CRC cases, with an incidence rate of 10.2% and a mortality rate of 9.2% in 2018 globally (7). Therefore, the mechanisms of COAD need to be further investigated.
The loss of expression of chromobox homolog 7 (CBX7) is associated with a shorter survival time of patients with CRC; therefore, CBX7 expression may predict the prognosis of CRC (8). As a differentiation-associated tumor suppressor, N-myc downstream-regulated gene 2 (NDRG2) can positively mediate the expression of E-cadherin and extend the overall survival time of patients with colon cancer (9,10). Patients with CRC and an elevated Annexin A9 (ANXA9) expression level exhibit a worse prognosis compared with those with a reduced ANXA9 level; therefore, ANXA9 expression can be used as a prognostic factor for patients with CRC (11). Patients with COAD with a high BCL2-like 12 (BCL2L12) expression level present a longer survival time compared with patients with COAD with low BCL2L12 expression, indicating that BCL2L12 expression may be a biomarker for the disease (12). The tumor suppressor homeobox B9 (HOXB9) suppresses the development of COAD through inducing cell differentiation, and increased expression of HOXB9 indicates a longer survival time of patients with COAD (13). Despite these reports, the genes associated with the prognosis of patients with COAD have not been comprehensively revealed.
Bioinformatics analysis of RNA-sequencing data has been widely used to investigate the pathogenesis of human diseases (14,15). In the present study, the RNA-sequencing data of COAD was downloaded from The Cancer Genome Atlas (TCGA) database. Subsequently, differential expression analysis, enrichment analysis, survival analysis, and protein-protein interaction (PPI) network analysis was conducted to identify the key genes in COAD. The results of the current study may promote the prognostic prediction and targeted therapy of patients with COAD.
Materials and methods
Data source
Using the R package (version 3.5.3) TCGA Biolinks (16), the RNA-sequencing data of COAD (accessed June 3 2018; platform: Illumina HiSeq 2000 RNA Sequencing Version 2 analysis) was downloaded from The Cancer Genome Atlas (TCGA) database (https://cancergenome.nih.gov/). A total of 521 samples, including 480 tumor samples and 41 normal samples, were included in the TCGA dataset. Among the tumor samples, only 459 contained clinical information and were used for survival analysis. The samples were obtained from 216 females and 243 males, with a mean age of 67.43 years (range, 31–90 years). Furthermore, with regard to ethnicity, 214 patients were Caucasian, 59 were African-American, 11 were Asian, 1 was American Indian or Alaska native, and 174 patients were unknown. A total of 76 patients were classified as stage I, 178 patients as stage II, 129 patients as stage III, 65 patients as stage IV and 11 were unknown (17).
Data pre-processing and differential expression analysis
The genes without expression in >10% of the samples were filtered out. Subsequently, the Ensembl gene IDs were annotated to their respective gene symbols. Since multiple Ensembl gene IDs may correspond to a gene symbol, the counts of the corresponding Ensembl gene IDs were added to obtain the final gene expression. Based on the R package limma (version 3.38.3; http://www.bioconductor.org/packages/release/bioc/html/limma.html) (18), data normalization and differential expression analysis was performed. The genes with a false discovery rate (FDR)<0.05 and a |log fold change (FC)|≥2 were selected as the differentially expressed genes (DEGs) between the tumor and the normal samples.
Functional and pathway enrichment analysis
The Gene Ontology (GO) database (http://www.geneontology.org/) provides structured and well-established vocabulary for annotating proteins from cellular component (CC), biological process (BP), and molecular function (MF) aspects (19). The Kyoto Encyclopedia of Genes and Genomes (KEGG) database (http://www.genome.ad.jp/kegg/) contains information on biochemical pathways and can be applied for predicting the potential pathways for genes (20). Using the R package clusterProfiler (version 3.10.1; http://www.bioconductor.org/packages/release/bioc/html/clusterProfiler.html) (21), GO terms and KEGG pathways were analyzed for the DEGs. The significant threshold of enrichment analysis was set as FDR<0.05. Using the R package pathview (version 1.22.3; http://r-forge.r-project.org/projects/pathview/) (22), the identified KEGG pathways were presented.
Survival analysis
To study whether the DEGs exhibited prognostic abilities, the samples were divided into high expression samples and low expression samples with the median expression level as the cut-off value (the sample with the median expression level was placed in the high expression group). Combined with the clinical information of the samples, survival analyses between the high expression samples and the low expression samples were performed using the Kaplan-Meier (KM) model (version 2.44.1.1) with Tukey's post hoc test (23). P<0.05 was considered to indicate a statistically significant result.
PPI network analysis
After the survival-associated genes were identified, their interactions with other DEGs were analyzed using the Search Tool for the Retrieval of Interacting Genes/Proteins database (version 11.0; http://www.string-db.org/) (24). A combined score for each PPI pair, is produced, which is distributed between 0 and 1 (24). The higher the score, the more reliable the interaction association is (24). In the present study, the combined score was set as 0.4. Subsequently, the PPI network was constructed using Cytoscape software (version 3.7.1; http://www.cytoscape.org) (25).
Patient samples collection
A total of 37 paired samples of colon cancer tissues and adjacent normal tissues (age range, 42–78 years; mean age, 59 years; 21 males and 16 females) were surgically removed by resection and collected at the First Affiliated Hospital of Nanchang University (Nanchang, China) between May 2014 and October 2017. Adjacent normal tissues (at least 2 cm from the tumor site) were also collected as negative controls. Ethical approval for the present study was provided by the Ethics Committee of the First Affiliated Hospital of Nanchang University. Written informed consent was obtained from the study subjects.
RNA isolation and reverse transcription-quantitative polymerase chain reaction (RT-qPCR)
Gene expression was evaluated by RT-qPCR. Total RNA was extracted from tissues using TRIzol® reagent (Invitrogen; Thermo Fisher Scientific, Inc., Waltham, MA, USA), according to the manufacturer's protocol. Subsequently, 2 µg RNA was used for RT with the TransCript one-step gDNA removal and cDNA synthesis supermix (TransGen Biotech, Co., Ltd., Beijing, China). RNA expression levels of 5-hydroxytryptamine receptor 1D (HTR1D), TIMP metallopeptidase inhibitor 1 (TIMP1), serpin family E member 1 (SERPINE1), matrix metallopeptidase 3 (MMP3) and cannabinoid receptor 2 (CNR2) were detected by RT-qPCR using TransStart top green qPCR supermix (TransGen Biotech, Co., Ltd.), with the following thermocycling parameters: 5 min at 95°C, followed by 40 cycles at 95°C for 15 sec, 60°C for 30 sec and 72°C for 30 sec. The primers used for the amplification of the indicated genes were designed using Primer Express software v3.0.1 (Applied Biosystems; Thermo Fisher Scientific, Inc.): HTR1D forward, 5′-GCCTATACCATCACCCACA-3′ and reverse, 5′-TCCAGAGCAATGACACAGA-3′; TIMP1 forward, 5′-CACTGTTGGCTGTGAGGAA-3′ and reverse, 5′-AAGGTGACGGGACTGGAA-3′; SERPINE1 forward, 5′-CTTCCACCCGTCTCTCTG-3′ and reverse, 5′-CTACCAGGCACACAAAAGC-3′; MMP3 forward, 5′-TTCCTTCAGGCGTGGAT-3′ and reverse, 5′-GTGGATGCCTCTTGGGT-3′; CNR2 forward, 5′-AGCTGGTCGTACTCGCA-3′ and reverse, 5′-TCTCCGCCTTACCCATC-3′; and GAPDH forward, 5′-ACCRCGAAGACTGTGGATGG-3′ and reverse, 5′-TCAGCTCAGGGATGACCTTG-3′. The relative expression level was calculated using the 2−ΔΔCq method (26), where ΔCq=Cq (gene of interest)-Cq (housekeeping gene). GAPDH was used as a housekeeping gene. All reactions were performed in triplicate.
Statistical analysis
SPSS v15.0 software (SPSS Inc., Chicago, IL, USA) was used for statistical analysis in the present study. Data are presented as the mean ± standard deviation. Two-tailed Student's t-test was applied to compare the differences between two groups. P<0.05 was considered to indicate a statistically significant difference.
Results
Differential expression analysis
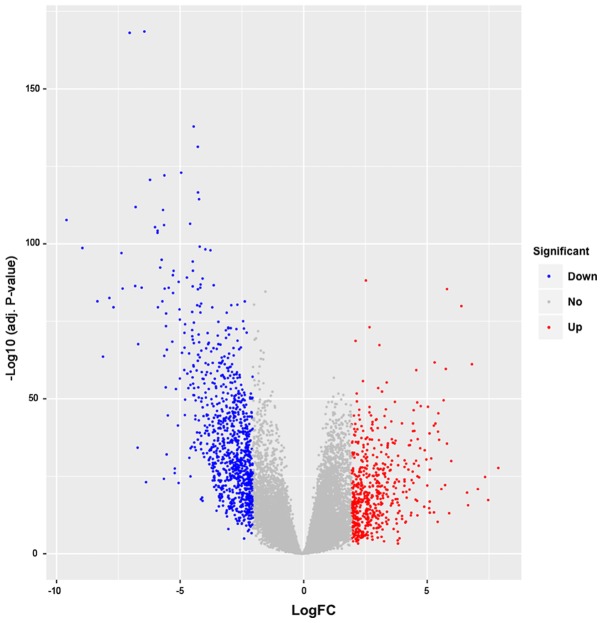
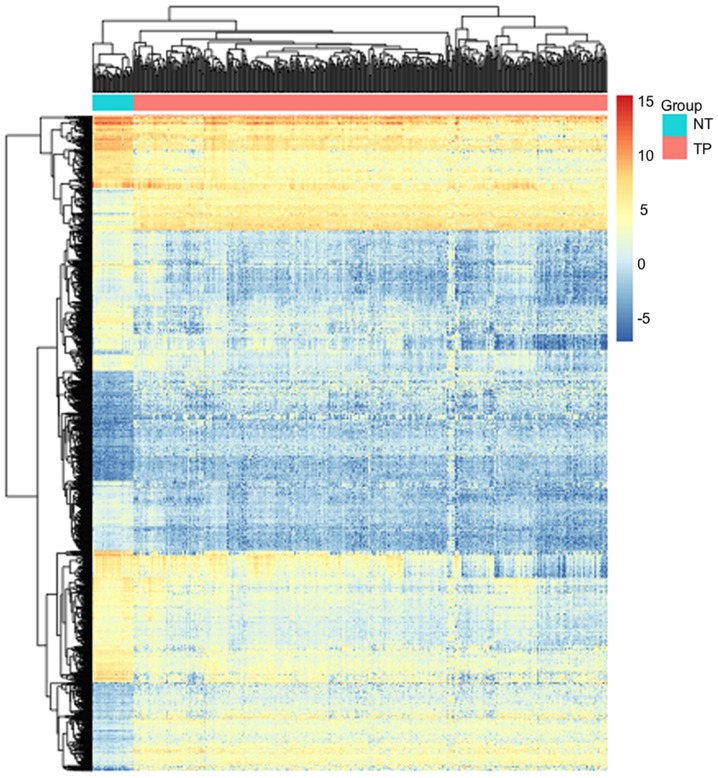
Using FDR<0.05 and |log FC|≥2, a total of 1,519 DEGs, including 568 upregulated genes and 951 downregulated genes, were identified in the tumor samples. The number of downregulated genes was higher compared with that of the upregulated genes. A volcano plot and heatmap of the DEGs are presented in Figs. 1 and 2, respectively.
Figure 1.
Volcano plot of the DEGs. Red dots represent the upregulated genes and blue dots represent downregulated genes. Grey dots are non-DEGs. DEGs, differentially expressed genes; FC, fold-change.
Figure 2.
Heatmap of the differentially expressed genes. Red and blue sample strips represent samples from TP and NT, respectively. The scale represents the expression levels of the DEGs. TP, tumor patient; NT, non-tumor patient.
Functional and pathway enrichment analysis
Based on the clusterProfiler package, a total of 344 GO_BP terms, 37 GO_CC terms, 66 GO_MF terms and 35 KEGG pathways were enriched for the DEGs. The GO terms included ‘complement activation, classical pathway’ (GO_BP; FDR, 7.28×10−41), ‘immunoglobulin complex’ (GO_CC; FDR, 2.36×10⁻²³), and ‘antigen binding’ (GO_MF; FDR, 6.35×10−45). In addition, significant pathways included ‘drug metabolism-cytochrome P450’ (FDR, 6.63×10⁻⁴), ‘cytokine-cytokine receptor interaction’ (FDR, 6.63×10⁻⁴) and ‘chemical carcinogenesis’ (FDR, 6.63×10⁻⁴; Table I).
Table I.
Top five Gene Ontology terms and Kyoto Encyclopedia of Genes and Genomes pathways enriched for the differentially expressed genes.
| Category | ID | Description | FDR | Count |
|---|---|---|---|---|
| BP | GO:0006958 | Complement activation, classical pathway | 7.28×10−41 | 66 |
| BP | GO:0002455 | Humoral immune response mediated by circulating immunoglobulin | 4.39×10−38 | 66 |
| BP | GO:0006956 | Complement activation | 9.99×10−37 | 69 |
| BP | GO:0072376 | Protein activation cascade | 4.04×10⁻³⁵ | 72 |
| BP | GO:0016064 | Immunoglobulin mediated immune response | 3.05×10⁻³⁰ | 70 |
| CC | GO:0019814 | Immunoglobulin complex | 2.36×10⁻²³ | 32 |
| CC | GO:0042571 | Immunoglobulin complex, circulating | 4.44×10⁻²² | 30 |
| CC | GO:0005578 | Proteinaceous extracellular matrix | 7.54×10⁻¹⁷ | 76 |
| CC | GO:0072562 | Blood microparticle | 3.36×10⁻¹⁶ | 50 |
| CC | GO:0009897 | External side of plasma membrane | 1.74×10⁻¹³ | 58 |
| MF | GO:0003823 | Antigen binding | 6.35×10−45 | 84 |
| MF | GO:0004252 | Serine-type endopeptidase activity | 9.37×10⁻²² | 67 |
| MF | GO:0008236 | Serine-type peptidase activity | 1.88×10⁻²⁰ | 69 |
| MF | GO:0017171 | Serine hydrolase activity | 4.34×10⁻²⁰ | 69 |
| MF | GO:0034987 | Immunoglobulin receptor binding | 1.38×10⁻¹⁹ | 29 |
| Pathway | hsa00982 | Drug metabolism-cytochrome P450 | 6.63×10−04 | 17 |
| Pathway | hsa04060 | Cytokine-cytokine receptor interaction | 6.63×10−04 | 39 |
| Pathway | hsa05204 | Chemical carcinogenesis | 6.63×10−04 | 18 |
| Pathway | hsa04976 | Bile secretion | 1.13×10−03 | 16 |
| Pathway | hsa04978 | Mineral absorption | 1.41×10−03 | 13 |
BP, biological process; CC, cellular component; MF, molecular function; FDR, false discovery rate.
Survival analysis and PPI network analysis
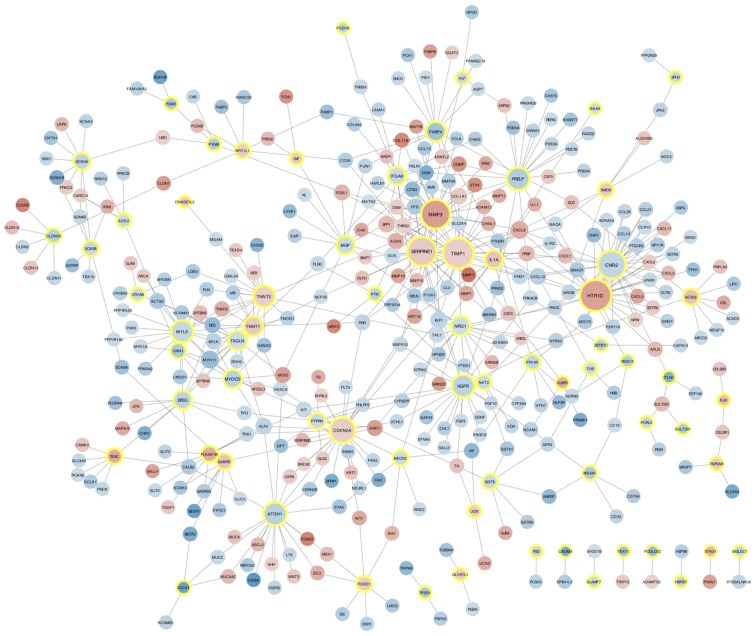
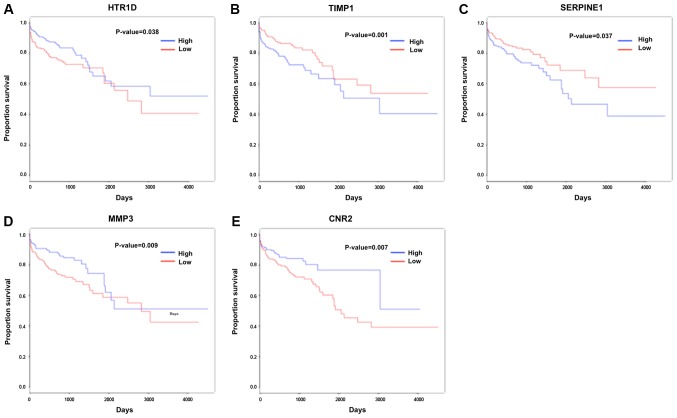
KM survival analysis indicated that 109 DEGs were associated with survival prognosis. For the survival-associated genes, a PPI network, involving 69 survival-associated genes, 309 other DEGs and 547 interactions, was constructed (Fig. 3). HTR1D (degree=34), TIMP (degree=32), SERPINE1 (degree=30), MMP3 (degree=30) and CNR2 (degree=28) were all upregulated and had the highest numbers of interactions with other DEGs in the network. In the PPI network, several interactions among these five genes existed, including HTR1D-CNR2, TIMP1-SERPINE1/MMP3 and SERPINE1-MMP3. Furthermore, the five key nodes were all identified as survival-associated genes and their KM survival curves are presented in Fig. 4.
Figure 3.
Protein-protein interaction network. Red and blue nodes represent upregulated genes and downregulated genes, respectively. The yellow-edged nodes represent survival-associated genes.
Figure 4.
Survival analyses. Kaplan-Meier survival curves for (A) HTR1D (P=0.038), (B) TIMP1 (P=0.001), (C) SERPINE1 (P=0.037), (D) MMP3 (P=0.009) and (E) CNR2 (P=0.007). Red and blue represent low and high expression groups, respectively. HTR1D, hydroxytryptamine receptor 1D; TIMP1, TIMP metallopeptidase inhibitor 1; SERPINE1, serpin family E member 1; MMP3, matrix metallopeptidase 3; CNR2, cannabinoid receptor 2.
Expression levels of HTR1D, TIMP1, SERPINE1, MMP3 and CNR2 in CRC and normal tissues
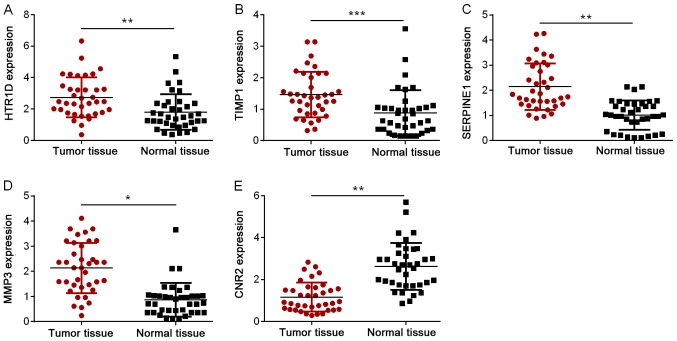
To further identify the roles of HTR1D, TIMP1, SERPINE1, MMP3, and CNR2 in CRC, the mRNA expression levels of these genes in 37 paired CRC tissues and normal tissues were examined by RT-qPCR. As presented in Fig. 5A-D, the expression levels of HTR1D, TIMP1, SERPINE1 and MMP3 were significantly increased in CRC tumor tissues compared with normal tissues (P<0.05). Furthermore, the expression of CNR2 was significantly decreased in CRC tumor tissues compared with normal tissues (P<0.01; Fig. 5E).
Figure 5.
Expression levels of key genes in CRC tissue samples and normal tissue samples. The expression levels of (A) HTR1D, (B) TIMP1, (C) SERPINE1, (D) MMP3 and (E) CNR2 in CRC tissues and normal tissues were examined by RT-qPCR. Data are presented as the mean ± standard deviation. *P<0.05, **P<0.01 and ***P<0.001. HTR1D, hydroxytryptamine receptor 1D; TIMP1, TIMP metallopeptidase inhibitor 1; SERPINE1, serpin family E member 1; MMP3, matrix metallopeptidase 3; CNR2, cannabinoid receptor 2; CRC, colorectal cancer; RT-qPCR, reverse transcription-quantitative polymerase chain reaction.
Discussion
In the present study, 1,519 DEGs, including 568 upregulated genes and 951 downregulated genes, were identified between COAD samples and normal samples. Subsequently, several functional terms and pathways were predicted for the DEGs. Among the DEGs, 109 genes were revealed to be associated with the survival prognosis of patients with COAD. In the PPI network for the survival-associated genes, HTR1D, TIMP1, SERPINE1, MMP3 and CNR2 exhibited the highest degrees. The RNA expression levels of HTR1D, TIMP1, SERPINE1 and MMP3 were also investigated and identified to be significantly increased in CRC tumor tissues, while the expression of CNR2 was significantly decreased.
MMP9 and TIMP1 expression levels are significantly higher in CRC tissues compared with that in normal tissues, and a decreased expression of TIMP1 is significantly associated with an adverse prognosis for patients with CRC (27,28). TIMP1-inhibition suppresses proliferation and metastasis but promotes apoptosis through the focal adhesion kinase-phosphatidylinositol-3 kinase (PI3K)/AKT and mitogen-activated protein kinase pathway; therefore, TIMP1 may be a prognostic marker for colon cancer (29). High levels of carcino-embryonic antigen and TIMP1 are associated with a short overall survival time of patients with CRC, particularly the plasma level of TIMP1 as it serves as a potential prognostic indicator in CRC (30,31). An increased serum level of TIMP1 is detected in patients with advanced stage colon cancer and a high tumor grade, indicating that TIMP1 serves as an independent prognostic factor in the tumor (32). Therefore, TIMP1 may be associated with the survival of patients with COAD.
HTR1D acts during cell invasion through the axin1/β-catenin/MMP7 pathway and serves an important role in the lung metastasis of CRC (33). Serotonin and CP93129 dihydrochloride (a HTR1B agonist) promotes proliferation of CRC HT29 cells, and SB224289 hydrochloride (also a HTR1B agonist) exhibits anti-proliferative and apoptotic influences on the cells, suggesting that HTR1B may serve a critical role in CRC (34). Aryl hydrocarbon receptor nuclear translocator like 2 and SERPINE1 exhibit higher expression levels in CRC, which is associated with the invasion of tumor cells (35). Upregulated SERPINE1 in intestinal epithelial cells is conducive to the proneoplastic roles of extracellular signal-regulated kinase signaling, and thus SERPINE1 is a potential target for the treatment of CRC (36). This indicates that HTR1D and SERPINE1 may have influences on the prognosis of COAD.
Celastrol suppresses tumor cell proliferation and migration by reducing MMP3 and MMP7 expression through the PI3K/AKT pathway and thus exerts antitumor effects in CRC (37). The activation of cannabinoid receptors CB1 or CB2 (also termed CNR2) leads to cell apoptosis via ceramide synthesis in colon cancer, in which TNF-α serves a connective role (38,39). CB2 agonist can induce E-cadherin downregulation and snail family zinc finger 1 upregulation in HT29 cells, and CB2 expression serves as a poor indicator for the prognosis of colon cancer (40). Therefore, MMP3 and CNR2 may serve roles in the clinical outcome of patients with COAD.
In conclusion, 1,509 DEGs between COAD and normal samples were screened in the present study. In addition, several key genes, including HTR1D, TIMP1, SERPINE1, MMP3 and CNR2, may be associated with the prognosis of patients with COAD. However, the roles and mechanisms of these five genes in COAD need to be investigated and confirmed in future studies.
Acknowledgements
Not applicable.
Funding
This study was supported by grants from the Natural Science Foundation of China (grant nos. 81660404 and 81560398) and the Natural Science Foundation of Jiangxi Province (grant nos. 20161BAB205244 and 20161ACG70014).
Availability of data and materials
The datasets used and/or analyzed during the current study are available from the corresponding author on reasonable request.
Authors' contributions
CZ contributed to the conception of the study and wrote the manuscript. YZ performed the data analyses. Both authors read and approved the final manuscript.
Ethics approval and consent to participate
Ethical approval for the present study was obtained from the Ethics Committee of the First Affiliated Hospital of Nanchang University (Nanchang, China). Written informed consent was obtained from all study subjects.
Patient consent for publication
Not applicable.
Competing interests
The authors declare that they have no competing interests.
References
- 1.Weitz J, Koch M, Debus J, Höhler T, Galle PR, Büchler MW. Colorectal cancer. Lancet. 2005;365:153–165. doi: 10.1016/S0140-6736(05)17706-X. [DOI] [PubMed] [Google Scholar]
- 2.Walker MS, Pharm EY, Kerr J, Yim YM, Stepanski EJ, Schwartzberg LS. Symptom burden & quality of life among patients receiving second-line treatment of metastatic colorectal cancer. BMC Res Notes. 2012;5:314. doi: 10.1186/1756-0500-5-314. [DOI] [PMC free article] [PubMed] [Google Scholar]
- 3.Andreu M, Marzo M, Mascort J, Quintero E, García-Alfonso P, López-Ibor C, Castells T, Pérez Segura P. Colorectal cancer prevention. Clin Transl Oncol. 2009;11:65–66. doi: 10.1007/s12094-009-0314-1. [DOI] [PubMed] [Google Scholar]
- 4.Center MM, Jemal A, Ward E. International trends in colorectal cancer incidence rates. Cancer Epidemiol Biomarkers Prev. 2009;18:1688–1694. doi: 10.1158/1055-9965.EPI-09-0090. [DOI] [PubMed] [Google Scholar]
- 5.Mcguire S. World Cancer Report 2014. Geneva, Switzerland: World Health Organization, international agency for research on cancer, WHO press, 2015. Adv Nutr. 2016;7:418. doi: 10.3945/an.116.012211. [DOI] [PMC free article] [PubMed] [Google Scholar]
- 6.Como JA, Mahendraraj K, Lau CS, Chamberlain RS. Adenosquamous carcinoma of the colon and rectum: A population based clinical outcomes study involving 578 patients from the Surveillance Epidemiology and End Result (SEER) database (1973–2010) J Am Coll Surg. 2015;221:e56. doi: 10.1016/j.jamcollsurg.2015.08.044. [DOI] [Google Scholar]
- 7.Bray F, Ferlay J, Soerjomataram I, Siegel RL, Torre LA, Jemal A. Global cancer statistics 2018: GLOBOCAN estimates of incidence and mortality worldwide for 36 cancers in 185 countries. CA Cancer J Clin. 2018;68:394–424. doi: 10.3322/caac.21492. [DOI] [PubMed] [Google Scholar]
- 8.Pallante P, Terracciano L, Carafa V, Schneider S, Zlobec I, Lugli A, Bianco M, Ferraro A, Sacchetti S, Troncone G, et al. The loss of the CBX7 gene expression represents an adverse prognostic marker for survival of colon carcinoma patients. Eur J Cancer. 2010;46:2304–2313. doi: 10.1016/j.ejca.2010.05.011. [DOI] [PubMed] [Google Scholar]
- 9.Kim YJ, Kang HB, Yim HS, Kim JH, Kim JW. NDRG2 positively regulates E-cadherin expression and prolongs overall survival in colon cancer patients. Oncol Rep. 2013;30:1890–1898. doi: 10.3892/or.2013.2642. [DOI] [PubMed] [Google Scholar]
- 10.Kim YJ, Yoon SY, Kim JT, Choi SC, Lim JS, Kim JH, Song EY, Lee HG, Choi I, Kim JW. NDRG2 suppresses cell proliferation through down-regulation of AP-1 activity in human colon carcinoma cells. Int J Cancer. 2009;124:7–15. doi: 10.1002/ijc.23945. [DOI] [PubMed] [Google Scholar]
- 11.Miyoshi N, Yamamoto H, Mimori K, Yamashita S, Miyazaki S, Nakagawa S, Ishii H, Noura S, Ohue M, Yano M, et al. ANXA9 gene expression in colorectal cancer: A novel marker for prognosis. Oncol Lett. 2014;8:2313–2317. doi: 10.3892/ol.2014.2477. [DOI] [PMC free article] [PubMed] [Google Scholar]
- 12.Kontos CK, Papadopoulos IN, Scorilas A. Quantitative expression analysis and prognostic significance of the novel apoptosis-related gene BCL2L12 in colon cancer. Biol Chem. 2008;389:1467–1475. doi: 10.1515/BC.2008.173. [DOI] [PubMed] [Google Scholar]
- 13.Zhan J, Niu M, Wang P, Zhu X, Li S, Song J, He H, Wang Y, Xue L, Fang W, Zhang H. Elevated HOXB9 expression promotes differentiation and predicts a favourable outcome in colon adenocarcinoma patients. Br J Cancer. 2014;111:883–893. doi: 10.1038/bjc.2014.387. [DOI] [PMC free article] [PubMed] [Google Scholar]
- 14.Maekawa S, Suzuki A, Sugano S, Suzuki Y. RNA sequencing: From sample preparation to analysis. Methods Mol Biol. 2014;1164:51–65. doi: 10.1007/978-1-4939-0805-9_6. [DOI] [PubMed] [Google Scholar]
- 15.Servant N, Roméjon J, Gestraud P, La Rosa P, Lucotte G, Lair S, Bernard V, Zeitouni B, Coffin F, Jules-Clément G, et al. Bioinformatics for precision medicine in oncology: Principles and application to the SHIVA clinical trial. Front Genet. 2014;5:152. doi: 10.3389/fgene.2014.00152. [DOI] [PMC free article] [PubMed] [Google Scholar]
- 16.Colaprico A, Silva TC, Olsen C, Garofano L, Cava C, Garolini D, Sabedot TS, Malta TM, Pagnotta SM, Castiglioni I, et al. TCGAbiolinks: An R/Bioconductor package for integrative analysis of TCGA data. Nucleic Acids Res. 2015;44:e71. doi: 10.1093/nar/gkv1507. [DOI] [PMC free article] [PubMed] [Google Scholar]
- 17.Ritchie ME, Phipson B, Wu D, Hu Y, Law CW, Shi W, Smyth GK. limma powers differential expression analyses for RNA-sequencing and microarray studies. Nucleic Acids Res. 2015;43:e47. doi: 10.1093/nar/gkv007. [DOI] [PMC free article] [PubMed] [Google Scholar]
- 18.Lindblom A. Improved tumor staging in colorectal cancer. N Engl J Med. 1998;339:264–265. doi: 10.1056/NEJM199807233390410. [DOI] [PubMed] [Google Scholar]
- 19.Huntley R, Dimmer E, Barrell D, Binns D, Apweiler R. The Gene Ontology Annotation (GOA) database. Nat Preced. 2009;10:429–438. doi: 10.1093/nar/gkn803. [DOI] [PMC free article] [PubMed] [Google Scholar]
- 20.Kanehisa M, Goto S. KEGG: Kyoto encyclopedia of genes and genomes. Nucleic Acids Res. 2000;27:29–34. doi: 10.1093/nar/27.1.29. [DOI] [PMC free article] [PubMed] [Google Scholar]
- 21.Yu G, Wang LG, Han Y, He QY. clusterProfiler: An R package for comparing biological themes among gene clusters. OMICS. 2012;16:284–287. doi: 10.1089/omi.2011.0118. [DOI] [PMC free article] [PubMed] [Google Scholar]
- 22.Luo W, Brouwer C. Pathview: An R/Bioconductor package for pathway-based data integration and visualization. Bioinformatics. 2013;29:1830–1831. doi: 10.1093/bioinformatics/btt285. [DOI] [PMC free article] [PubMed] [Google Scholar]
- 23.Stel VS, Dekker FW, Tripepi G, Zoccali C, Jager KJ. Survival analysis I: The Kaplan-Meier method. Nephr Clin Pract. 2011;119:c255–c260. doi: 10.1159/000328916. [DOI] [PubMed] [Google Scholar]
- 24.Szklarczyk D, Morris JH, Cook H, Kuhn M, Wyder S, Simonovic M, Santos A, Doncheva NT, Roth A, Bork P, et al. The STRING database in 2017: Quality-controlled protein-protein association networks, made broadly accessible. Nucleic Acids Res 45 (Database Issue) 2017:D362–D368. doi: 10.1093/nar/gkw937. [DOI] [PMC free article] [PubMed] [Google Scholar]
- 25.Kohl M, Wiese S, Warscheid B. Cytoscape: Software for visualization and analysis of biological networks. Methods Mol Biol. 2011;696:291–303. doi: 10.1007/978-1-60761-987-1_18. [DOI] [PubMed] [Google Scholar]
- 26.Morán A, Iniesta P, García-Aranda C, De Juan C, Díaz-López A, Sánchez-Pernaute A, Torres AJ, Díaz-Rubio E, Balibrea JL, Benito M. Clinical relevance of MMP-9, MMP-2, TIMP-1 and TIMP-2 in colorectal cancer. Oncol Rep. 2005;13:115–120. [PubMed] [Google Scholar]
- 27.Işlekel H, Oktay G, Terzi C, Canda AE, Füzün M, Küpelioğlu A. Matrix metalloproteinase-9, −3 and tissue inhibitor of matrix metalloproteinase-1 in colorectal cancer: Relationship to clinicopathological variables. Cell Biochem Funct. 2007;25:433–441. doi: 10.1002/cbf.1325. [DOI] [PubMed] [Google Scholar]
- 28.Livak KJ, Schmittgen TD. Analysis of relative gene expression data using real-time quantitative PCR and the 2(-Delta Delta C(T)) method. Methods. 2001;25:402–408. doi: 10.1006/meth.2001.1262. [DOI] [PubMed] [Google Scholar]
- 29.Song G, Xu S, Zhang H, Wang Y, Xiao C, Jiang T, Wu L, Zhang T, Sun X, Zhong L, et al. TIMP1 is a prognostic marker for the progression and metastasis of colon cancer through FAK-PI3K/AKT and MAPK pathway. J Exp Clin Cancer Res. 2016;35:148. doi: 10.1186/s13046-016-0427-7. [DOI] [PMC free article] [PubMed] [Google Scholar]
- 30.Birgisson H, Nielsen HJ, Christensen IJ, Glimelius B, Brünner N. Preoperative plasma TIMP-1 is an independent prognostic indicator in patients with primary colorectal cancer: A prospective validation study. Eur J Cancer. 2010;46:3323–3331. doi: 10.1016/j.ejca.2010.06.009. [DOI] [PubMed] [Google Scholar]
- 31.Nielsen HJ, Brünner N, Jorgensen LN, Olsen J, Rahr HB, Thygesen K, Hoyer U, Laurberg S, Stieber P, Blankenstein MA, et al. Plasma TIMP-1 and CEA in detection of primary colorectal cancer: A prospective, population based study of 4509 high-risk individuals. Scand J Gastroenterol. 2011;46:60–69. doi: 10.3109/00365521.2010.513060. [DOI] [PubMed] [Google Scholar]
- 32.Giaginis C, Nikiteas N, Margeli A, Tzanakis N, Rallis G, Kouraklis G, Theocharis S. Serum tissue inhibitor of metalloproteinase 1 and 2 (TIMP-1 and TIMP-2) levels in colorectal cancer patients: Associations with clinicopathological variables and patient survival. Int J Biol Markers. 2010;24:245–252. doi: 10.1177/172460080902400405. [DOI] [PubMed] [Google Scholar]
- 33.Sui H, Xu H, Ji Q, Liu X, Zhou L, Song H, Zhou X, Xu Y, Chen Z, Cai J, et al. 5-hydroxytryptamine receptor (5-HT1DR) promotes colorectal cancer metastasis by regulating Axin1/β-catenin/MMP-7 signaling pathway. Oncotarget. 2015;6:25975–25987. doi: 10.18632/oncotarget.4543. [DOI] [PMC free article] [PubMed] [Google Scholar]
- 34.Ataee R, Ajdary S, Zarrindast M, Rezayat M, Hayatbakhsh MR. Anti-mitogenic and apoptotic effects of 5-HT1B receptor antagonist on HT29 colorectal cancer cell line. J Cancer Res Clin Oncol. 2010;136:1461–1469. doi: 10.1007/s00432-010-0801-3. [DOI] [PubMed] [Google Scholar]
- 35.Mazzoccoli G, Pazienza V, Panza A, Valvano MR, Benegiamo G, Vinciguerra M, Andriulli A, Piepoli A. ARNTL2 and SERPINE1: Potential biomarkers for tumor aggressiveness in colorectal cancer. J Cancer Res Clin Oncol. 2012;138:501–511. doi: 10.1007/s00432-011-1126-6. [DOI] [PubMed] [Google Scholar]
- 36.Bergeron S, Lemieux E, Durand V, Cagnol S, Carrier JC, Lussier JG, Boucher MJ, Rivard N. The serine protease inhibitor serpinE2 is a novel target of ERK signaling involved in human colorectal tumorigenesis. Mol Cancer. 2010;9:271. doi: 10.1186/1476-4598-9-271. [DOI] [PMC free article] [PubMed] [Google Scholar]
- 37.Bufu T, Di X, Yilin Z, Gege L, Xi C, Ling W. Celastrol inhibits colorectal cancer cell proliferation and migration through suppression of MMP3 and MMP7 by the PI3K/AKT signaling pathway. Anticancer Drugs. 2018;29:530–538. doi: 10.1097/CAD.0000000000000621. [DOI] [PubMed] [Google Scholar]
- 38.Cianchi F, Papucci L, Schiavone N, Lulli M, Magnelli L, Vinci MC, Messerini L, Manera C, Ronconi E, Romagnani P, et al. Cannabinoid receptor activation induces apoptosis through tumor necrosis factor alpha-mediated ceramide de novo synthesis in colon cancer cells. Clin Cancer Res. 2008;14:7691–7700. doi: 10.1158/1078-0432.CCR-08-0799. [DOI] [PubMed] [Google Scholar]
- 39.Perna F, Bechi P, Perigli G, Manera C, Schiavone N, Papucci L, Magnelli L, Masini M, Lulli M, Donnini M, et al. Cannabinoids induces apoptosis in human colon cancer cells via CB2 receptor activation. Dig Liver Dis. 2006;38(Suppl 1):S107–S108. doi: 10.1016/S1590-8658(06)80287-2. [DOI] [Google Scholar]
- 40.Martínez-Martínez E, Gómez I, Martín P, Sánchez A, Román L, Tejerina E, Bonilla F, Merino AG, de Herreros AG, Provencio M, García JM. Cannabinoids receptor type 2, CB2, expression correlates with human colon cancer progression and predicts patient survival. Oncoscience. 2015;2:131–141. doi: 10.18632/oncoscience.119. [DOI] [PMC free article] [PubMed] [Google Scholar]
Associated Data
This section collects any data citations, data availability statements, or supplementary materials included in this article.
Data Availability Statement
The datasets used and/or analyzed during the current study are available from the corresponding author on reasonable request.


