The Humphrey visual field (HVF) analyzer (Carl Zeiss Meditec Dublin, CA) produces stimuli, which can vary in brightness between 0.08 and 10,000 apostilbs (asb). Threshold sensitivity at each measured point is represented in decibels (dB) in the numeric form and graphical representation in the grayscale form.[1]
The raw or numeric data displayed in the HVF printout represents the patient's retinal sensitivity or the threshold values at the specific retinal points in dB, arranged in the spatial locations of the test grid. In the HVF perimetry printout, a value of 0 dB or <0 dB [Fig. 1] equates to no sensitivity measured and indicates that the patient was unable to perceive the maximum stimulus luminance (10,000 asb) which the perimeter can generate, as seen in advanced glaucoma.[2]
Figure 1.

A reliable HVF printout of the right eye of a patient with advanced glaucoma shows that the majority of the retinal sensitivity is at 0 dB or <0 dB in the raw data and the grayscale shows corresponding dark black symbolic representation
In the grayscale data, the ranges of sensitivity values are banded into 5 dB grouping and represented by different shades of gray, that is, dark colors or black represent low sensitivity and the lighter tone colors represent high sensitivity.
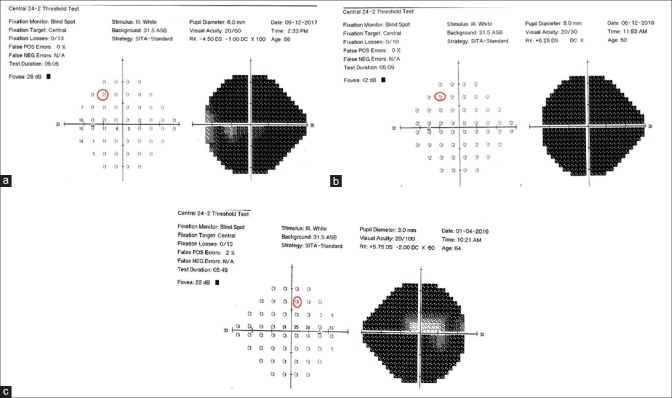
With time as the HVF perimeter bulb becomes old and dim, the maximum stimulus intensity projected by the perimeter is not 10,000 asb and the threshold value in the raw data can appear as <1 dB [Fig. 2a], <2 dB [Fig. 2b], or <3 dB [Fig. 2c] over a period of time (September 2017 to January 2019). Hence, the exact depth of the scotoma is not known and the corresponding symbolic representation of the Grayscale does not appear dark black but shows lighter shade of gray as the scotoma falls in a different banded range.
Figure 2.
Reliable HVFs of 3 eyes with advanced glaucoma shows that the majority of the retinal sensitivity is at <1 dB (a) and <2 dB (b) and <3 dB (c) in the raw data of the printout and the grayscale shows lighter color of black as symbolic representation
Financial support and sponsorship
Nil.
Conflicts of interest
There are no conflicts of interest.
References
- 1.Anderson DR, Patella VM. Automated Static Perimetry. 2nd ed. St. Louis: Mosby; 1999. p. 136. [Google Scholar]
- 2.Wyatt HJ, Dul MW, Swanson WH. Variability of visual field measurements is correlated with the gradient of visual sensitivity. Vision Res. 2007;47:925–36. doi: 10.1016/j.visres.2006.12.012. [DOI] [PMC free article] [PubMed] [Google Scholar]


