

Abstract
The differentiation of pluripotent stem cells in three-dimensional cultures can recapitulate key aspects of brain development, but protocols are prone to variable results. Here we differentiated multiple human pluripotent stem cell lines for over 100 d using our previously developed approach to generate brain-region-specific organoids called cortical spheroids and, using several assays, found that spheroid generation was highly reliable and consistent. We anticipate the use of this approach for large-scale differentiation experiments and disease modeling.
Recent progress in stem cell technologies that enabled the generation of three-dimensional (3D) cultures from human pluripotent stem cells (hPSCs) promise to accelerate our understanding of human brain development and disease1–3. Because these 3D culture preparations are intended to model the cellular architecture of organs closely, they are known as organoids or organ spheroids2. For the central nervous system, organoids can display high cell diversity, recapitulate more complex cell–cell interactions among brain regions, develop to later stages than 2D cultures, and model brain disorders when patient-derived hPSCs are used4–9. However, one of the challenges of applying brain organoids for disease modeling and for ultimately running large-scale drug and genetic screens is low reproducibility of differentiation1. Therefore, assessing reliability of 3D neural differentiation across multiple hiPSC lines and replicate differentiations of the same lines over long periods of time in vitro is essential to determine what questions can be addressed using this platform.
We have previously developed a directed differentiation method for specifying pyramidal cortical neurons from human induced pluripotent stem cells (hiPSC) in a 3D culture that resembles the cerebral cortex10,11. These brain-region-specific organoid cultures called human cortical spheroids (hCS), contain functional glutamatergic neurons of deep and superficial cortical layers and nonreactive astrocytes and can be maintained for very long periods of time (beyond 25 months)7. Moreover, this approach is simple and versatile: it involves no embedding in an extracellular matrix and allows other brain regions to be patterned and optionally fused into multi-region spheroids known as assembloids12.
Here, we used single cell analyses, transcriptional profiling and immunocytochemistry during long-term in vitro differentiation to assess the reliability of hCS derivation across multiple hiPSC lines and experiments (Fig. 1a). We cultured hiPSCs in feeder-free and xeno-free conditions on human recombinant vitronectin in Essential 8 medium (n= 15 lines derived from 13 individuals; Supplementary Fig. 1a and Supplementary Table 1 show all hiPSC lines and assays). To derive hCS in feeder-free conditions (hCS-FF), we then aggregated single-cell-dissociated hiPSCs in AggreWell-800™ plates to obtain uniform 3D spheroids, each containing ~10,000 cells (Fig. 1b,c, Methods and Supplementary Fig. 1a). Subsequently, we applied small molecules that modulate the SMAD and Wnt pathways and the growth factors EGF and FGF2 to achieve directed differentiation. After 25 days of differentiation, hCS-FF showed strong transcriptional upregulation of the forebrain markers FOXG1, SIX3 and PAX6, in the absence of endoderm (SOX17) and mesoderm (BRACH) markers (n= 6–12 hiPSC lines from 11 individuals; Fig. 1d; Supplementary Fig. 1b–d; Supplementary Table 2). Moreover, hCS did not express hypothalamus (RAX) or spinal cord (HOXB4) markers, while expression of the ventral forebrain related genes NXK2.1 or GSX2 or the midbrain marker FOXA2 was absent in 11 out of 12 differentiated hiPSC lines (Fig. 1d).
Figure 1. Success of differentiation and transcriptional reliability of human cortical spheroids.
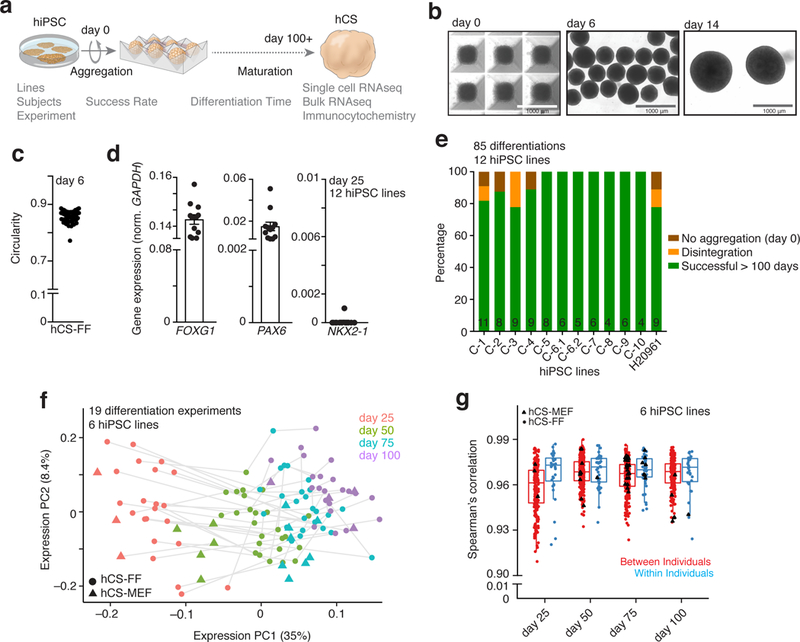
a, Scheme illustrating the derivation of hCS-FF from hPSCs and the assays used. b, Representative images of neural spheroids at day 0, 6 and 14 of differentiation. c, Circularity (4p × area/perimeter2) of day 6 neural spheroids derived from 4 hiPSC lines. A value of 1.0 indicates a perfect circle. d, Gene expression of FOXG1, PAX6, NKX2.1 relative to GAPDH in hCS-FF at day 25 of Differentiation (n = 12 hiPSC lines from 11 subjects). Mean ± s.e.m. are shown. e, Percentage of successful differentiations up to 100 days for 12 hiPSC lines (n= 85 experiments; number per line indicated inside bars). f, Principal component analysis of hCS-FF and hCS-MEF at 4 stages of in vitro differentiation. Differentiation of the same line are indicated by a gray line (days 25, 50, 75, 100: n = 22, 25, 25, 22 hCS-FF and 3, 5, 8, 4 hCS-MEF samples, respectively). g, Spearman’s correlation of samples obtained from different individuals (between individuals) or from multiple differentiations of the same hiPSC lines (within individual); two-sided Wilcoxon–Mann–Whitney test, P< 0.03. Day 25, 50, 75, 100: n = 202, 269, 281, 206 samples (between individual) and 33, 41, 47, 31 samples (within individuals), respectively. Middle hinge corresponds to median, and lower and upper hinges correspond to first and third quartiles. RNA-seq data in f and g were obtained from n = 6 hiPSC lines derived from 6 individuals and differentiated in multiple independent differentiation experiments each.
To assess the overall success of differentiation across hiPSC lines and experiments, we carried out 4–11 differentiations with each of 12 hiPSC lines, for a total of 85 experiments. We found that in 90% of differentiations, hCS-FF could be maintained successfully for over 100 days in vitro (Fig. 1e). Spheroids showed an internal cytoarchitecture that included proliferative zones and expression of cortical neuron markers (Supplementary Fig. 2a–d). Moreover, hCS-FF were healthy over long-term cultures as shown by immunostaining with cleaved Caspase 3 (c-Cas3) in hCS-FF derived from an TUBA1B-mEGFP hiPSC line (Supplementary Fig. 2e). Approximately 5% of cultures did not aggregate in the first 24 h, and another 5% of cultures disintegrated over time (most commonly in the first 20 days) (Fig. 1e, Supplementary Fig. 1a). Overall, generation of hCS-FF was scalable, with one person being able to start differentiations of 10–15 hiPSC lines on a weekly basis and maintain these cultures for over 100 days.
We next performed RNA-seq on hCS-FF collected at 4 different stages of differentiation of 6 different hiPSC lines in at least 3 independent experiments (Supplementary Table 3). We used a rank-rank hypergeometric overlap (RRHO) test13 to assess similarity between changes in hCS (n= 6 n = 6 hiPSC lines) from an earlier stage (day 25) to a late stage (day 100) and changes between two time points in the developing human cerebral cortex14 (Supplementary Fig. 3a,b). Similar to our previous transcriptomic data on hCSs derived from hPSCs cultured on mouse embryonic fibroblasts (hCS-MEF), we observed a high overlap between hCS-FF at day 100 of differentiation and those at mid-gestation stages of development (up to post-conception week (PCW) 24). We next use principal component (PC) analysis to verify transcriptional variance between different differentiations of six hiPSC lines over time (Fig. 1f). PC1 explained 35% of the variance and was related to the stage of in vitro differentiation, while PC2 explained 8.4% of the variance and was related to different hiPSC lines, suggesting that this protocol is reproducible across multiple individual hiPSC, differentiation protocols (FF versus MEF) and replicate differentiations. This is also illustrated by the high Spearman’s correlation coefficients (mean >0.96) between differentiations of the same cell line (within individuals) or between different hiPSC lines (between individuals) (Wilcoxon–Mann–Whitney test, P < 0.05; Fig. 1g), for matched differentiation days. Previous work on forebrain organoids reported a mean Spearman’s correlation coefficient in the range of 0.75–0.85 between and within individuals5. Interestingly, the variability was higher at earlier stages of differentiation, but decreased with differentiation time (Fig. 1f).
To comprehensively characterize hCS-FF, we next performed single-cell transcriptional profiling at day 105 of differentiation using stochastic barcoding15 and compared them to hCS-MEF and spheroids resembling the subpallium (hSS), as previously described12 (n = 24,237 cells; BD Rhapsody™ system). As expected, clustering of cells isolated from either the hCS or hSS using the t-distributed stochastic neighbor embedding (tSNE) approach revealed a separation of the dorsal and ventral conditions (Fig. 2a).
Figure 2. Single-cell characterization of human cortical spheroids.
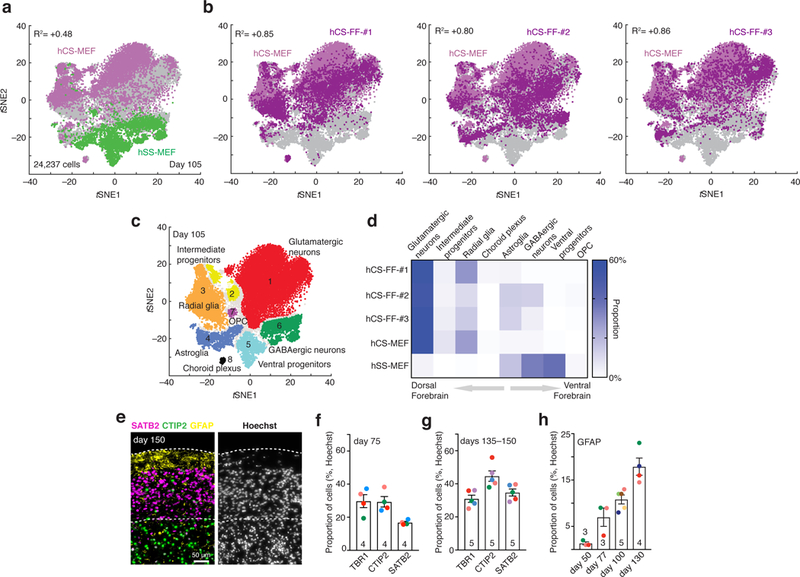
a,b, Single-cell profiling of hCS-MEF (n = 7,340 cells) and hSS-MEF n = 4,771 cells) (a) versus hCS-FF derived from 3 different individuals (hCS-FF-1, n = 4,649 cells; hCS-FF-2, n = 4,389 cells; hCS-FF-3, n = 3,088 cells) (b) at day 105 of differentiation. The correlation (log10 transformed mean of molecules per cell per gene) between total hCS-MEF and each of the hCS-MEF cultures or hSS-MEF is indicated. c,d, Clustering (c) and proportions (d) of all single cells across conditions (glutamatergic neuron cluster 1, n = 11,367 cells; intermediate progenitor cluster 2, n = 1,018 cells; radial glia cluster 3, n = 4,217 cells; astroglia cluster 4, n = 2,036 cells; ventral progenitor cluster 5, n = 1,915 cells; GABAergic neuron cluster 6, n = 2,520 cells; OPC cluster 7, n = 194 cells; choroid plexus cluster 8, n = 170 cells; 800 cells not assigned to a cluster). e, Representative cryosection at day 150 of differentiation stained for deep (CTIP2) and superficial (SATB2) neuronal markers and the glial marker GFAP. f,g, Proportion of cells expressing layer-specific cortical markers (TBR1, CTIP2, SATB2) at day 75 (f) and days 135ȓ150 (g) of differentiation from 4–5 hiPSC lines derived from 4–5 individuals (two-way ANOVA, F2,21 = 5.44, P = 0.01 for interaction; mean ± s.e.m. are shown; sample size indicated on each column). h, Developmental time course for GFAP+ cell generation, quantified in dissociated hCSs (n = 3–5 hiPSC lines per time point from 7 hiPSC lines derived from 6 individuals); ANOVA F3,11 = 21.89, P < 0.0001; mean ± s.e.m.).
Neurons expressing STMN2 were localized in a region of the tSNE space distinct from progenitors and mitotically active cells (Supplementary Fig. 4a) and no cells with a mesodermal or endodermal identity were found. Cells from hCS-FF derived from 3 hiPSC lines derived from 2 individuals clustered closely to the dorsal forebrain fate (hCS-MEF) and separate from ventral forebrain fate (hSS-MEF). The correlation (log10 transformed mean of molecules per cell per gene) between hCS-MEF and each of the hCS-MEF cultures was higher than R2= 0.8, while the correlation with hSS was R2= 0.4 (Fig. 2b; Supplementary Fig. 4b). The proportion of cortical glutamatergic neurons varied between 54% and 59% of all cells in the four hCS samples. One of the hCS samples (hCS-FF-#2) included some GABAergic neurons, which is consistent with our observation that minor ventralization can sometime occur (Fig. 1d). We have previously shown that choroid plexus cells are rare in hCS (1–2%)12, and here we found that two of the lines did not include choroid cells. Overall, the distribution of the cells in the 8 main clusters (Fig. 2c, Supplementary Table 4) that we previously identified in forebrain spheroids was similar across hCS conditions (Fig. 2d, Spearman’s R2> 0.78, P< 0.05 for each of the hCS-FF versus hCS-MEF and R2= 0.02 for hSS-MEF versus hCS-MEF). Moreover, temporal trajectories of gene expression for selected cortical markers in whole hCS-FF also indicated that differentiations were consistent (Supplementary Fig. 5). We complemented these analyses by immunocytochemistry and quantified the proportions of specific cell types out of all nuclei in whole-cryosections of hCS-FF at two time points (day 75 and day 135–150). The proportion of layer specific neurons changed with time, with SATB2+ cells being generated mostly at later stages (Fig. 2e–g; two-way ANOVA, F2,21= 5.44, P = 0.01 for interaction; mean ± s.e.m. are shown). Standard deviations for the three cortical layer markers that we quantified at two time points were in the range of 1.4% to 7.82%. Lastly, we explored changes over time in GFAP+ cells, a marker that is expressed early on in radial glia and later in astrocytes in hCS7,10, and found a progressive increase over 6 months in vitro (Fig. 2h; ANOVA F3,11 = 21.89, P < 0.0001).
In slice recordings, we found that all Syn1::mCherry+ neurons fired action potentials and ~70% of cells were capable of generating repetitive action potentials when depolarized (Supplementary Fig. 6a,b; n= 13 cells from two hiPSC lines). The firing activity was tetrodotoxin (TTX) sensitive (Supplementary Fig. 6c). Moreover, all neurons exhibited spontaneous synaptic activity, which was blocked by glutamate antagonists (n= 13 cells; two-sided paired t-test ***P< 0.001; Supplementary Fig. 6d, e). Lastly, we found that blue light can trigger action potentials in neurons expressing Syn1::ChR2-mCherry (Supplementary Fig. 6f, g) and that blue light pulses delivered at increasing rates (8–32 Hz) triggers frequency-dependent action potential failure (Supplementary Fig. 6h–i).
Brain organoids have the potential to recapitulate the cell diversity of the central nervous system in long-term in vitro cultures2. However, this has often been associated with noteworthy variability in studies involving differentiation of the same hPSC line in different experiments or across cell lines from different individuals. Because they derive a large diversity of cell types, including nonectodermal lineages, undirected organoid approaches display more variability of differentiation and bioreactor-based batch effects16,17. This diversity may be useful in mapping disease-associated gene expression, but it also represents a barrier to the development of disease models, which require consistent differentiation of large cohorts of hiPSC lines that often display different differentiation propensities. Here, we assessed the reliability of an hiPSC directed differentiation approach for deriving 3D cultures resembling the dorsal forebrain. This feeder-free, xeno-free approach does not involve cell (re)-plating, embedding into extracellular matrices or culture in complex environments. Using transcriptional time course, immunocytochemistry and single-cell analyses, we found that the derivation of hCS is reliable across multiple hiPSC lines and differentiation experiments. Moreover, these floating cultures are functional and can be maintained for long periods in vitro to capture human corticogenesis and astrogenesis7. This platform can be adapted to specify other brain regions and to derive assembloids, and it can facilitate the development of disease models using patient-derived cells, or of genetic and drug screens.
METHODS:
Culture of hiPSCs
The hiPSC lines used in this study were validated using standardized methods as previously described10,12,18 (Supplementary Table 1). Cultures were tested for and maintained Mycoplasma free. A total of 15 hiPSC lines collected from 13 healthy subjects. Among them, the hiPSCs H20961 line was derived by the Gilad laboratory19 and two mono-allelic mEGFP-tagged hiPSCs lines LMNB1-mEGFP (AICS-0013) and TUBA1B-mEGFP (AICS-0012) were obtained from Coriell. Approval for this study was obtained from the Stanford IRB panel and informed consent was obtained from all subjects.
Generation of hCS-FF from hiPSC
hiPSCs were maintained on six-well plates coated with recombinant human vitronectin (VTN-N, Life Technologies, A14700) in Essential 8™ medium (Life Technologies, A1517001). To coat 6-well plate, 1 ml of vitronectin (diluted at a 1:100 ratio with Dulbecco’s phosphate-buffered saline (DPBS); Life Technologies, 14190) was added per well, and then incubated at room temperature for 1 h. To passage hiPSC (80–90% confluency), cells were rinsed with 3–4 ml DPBS per well, and then 1 ml of 0.5 mM EDTA (Life Technologies, 15575) was added for 7 minutes at room temperature. After removing the EDTA, 2 ml of pre-warmed complete Essential 8™ medium was added to collect cells. The cell suspension was then diluted in Essential 8™ medium (1:6–1:20 depending on the hiPSC line) and distributed in on vitronectin-coated wells.
For the generation of 3D spheroids, hiPSCs were incubated with Accutase (Innovate Cell Technologies, AT-104) at 37ºC for 7 minutes and dissociated into single cells. Optionally, one day prior to spheroid formation, hiPSCs can be exposed to 1% dimethyl sulfoxide (DMSO) in Essential 8™ medium. To obtain uniformly-sized spheroids, AggreWell™800 (Stemcell Technologies, 34815) containing 300 microwells were used. Approximately 3 × 10⁶ single cells were added per AggreWell™800 well in Essential 8™ medium supplemented with the ROCK inhibitor Y-27632 (10 μM, Selleckchem, S1049), centrifuged at 100 x g for 3 minutes to capture the cells in the microwells and incubated at 37ºC with 5% CO2. After 24 hours, spheroids from each microwell were harvested by firmly pipetting (with a cut the end of a P1000 tip) medium in the well up and down and transferred into ultra-low attachment plastic dishes (Corning, 3262) in Essential 6™ medium (Life Technologies, A1516401) supplemented with two SMAD pathway inhibitors– dorsomorphin (2.5 μM, Sigma-Aldrich, P5499) and SB-431542 (10 μM, Tocris, 1614). From day 2 to day 6, Essential 6™ medium was changed every day and supplemented with dorsomorphin and SB-431542. Optionally, the Wnt pathway inhibitor XAV-939 (2.5 μM, Tocris, 3748) can be added with the two SMAD pathway inhibitors. On the sixth day in suspension, neural spheroids were transferred to neural medium containing Neurobasal A (Life Technologies, 10888), B-27 Supplement without vitamin A (Life Technologies, 12587) and GlutaMax (1:100, Life Technologies, 35050). The neural medium was supplemented with 20 ng/ml EGF (R&D Systems, 236-EG) and 20 ng/ml bFGF (R&D Systems, 233-FB) for 19 days (until day 24) with daily medium change in the first 10 days, and every other day for the subsequent 9 days. To promote differentiation of the neural progenitors into neurons, the neural medium was supplemented with 20 ng/ml BDNF (Peprotech, 450–02) and 20 ng/ml NT3 (Peprotech, 450–03) with medium changes every other day. From day 43, only neural medium without growth factors was used for medium changes every 4 days.
A step-by-step protocol for the generation cortical spheroids from hiPSC hiPSCs in feeder-free, xeno-free conditions is available in Protocol Exchange (ref. 20).
Cryopreservation
hCS were fixed in 4% paraformaldehyde overnight at 4°C. They were then washed in PBS and transferred to 30% sucrose for 48–72 h. Subsequently, they were transferred into embedding medium (Tissue-Tek optimum cutting temperature (OCT) compound 4583, Sakura Finetek), snap-frozen on dry ice and stored at −80°C. For immunohistochemistry, 10–12 μm thick sections were cut with a cryostat (Leica).
Immunohistochemistry
Cryosections were washed with PBS to remove excess OCT and blocked in 10% normal goat serum (NGS), 0.3% Triton X–100 diluted in PBS for 1 hour at room temperature. The sections were then incubated overnight at 4°C with primary antibodies diluted in PBS containing 2% NGS and 0.1% Triton X–100. PBS was used to wash off the primary antibodies and the cryosections were incubated with secondary antibodies in PBS with 2% NGS and 0.1% Triton X-100 for 1 hour. The following primary antibodies were used for immunohistochemistry: anti-SATB2 (mouse, 1:50, Abcam, AB51502), anti-CTIP2 (rat, 1:300, Abcam, AB18465), anti-TBR1 (rabbit, 1:300, Abcam, AB31940), anti-TBR1 (chicken, 1:200, Millipore, AB2261), anti-TLE4 (mouse, 1:200, Santa Cruz, sc-365406), anti-HOPX (mouse, 1:100, Santa Cruz, sc-398703), anti-RELN (mouse, 1:200, MBL, D223–3), anti-BRN2 (rabbit, 1:250, GeneTex, GTX114650), anti-cCas3 (Asp175; rabbit, 1:200, CST, 9661), anti-GFAP (rabbit, 1:1000, DAKO, Z0334) and anti-SOX2 (rabbit, 1:200, CTS, 3579).
For TBR2 staining (anti-TBR2, mouse, 1:100; R&D, MAB6166), antigen retrieval (using 10 mM Na+ citrate and heating to 95°C) was performed for 20 minutes and sections were blocked in 0.1% Triton X–100, 10% serum, and 0.2% gelatin for 1 hour. The sections were incubated with primary antibodies in blocking buffer overnight at 4°C, then washed with PBS with 0.5% Triton X–100 for 1 hour and incubated with secondary antibodies diluted in blocking buffer for 1 hour at room temperature.
For GFAP immunocytochemistry (rat, anti-GFAP, 1:1000, Thermo Fisher 13–0300), hCS-FF were dissociated and plated in monolayer as described below. Plated cells coverslips were blocked in 10% NGS, 0.3% Triton X–100 diluted in PBS for 1 hour at room temperature. Coverslips were incubated for 2 hours at room temperature with primary antibodies diluted in PBS containing 2% NGS and 0.1% Triton X-100. PBS was used to wash the primary antibodies and cells were then incubated with secondary antibodies in PBS with 2% NGS and 0.1% Triton X–100 for 1 hour.
Images were acquired with a Zeiss Axio Imager M2 or a KEYENCE BZ-X710, and processed with ImageJ.
Dissociation of hCS and hSS
For the enzymatic dissociation of hCS-FF for culture in monolayer and immunocytochemistry (ani-GFAP), up to 3 spheroids were incubated with 200 μl of Accutase (Innovative Cell Technologies) for 20 min at 37 °C, washed with neural medium and gently triturated using a P200 pipette. Cells were plated on glass coverslips (15 mm, Warner Instruments) coated with poly-L-ornithine and laminin (Sigma-Aldrich) at a density of around 250,000 cells per coverslip in neural medium supplemented with BDNF, NT3 and, for the first 24 hours, 10 μM Y-27632.
To dissociate hCS and hSS for single-cell profiling, we used a previously published protocol7. Briefly, 3–10 spheroids were chopped using a #10 blade and then incubated in 40 U/ml papain enzyme solution containing 0.46% D(+)-Glucose (Sigma-Aldrich), 26 mM NaHCO3 (Sigma-Aldrich), 0.5 mM EDTA (Sigma-Aldrich) in EBSS (1X, Sigma-Aldrich) at 37 °C in 5% CO2 for 70 minutes. The digested spheroids were then washed and carefully triturated with a protease inhibitor stock solution containing 0.46% D(+)-Glucose (Sigma-Aldrich), 26 mM NaHCO3 (Sigma-Aldrich), 5 mg trypsin inhibitor (Sigma-Aldrich) in EBSS (1X, Sigma-Aldrich). After centrifugation (200 × g for 4 min), the pellet was resuspended in 0.2% bovine serum albumin (BSA) diluted in PBS and supplemented with 10 μ M Y-27632, and the cells were used for the single-cell RNA sequencing.
Real-time quantitative PCR (RT-qPCR)
At least three hCS-FF were combined for RNA extraction. Total RNA was isolated using the RNeasy Mini kit and RNase-Free DNase set (Qiagen), and template cDNA was prepared by reverse transcription using the SuperScript III First-Strand Synthesis SuperMix for RT–qPCR (Life Technologies). qPCR was performed using Sybr Green (Roche) on a ViiA7 machine (Applied Biosystems, Life Technologies). Data was processed using the QuantStudio RT–PCR software (v1.1, Applied Biosystems). Primers and sequences are listed in Supplementary Table 2.
RNA-seq processing
RNA-seq samples are listed in Supplementary Table 3. Following extraction of total RNA, rRNA was depleted (RiboZero Gold, Illumina) and libraries were prepared using Truseq stranded RNA RiboZero Gold (Illumina). Libraries were then sequenced generating 100-bp paired end reads on an Illumina HiSeq 4000. Paired-end reads were mapped using STAR21 to hg38 with Gencode v25 annotations. Gene expression levels were quantified using rsem (v1.3.0)22. Genes with less than 10 mapped reads in over 60% of the samples were removed. Samples with standardized sample network connectivity Z scores smaller than –2 were defined as outliers and removed22. To control for technical variation in the RNA sequencing (e.g. read depth, % coding bases, bases duplication rate), we calculated the first five principal components of the Picard sequencing metrics (http://broadinstitute.github.io/picard/)) and these were included in our linear model. To control for batch effects, we either included batch as a covariate in the linear model (Supplementary Fig. 3) or removed it using the ComBat function from the sva package in R (for PCA and correlation analysis Fig. 1f, g)24.
The GATK (v3.3) Haplotype caller was used to call SNPs from the aligned reads25. Resulting vcf files were converted to plink format (v1.08) and sites with more than 5% missing samples, with rare minor allele frequency (less than 0.05) and out of Hardy-Weinberg equilibrium (less than 1 × 10⁶) were filtered out26. These high-quality SNPs were used to run MDS together with HapMap3.3 (hg38) to infer sample race. The first two MDS values, referred to as raceMDS1/2, were then included in our linear model. For PCA and correlation analysis, raceMDS1–2 and SeqPC1–5 were regressed out before batch correction.
Single-cell gene expression (BD Rhapsody system)
To capture single cell transcriptomic information of hiPSC derived hCS-FF samples, we used the BD Rhapsody system (formerly known as BD Resolve) (BD Biosciences) as previously reported12,15. Three hiPSC lines that were differentiated in parallel (i.e., same differentiation batch) into hCS-FF, were dissociated enzymatically into single cells at day 105 of differentiation and processed on the same day. Four to six spheroids from each hiPSC line were combined, the proportion of live cells was estimate using a fluorescent assay (~90%) and all cells were used for further processing. Single-cell suspension of ~10,000 cells were captured from all isolated cells, without selection, on an array of >200,000 microwells through a limited dilution approach. Beads with oligonucleotide barcodes were added to saturation so that a bead was paired with a cell in a microwell. After exposure to cell lysis buffer, poly-adenylated RNA molecules hybridized to the beads. Beads were retrieved into a single tube for reverse transcription. Upon cDNA synthesis, each cDNA molecule was tagged on the 5′ end (that is, the 3′ end of a mRNA transcript) with a molecular index and cell label indicating its cell of origin. Whole transcriptome libraries were prepared from a ~67% of the captured cells by subsampling the Rhapsody beads that were then subject to second strand cDNA synthesis, adaptor ligation, and universal amplification using twenty-two cycles of PCR. The rest of the beads were archived. Sequencing libraries were prepared using random priming PCR of the whole-transcriptome amplification products to enrich the 3′ end of the transcripts linked with the cell label and molecular indices. The libraries were sequenced on HiSeq2500 (Illumina) using 101 × 2 chemistry.
The BD Rhapsody analysis pipeline was used to process sequencing data (.fastq files). Cell labels and molecular indices were identified, and gene identity was determined by alignment against the Gencode comprehensive hg19 reference. A table containing molecule counts per gene per cell was the output. Gene expression profiles of 4,649, 4,389 and 3,088 cells were recovered for hCS-FF-1, hCS-FF-2, hCS-FF-3, respectively, with an average number of reads of ~38,000, ~2,000–2,300 molecules and ~1,100–1,300 genes detected per cell, with average molecular index coverage (that is, the number of times a molecule was sequenced) of 3.2–3.5.
Analysis of the single cell transcriptome profiles was performed with BD™ Data View.
We compared the current data sets (hCS-FF-1-3) with single cell data from hCS-MEF and hSS-MEF obtained on the same platform previously12. Cells with mitochondrial gene (with a gene symbol starting with MT) content > 30%, were discarded, leaving a total of 24,237 cells from all samples. We extracted the expression profiles of the 338 genes (Supplementary Table 4) identified previously12 that define the 8 functional populations in forebrain spheroids, and conducted tSNE projection on the filtered data.
Brainspan data
BrainSpan developmental RNA-seq data from cortical regions14 were mapped to hg38 using Gencode v25 via STAR21. Gene expression levels were quantified using union exon models with featureCounts27. Samples with RIN scores below 8, containing less than 25% coding bases or more that 25% ribosomal bases (as called by Picard tools), were removed from the analysis. Genes with fewer than 10 mapped reads in over 80% of the samples per developmental period were removed.
Transition mapping
Gene expression distributions were normalized using the trimmed mean of M values (TMM) method from the edgeR package28 followed by the voom method from the limma package29. We calculated the log fold-change for each differentiation day or developmental period compared to every other using the limma package by applying contrasts. For the BrainSpan data in which multiple samples came from the same brain, the brain ID was used as a blocking factor in the model. Genes were ranked by log fold-change, and a hypergeometric test was used with a step size of 200 to calculate the significance of the overlap between the gene lists13.
Electrophysiology
Sections of hCS were obtained using an approach we previously described10. Briefly, 3D spheroids were incubated in bicarbonate-buffered artificial cerebrospinal fluid (aCSF) at 23 °C and equilibrated with a mixture of 95% O2 and 5% CO2. The aCSF solution contained: 126 mM NaCl, 26 mM NaHCO3, 10 mM glucose, 2.5 mM KCl, 1.25 mM NaH2PO4, 1 mM MgSO4 and 2 mM CaCl2. Slicing was performed using a Leica VT1200 vibratome. Immediately after sectioning, slices were moved to a circulation chamber containing oxygenated aCSF at room temperature.
For patch-clamp recording, cells were identified by the presence of a fluorescent reporter using an upright ‘slicescope’ microscope (Scientifica). Recording electrodes of borosilicate glass had a resistance of 7–10 MΩ when filled with internal solution. The internal solution contained: 145 mM K gluconate, 0.1 mM CaCl2, 2.5 mM MgCl2, 10 mM HEPES, 0.2 mM EGTA, 4 mM Na phosphocreatine. Glutamatergic currents were blocked by application of NBQX (20 μM, Tocris) and APV (100 μM, Tocris).
hCS plated in monolayer neurons and infected with the AAV-Syn1::ChR2-mCherry were activated with a 475 nm light using a 200 μm diameter optical fiber (Thorlabs). Pulsed light (2 or 5 ms, 1.5 mW) were applied at 8, 12, 16, 24 and 32 Hz for 1 s to stimulate action potential generation.
Data were collected using a 1550A digitizer (Molecular Devices), a 700B patch-clamp amplifier (Molecular Devices) and acquired with the pClamp 10.6 software (Molecular Devices). Data were low-pass filtered at 10 kHz and digitized at 20 kHz. Data averaging, digital subtraction of null traces, and action potential and EPSC detection were obtained from Clampfit (Molecular Devices). Data were fitted and plotted using Origin (OriginLab).
Statistics
Data are presented as mean ± s.e.m., unless otherwise indicated. Distribution of the raw data was tested for normality of distribution; statistical analyses were performed using the t-test, Wilcoxon–Mann–Whitney test, χ2 test or ANOVA as indicated. Sample sizes were estimated empirically or on the basis of power calculations.
Reporting Summary Further information on research design is available in the Nature Research Reporting Summary linked to this article.
Supplementary Material
Supplementary Table 3. Samples used for RNA-seq.
Supplementary Table 1. hiPSC lines used in various experiments.
Supplementary Table 2. Primers used for qPCR experiments in Figure 1 and Supplementary Figure 1.
Supplementary Table 4. List of genes used for clustering cells in single cell gene expression.
ACKNOWLEDGEMENTS
We thank acknowledge support from J. Dreux, J. Lai (at BD) for running the pipeline and Data View troubleshooting. This work was supported by the US National Institute of Health (NIH) BRAINS Award (MH107800), the MQ Fellow Award, the NYSCF Robertson Stem Cell Investigator Award, the Donald E. and Delia B. Baxter Foundation Award, the Stanford Neurosciences Institute’s Brain Rejuvenation Project, the Kwan Research Fund, and Stanford Start-up Funds (to S.P.P.); the California Institute of Regenerative Medicine (CIRM) and NIH U01 (MH115745) (to D.H.G. and S.P.P.); CIRM Bridges Program (to L.S.E.), Stanford School of Medicine Dean’s Postdoctoral Fellowship (to Y.M.), Bio-X Predoctoral Fellowship (to R.M.M.), the NIH K12-HD000850 (Pediatric Scientist Development Program) and Stanford Child Health Research Institute Fellowship (to A.M.P), and the Autism Science Foundation Fellowship (to A.G.)
Footnotes
Competing interests
Stanford University has filed a provisional patent application that covers the generation of region-specific neural spheroids (US Application Serial No. 15/158,408). H.C.F., E.M.W. and G.M.H. were employees of BD Genomics during this study.
REFERENCES:
- 1.Di Lullo E & Kriegstein AR The use of brain organoids to investigate neural development and disease. Nat Rev Neurosci 18, 573–584, doi: 10.1038/nrn.2017.107 (2017). [DOI] [PMC free article] [PubMed] [Google Scholar]
- 2.Pasca SP The rise of three-dimensional human brain cultures. Nature 553, 437–445, doi: 10.1038/nature25032 (2018). [DOI] [PubMed] [Google Scholar]
- 3.Kelava I & Lancaster MA Stem Cell Models of Human Brain Development. Cell Stem Cell 18, 736–748, doi: 10.1016/j.stem.2016.05.022 (2016). [DOI] [PubMed] [Google Scholar]
- 4.Bershteyn M et al. Human iPSC-Derived Cerebral Organoids Model Cellular Features of Lissencephaly and Reveal Prolonged Mitosis of Outer Radial Glia. Cell Stem Cell 20, 435–449 e434, doi: 10.1016/j.stem.2016.12.007 (2017). [DOI] [PMC free article] [PubMed] [Google Scholar]
- 5.Mariani J et al. FOXG1-Dependent Dysregulation of GABA/Glutamate Neuron Differentiation in Autism Spectrum Disorders. Cell 162, 375–390, doi: 10.1016/j.cell.2015.06.034 (2015). [DOI] [PMC free article] [PubMed] [Google Scholar]
- 6.Lancaster MA et al. Cerebral organoids model human brain development and microcephaly. Nature 501, 373–379, doi: 10.1038/nature12517 (2013). [DOI] [PMC free article] [PubMed] [Google Scholar]
- 7.Sloan SA et al. Human Astrocyte Maturation Captured in 3D Cerebral Cortical Spheroids Derived from Pluripotent Stem Cells. Neuron 95, 779–790 e776, doi: 10.1016/j.neuron.2017.07.035 (2017). [DOI] [PMC free article] [PubMed] [Google Scholar]
- 8.Qian X et al. Brain-Region-Specific Organoids Using Mini-bioreactors for Modeling ZIKV Exposure. Cell 165, 1238–1254, doi: 10.1016/j.cell.2016.04.032 (2016). [DOI] [PMC free article] [PubMed] [Google Scholar]
- 9.Blair JD, Hockemeyer D & Bateup HS Genetically engineered human cortical spheroid models of tuberous sclerosis. Nat Med, doi: 10.1038/s41591-018-0139-y (2018). [DOI] [PMC free article] [PubMed] [Google Scholar]
- 10.Pasca AM et al. Functional cortical neurons and astrocytes from human pluripotent stem cells in 3D culture. Nature methods 12, 671–678, doi: 10.1038/nmeth.3415 (2015). [DOI] [PMC free article] [PubMed] [Google Scholar]
- 11.Sloan SA, Andersen J, Pasca AM, Birey F & Pasca SP Generation and assembly of human brain region-specific three-dimensional cultures. Nat Protoc, doi: 10.1038/s41596-018-0032-7 (2018). [DOI] [PMC free article] [PubMed] [Google Scholar]
- 12.Birey F et al. Assembly of functionally integrated human forebrain spheroids. Nature 545, 54–59, doi: 10.1038/nature22330 (2017). [DOI] [PMC free article] [PubMed] [Google Scholar]
- 13.Stein JL, Torre-Ubieta L, Tian Y, Parikshak NP, Hernandez IA, Marchetto MC, Baker DK, Lu D, Hinman CR, Lowe JK, Wexler EM, Muotri AR, Gage FH, Kosik KS, and Geschwind DH A Quantitative Framework to Evaluate Modeling of Cortical Development by Neural Stem Cells Neuron 83, 69–86 (2014). [DOI] [PMC free article] [PubMed] [Google Scholar]
- 14.BrainSpan. BrainSpan: Atlas of the Developing Human Brain <http://www.brainspan.org> (2013).
- 15.Fan HC, Fu GK & Fodor SP Expression profiling. Combinatorial labeling of single cells for gene expression cytometry. Science 347, 1258367, doi: 10.1126/science.1258367 (2015). [DOI] [PubMed] [Google Scholar]
- 16.Quadrato G et al. Cell diversity and network dynamics in photosensitive human brain organoids. Nature 545, 48–53, doi: 10.1038/nature22047 (2017). [DOI] [PMC free article] [PubMed] [Google Scholar]
- 17.Camp JG et al. Human cerebral organoids recapitulate gene expression programs of fetal neocortex development. Proc Natl Acad Sci U S A 112, 15672–15677, doi: 10.1073/pnas.1520760112 (2015). [DOI] [PMC free article] [PubMed] [Google Scholar]
- 18.Pașca SP et al. Using iPSC-derived neurons to uncover cellular phenotypes associated with Timothy syndrome. Nat Med 17, 1657–1662, doi:nm.2576 [pii] 10.1038/nm.2576 (2011). [DOI] [PMC free article] [PubMed] [Google Scholar]
- 19.Gallego Romero I et al. A panel of induced pluripotent stem cells from chimpanzees: a resource for comparative functional genomics. eLife 4, e07103, doi: 10.7554/eLife.07103 (2015). [DOI] [PMC free article] [PubMed] [Google Scholar]
- 20.Yoon SJ & Paşca SP Protoc. Exch 10.1038/protex.2018.123 (2018). [DOI]
- 21.Dobin A et al. STAR: ultrafast universal RNA-seq aligner. Bioinformatics 29, 15–21, doi: 10.1093/bioinformatics/bts635 (2013). [DOI] [PMC free article] [PubMed] [Google Scholar]
- 22.Li B & Dewey CN RSEM: accurate transcript quantification from RNA-Seq data with or without a reference genome. BMC Bioinformatics 12, 323, doi: 10.1186/1471-2105-12-323 (2011). [DOI] [PMC free article] [PubMed] [Google Scholar]
- 23.Oldham MC, Langfelder P & Horvath S Network methods for describing sample relationships in genomic datasets: application to Huntington’s disease. BMC Syst Biol 6, 63, doi: 10.1186/1752-0509-6-63 (2012). [DOI] [PMC free article] [PubMed] [Google Scholar]
- 24.Johnson WE, Li C & Rabinovic A Adjusting batch effects in microarray expression data using empirical Bayes methods. Biostatistics 8, 118–127, doi: 10.1093/biostatistics/kxj037 (2007). [DOI] [PubMed] [Google Scholar]
- 25.McKenna A et al. The Genome Analysis Toolkit: a MapReduce framework for analyzing nextgeneration DNA sequencing data. Genome Res 20, 1297–1303, doi: 10.1101/gr.107524.110 (2010). [DOI] [PMC free article] [PubMed] [Google Scholar]
- 26.Purcell S et al. PLINK: a tool set for whole-genome association and population-based linkage analyses. Am J Hum Genet 81, 559–575, doi: 10.1086/519795 (2007). [DOI] [PMC free article] [PubMed] [Google Scholar]
- 27.Liao Y, Smyth GK & Shi W featureCounts: an efficient general purpose program for assigning sequence reads to genomic features. Bioinformatics 30, 923–930, doi: 10.1093/bioinformatics/btt656 (2014). [DOI] [PubMed] [Google Scholar]
- 28.Robinson MD, McCarthy DJ & Smyth GK edgeR: a Bioconductor package for differential expression analysis of digital gene expression data. Bioinformatics 26, 139–140, doi: 10.1093/bioinformatics/btp616 (2010). [DOI] [PMC free article] [PubMed] [Google Scholar]
- 29.Ritchie ME et al. limma powers differential expression analyses for RNA-sequencing and microarray studies. Nucleic Acids Res 43, e47, doi: 10.1093/nar/gkv007 (2015). [DOI] [PMC free article] [PubMed] [Google Scholar]
Associated Data
This section collects any data citations, data availability statements, or supplementary materials included in this article.
Supplementary Materials
Supplementary Table 3. Samples used for RNA-seq.
Supplementary Table 1. hiPSC lines used in various experiments.
Supplementary Table 2. Primers used for qPCR experiments in Figure 1 and Supplementary Figure 1.
Supplementary Table 4. List of genes used for clustering cells in single cell gene expression.