

Abstract
Analyzing cellular constituents on the single-cell level through mass spectrometry (MS) allows for a wide range of compounds to be studied simultaneously. However, there is a need for quantitative single-cell mass spectrometry (qSCMS) methods to fully characterize drug efficacy from individual cells within cell populations. In this study, qSCMS experiments were carried out using the Single-probe MS technique. The method was successfully used to perform rapid absolute quantifications of the anticancer drug irinotecan in individual mammalian cancer cells under ambient conditions in real time. Traditional liquid chromatography/mass spectrometry (LC/MS) quantifications of irinotecan in cell lysate samples were used to compare the results from Single-probe qSCMS. This technique showcases heterogeneity of drug efficacy on the single-cell level.
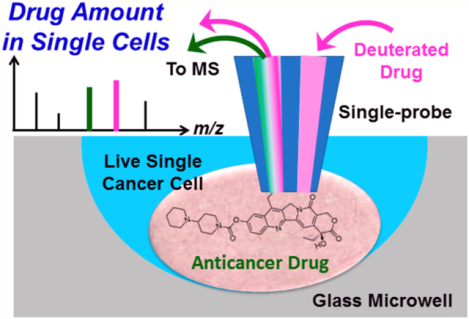
Graphical Abstract
Single-cell analysis (SCA) is transforming the biological sciences, making its greatest impact in the fields of neuroscience, immunology, and oncology, and it promises to enhance our understanding of individual cells in numerous other contexts.1 Cell-to-cell heterogeneity dictates a multitude of functions for homeostasis and development of disease states. Since a cell is the basic unit of multicellular organisms, understanding functions of organisms in health and disease is aided by understanding cell heterogeneity and how it changes during these processes. Compared with the traditional methods that are based on the population-averaged studies, SCA can provide a more nuanced analysis of the underlying biological mechanics of the system being studied.2 SCA encompasses a variety of analytical techniques, including single-cell genomics (e.g., DNA and RNA sequencing), single-cell transcriptomics, single-cell fluorescent tagging, Raman spectroscopy imaging, and others.3
Single-cell mass spectrometry (SCMS) is a nascent field that has gained great interest in broad areas of research.1,4–7 Mass spectrometry (MS) is a versatile technique to simultaneously analyze a large number of molecules in a short period of time. Traditional MS approaches to cell analysis are restricted to a population of cells (e.g., cell lysate), where an averaged result is obtained. Recent advancements in high mass resolution MS have allowed for the confident identification of a large number of molecules,8 and improved sensitivity enables MS to be applied at the single-cell level, mostly in the field of metabolomics6,9–11 and potentially even single-cell peptido-mics12,13 and proteomics.14 Current SCMS techniques can be broadly categorized into two main approaches, nonambient and ambient techniques, based on their sampling and ionization environments. Nonambient techniques include matrix-assisted laser desorption/ionization (MALDI) MS15–18 and time-of-flight secondary ion MS (TOF-SIMS),19,20 which are capable of high spatial resolution21 for cellular and subcellular resolution analysis of the cell organelles.22–24 However, nonambient techniques require obligatory sample pretreatment and a vacuum sampling environment, which is not suitable for live cell analysis. Ambient SCMS techniques enable the study of single cells in their native conditions with little or no sample preparation, allowing live cells to be analyzed. Because cells’ metabolites can rapidly change upon the variation of their environment, molecular information obtained from live cells has higher fidelity reflecting cell status.14 Reported ambient SCMS techniques include laser-assisted electrospray ionization (LAESI) MS, single-cell capillary electrophoresis (CE) ESI MS, probe ESI MS, and live single-cell video-MS (live MS).25
Recently, we have introduced the Single-probe MS technique for in situ MS analysis of live eukaryotic cells in real time.26–28 The Single-probe is an integrated microscale sampling and ionization device that can be coupled with a mass spectrometer for multiple applications. The Single-probe tip (~6–10 μm) is small enough to be inserted into single cells for direct liquid-microextraction of cellular contents followed by immediate MS detection. This technique has been used to analyze cellular metabolites of single cells, including cancer cells2,28–32 and algae cells.33 In addition, the Single-probe device can be used for other applications, including high spatial resolution ambient MS imaging of biological samples26,34,35 and analysis of extracellular molecules inside live multicellular spheroids.36
Discoveries in fundamental research as well as industrial and clinical applications often require reporting relative or absolute quantities of target molecules. Unfortunately, many of the existing spectroscopic37 and MS methods cannot perform quantitative analysis on broad ranges of molecules. Over the past decade, researchers have devised various MS techniques to quantify analyte from prepared biological samples. Most metabolomics studies introduce an internal standard, such as a stable isotope-labeled compound, to aid in quantification by plotting relative intensities of the ion pairs to estimate the relative amount of target molecules. Although progress has been made in quantifying molecules from live single cells, quantitative analysis of species of interest at the single-cell level is still extremely challenging due to the limited amount of sample present in individual cells and a lack of sensitive bioanalytical techniques.
Semiquantitative MS analysis has been performed using vacuum-based techniques. MALDI was used for one of the earliest reported quantifications of low molecular compounds, including the neurotransmitter acetylcholine and peptides from biological samples of interest.38 Since then, MALDI-TOF and MALDI-MSI (MS imaging) have been explored for semiquantitative analysis using stable isotope labeling, relative ratio comparisons, or mapping cellular images for quantitation at the single-cell level.14
Ambient MS techniques have also been developed at the individual-cell level. For example, the Masujima group reported relative quantification of molecules at the cellular level using live single-cell video—mass spectrometry to obtain a ratio of isotopically labeled compound to the analyte for comparison with a standard curve of known labeled- to unlabeledcompound ratios. Recently, label-free quantification of proteins in individual frog embryos was performed using ion currents to estimate concentrations using capillary electrophoresis microelectrospray ionization (μ-ESI) for high resolution MS.14 In addition, nano-ESI with electroosmotic extraction has been used to quantify the amount of glucose in onions,39 and nano-DESI has quantified phosphatidylcholine from human cheek cells.40
New developments in label-free MS increase the feasibility of the methods for use in individualized chemotherapeutic regimens since one of the aims in metabolomics is quantitation of metabolites to evaluate changes in response to disease, treatment, and environmental and genetic perturbations. Successfully quantifying molecules (e.g., drug compounds) in single cells can potentially revolutionize fundamental research and clinical tests. In the present study, we employed the Singleprobe SCMS technique to directly quantify the absolute amount of the drug molecule, irinotecan,41 inside live single cancer cells.
■ METHODS
Single-Probe Fabrication Protocol.
The fabrication protocols of the Single-probe are detailed in our previous publications,26,27,34 and only brief procedures are provided here. Single-probe fabrication utilizes a laser puller (P-2000 Micropipette Laser Puller, Sutter Instrument Co., Novato, CA) to evolve dual-bore quartz tubing (outer diameter (OD) 500 μm; inner diameter (ID) 127 μm, Friedrich & Dimmock, Inc., Millville, NJ) into a sharp-tipped needle. A solvent-providing capillary (OD 105 μm; ID 40, μm, Polymicro Technologies, Phoenix, AZ) and a nano-ESI emitter produced from the same fused silica capillary are embedded into the dual-bore quartz needle and sealed using UV curing resin (Light Cure Bonding Adhesive, Prime-Dent, Chicago, IL). To conveniently use the Single-probe in the experiment, the device is secured onto a glass slide using regular epoxy glue. The glass slide is then held by a flexible clamp holder (MXB-3h, Siskiyou, Grants Pass, OR) as shown in Figure 1. For SCMS experiments, the Single-probe tip is inserted into a cell, and the sampling solvent, which contains the internal standard, is continuously delivered into the cell through the solvent-providing capillary. The cellular contents are extracted by the sampling solvent and withdrawn by capillary action toward the nano-ESI emitter, where the extracted molecules and internal standard are immediately ionized for MS analysis (Figure 1).
Figure 1.

qSCMS experimental setup with individual cells highlighted in the microscopic image of glass microwells.
Glass Chips Containing Microwells for qSCMS Experiments.
In our quantitative single-cell mass spectrometry (qSCMS) experiments, it is critical to extract the entire cellular contents and delivered solution of the internal standard, which are needed to derive the quantity of species of interest inside single cells. Custom glass microchips with microwells (radius: 55 μm, depth: 25 μm; Blacktrace Inc., MA) were utilized, in which cells were retained in microwells through overnight incubation prior to MS measurements (described in the following section). Single cells from wells are monitored using a top-view digital stereomicroscope (Figure 1).
Cell Sample Preparation.
The adherent, mammalian cell lines used in these experiments included HeLa (cervical cancer) and HCT-116 (colon cancer), which were cultured using DMEM and McCoy’s 5A medium, respectively, containing 10% FBS and 1% penicillin streptomycin. Cell lines were passaged around 85% confluency.
Cell Preparation for qSCMS Experiments.
For single-cell experiments, a glass microchip containing microwells was placed into each well of a 6-well plate. Four hundred microliters of cell suspension (~150 000 cells) solution was added into 3.6 mL of cell culture medium for overnight incubation, allowing cells to be attached to the glass microchip. Drug treatment of cells was conducted by adding an appropriate amount of irinotecan solution into each well of the 6-well plate (with final drug concentrations to be 0.1 and 1.0 μM) and incubating cells for different time lengths (0.5 and 1 h). Cell-containing glass microchips were then rinsed with 5 mL of cell culture media (FBS-free) to remove residual drug molecules on the cell and slide surfaces prior to measurement. Single cells retained in individual microwells (i.e., one cell per microwell) were selected for quantitative SCMS measurements.
Cell Lysate Preparation.
The results obtained from our SCMS studies were compared with those from the traditional cell population analyses: LC/MS analysis of cell lysates. In the traditional LC/MS studies, the moles of analyte inside of a single cell were estimated by taking the total amount of analyte divided by the total number of cells. For cell lysate preparation, cells were cultured in 6-well plates under the same conditions as those used in the cell preparation for SCMS experiments as described in the previous section. To duplicate the cell growth environment in the SCMS experiments, a glass slide was placed at the bottom of each well for cell attachment. Upon finishing drug treatment, cells were rinsed using PBS (phosphate-buffered saline) and detached from cell culture plate using trypsin. Cells were then transferred into 1.5 mL Eppendorf tubes and centrifuged to prepare cell pellets. One tube of cells was used to count the cell number. The remaining five tubes were used to prepare cell lysate samples through a solvent extraction approach, which was conducted by adding ACN-(50%)/MeOH(50%) solution that contains the internal standard (i.e., deuterated irinotecan, d-irinotecan) into each tube. Cell extraction was centrifuged, and the supernatant was withdrawn followed by drying. The dried samples were dissolved in 200 μL of ACN (12%):H2O (88%) and then analyzed using a Waters nanoACQUITY UPLC (C-18 column) coupled to a Thermo LTQ Orbitrap XL mass spectrometer (Waltham, MA).
qSCMS Experiment and Data Processing.
The qSCMS experiments were carried out using the same experimental setup with similar operation procedures as detailed in our previous publications,26,27 and only outlined information is provided here. The Single-probe SCMS setup includes a Single-probe (attached to a glass slide), a digital stereo-microscope, a USB digital stereomicroscope, a computercontrolled XYZ-translational stage system, and a Thermo LTQ Orbitrap XL mass spectrometer (Figure 1). To conduct a quantitative SCMS experiment, the microwell slide containing cells is attached to the motorized XYZ-stage, and sample movement is controlled using the LabView software.42 Upon finding a target cell in a microwell, the Z-stage is precisely lifted (0.1-μWm increments) for cell insertion monitored using microscopes. The sampling solution was prepared by adding the d-irinotecan into methanol (50%)/water (50%), and it was continuously delivered using a syringe pump at a flow rate of ~25 nL/min; the actual flow rate needs to be optimized for each Single-probe device. To determine the optimal concentration of d-irinotecan (Figure S1) used in the experiments, a series of concentrations ranging from 10 nM to 1 μM were tested. A value of 50 nM was selected as the optimized concentration of d-irinotecan because it provided ion intensities that were within ~10 times of the regular irinotecan, allowing for accurate quantitative MS measurements to be conducted within a relatively narrow linear dynamic range. To eliminate any potential artifacts related to the selections of sampling solvent flow rate and internal standard concentration, we have carried out statistical analysis of results obtained under different conditions, and no significant difference was observed. MS analyses were performed using the following parameters: mass resolution 60 000 (m/△m), 4.5 kV (positive mode), 1 microscan, 100 ms max injection time. For more confident identification of species of interest, MS/MS analyses were conducted using collision-induced dissociation (CID). MS/MS was performed to confirm the detection of both irinotecan (Figure 2) and d-irinotecan using following parameters: isolation width 1.0 m/z (±0.5 m/z window) and normalized collision energy 20–35 (manufacturer’s unit).
Figure 2.

MS/MS of [irinotecan + H]+ (m/z 587.2854) from an individual HCT-116 cell treated with irinotecan (1 μM, 72 h).
To quantify the total amount of irinotecan inside live single cells, a comprehensive MS data analysis was carried out. The insertion of the Single-probe tip into an individual cell and extraction of intracellular molecules were confirmed from significant changes of mass spectra during the experiment: ion signals changed from the solvent background through the culture medium to the cellular metabolites (Figure 3). Particularly, for the drug-treated cells, the ion signal of the regular irinotecan ([C33H38N4O6 + H]+) was only observed after the cell was penetrated by the Single-probe, whereas the deuterated drug compound ([C33H28D10N4O6 + H]+) was continuously observed through the entire data acquisition time. We estimated the moles of irinotecan inside of live single cells (x) by taking into account multiple factors, including the integration of the ion intensities of the target molecule (ƩA) and internal standard (ƩB), the concentration of the internal standard (c), the flow rate of the sampling solution containing the internal standard (v), and the MS data acquisition time (t) (eq 1, Figure 4). Although the intracellular drug compounds are the target of the qSCMS measurement, we cannot completely eliminate the contribution of any drug molecules retained on the cell membrane.
Figure 3.

Spectra depicting ion signals (A) before cellular analysis, (B) during analysis, and (C) after analysis for an individual HeLa cell treated with irinotecan (100 nM, 1 h).
Figure 4.

Extracted ion chromatogram for irinotecan (upper) and d-irinotecan (50 nM) (lower) depicting the signal duration of irinotecan and its internal standard from individual HCT-116 cells treated with irinotecan (100 nM, 1 h).
| (1) |
■ RESULTS
Experimental Setup for Quantitative SCMS Experiments.
Previous Single-probe SCMS studies have qualitatively obtained the chemical profiles of a wide range of metabolites present in cultured mammalian cells.7,28,34,35 Two major modifications were incorporated to establish quantitative SCMS (qSCMS) capabilities. First, methodology for internal standard introduction was established. The unique design of the Single-probe allows for versatile compositions of sampling solvent to be used in the SCMS experiments. For example, reagents, such as dicationic compounds (2+ charged), were utilized in our previous reactive SCMS experiments to detect molecular anions in positive ionization mode of the mass spectrometer.28 In the current study, the isotopically labeled drug compound (i.e., internal standard) at predetermined concentrations in the sampling solvent allows for the quantification of analytes present in the individual cells. The second major new experimental modification to the Singleprobe SCMS method for quantitation is the use of glass microchips containing microwells for cell culture and analysis. Previous SCMS experiments were conducted using nondifferentiated surfaces, such as glass microscope cover slides, to immobilize cells for convenient cell sampling. However, partial loss of cellular components through diffusion may occur during SCMS measurement. In the qSCMS experiments, only individual cells inside hemisphere microwells (radius 55 μm; depth 25 μm, Blacktrace Inc.) were selected (Figure 1), confining any potential analyte release to the well where the cellular compounds can be recaptured for analysis. Microscope-guided visualization of the Single-probe sampling individual cells in the microwell is performed until sampling the microwell contents cease to detect cellular ion signals in the MS data.
Influence of Flow Rate and Concentration of Internal Standard.
Flow rate of the sampling solvent, which contains the internal standard, is an experimental parameter that must be optimized for each experiment since it varies with tip size, emitter length, and distance between the emitter and the mass spectrometer inlet. Therefore, it is important to determine if varying the flow rate affects the amount of drug calculated inside an individual cell. For this experiment, over 27 cells treated under the same condition were measured at two different flow rates (25 and 50 nL/min). The amounts of drug molecules measured at different flow rates were not significantly different (p > 0.05). The concentration of internal standard is also critical for qSCMS experiments, and it needs to be carefully selected. Excessively high concentrations of the internal standard may suppress the ion signals of analytes; however, inadequate abundance of internal standard may not be observed during the experiment. To study the effect of internal standard concentration, two different concentrations of d-irinotecan were tested (25 and 50 nM). Over 45 cells treated using the same condition were measured using each concentration of internal standard, and the obtained amounts of drug molecule were not significantly different (p > 0.05).
Method Validation.
Validation experiments were carried out to verify that the Single-probe qSCMS technique is capable of highly efficiently sampling and detecting target analytes from single cells retained in microwells on the glass chip. A series of volumes (2–9 nL) of irinotecan solution (10 nM) were delivered into individual microwells on the glass chip to acquire known amounts (22.7–93.7 amol) of drug compound in those microwells. Similar to the Single-probe qSCMS measurements, this experimental setup was utilized with a continuous flow of internal standard (d-irinotecan with the same concentration, 10 nM) to extract irinotecan in microwells for MS analysis. By plotting the ratio of the integrated ion intensities of irinotecan to d-irinotecan against the ratio of the solution volumes of irinotecan to d-irinotecan, the slope, y-intercept, and R2 value were determined (Figure S2). The slope of 1.01 with an R2 = 0.98 suggests that the Single-probe qSCMS method is able to recover nearly all of the target analyte. The Single-probe has a high ionization efficiency that is comparable to the regular nano-ESI emitter.27,43 Particularly, the LOD of irinotecan was determined to be 10 fM (Figure S3) employing the optimized tuning conditions for this drug compound. Using the Single-probe qSCMS setup, the minimum amount of irinotecan that can be detected in microwells is about 2 × 10⁻²⁰ mol (with S/N > 3), indicating its excellent sensitivity for MS analysis of small amounts of analytes.
QSCMS of the Anti-Cancer Drug Irinotecan in Human Cancer Cell Lines.
Single-probe qSCMS analysis of the standard-of-care anticancer drug irinotecan in individual HCT-116 and HeLa human cancer cells is reported (Figure 5 and Table 1). The adherent HCT-116 colon adenocarcinoma and HeLa cervical cancer cell lines were treated with irinotecan using a range of concentrations and treatment times (Figure 5 and Table 1). Single cells inside microwells (i.e., one cell/microwell) were used in the quantitative SCMS measurements. Internal standard (d-irinotecan) concentrations of 25 and 50 nM were used. We collected eight sets of data from both cell lines treated under different conditions, and more than 30 cells were measured for each set of SCMS experiments. Rank sum tests (Mann-Whitney U tests) were conducted to determine whether there is a statistically significant difference of drug quantity between each pair of data sets. In general, the drug uptake amounts from individual cells exhibit a broad range of values, which are likely attributed to the heterogeneity of individual cells.
Figure 5.

Box plot depicting the amount of irinotecan (amol) inside individual HeLa and HCT-116 cells at varying treatment concentrations and times.
Table 1.
Amount of Irinotecan (amol) Found inside Single Cells for Varying Treatment Times and Concentrations Using Both qSCMS and LCMS Analysis
| (a) Results from HeLa Cells | ||
|---|---|---|
| treatment conditions | SCMS results (× 10−18 mol) | LCMS results (× 10−18 mol) |
| 100 nM, 0.5 h | 1.9 ± 1.8 | 1.3 ± 0.5 |
| 100 nM, 1 h | 3.2 ± 3.0 | 1.9 ± 1.1 |
| 1 μM, 0.5 h | 9.8 ± 7.1 | 3.9 ± 3.0 |
| 1 μM, 1 h | 14.7 ± 10.4 | 4.2 ± 1.2 |
| (b) Results from HCT-116 Cells | ||
| treatment conditions | SCMS results (× 10−18 mol) | LCMS results (× 10−18 mol) |
| 100 nM, 0.5 h | 5.3 ± 5.1 | 2.5 ± 0.2 |
| 100 nM, 1 h | 8.5 ± 8.4 | 2.5 ± 0.8 |
| 1 μM, 0.5 h | 15.2 ± 14.1 | 10.5 ± 1.7 |
| 1 μM, 1 h | 23.1 ± 16.7 | 11.6 ± 3.4 |
The Single-probe qSCMS measurements show several clear trends connecting cellular treatment with intracellular drug levels. Increasing irinotecan treatment concentrations in the HCT-116 cellular media from 0.1 to 1.0 μM increased the average intracellular irinotecan levels in individual cells. Using the low−18 and 8.5 ± 8.4 × 10⁻¹⁸ mol (attomole or amole) for cells treated for 0.5 and 1.0 h, respectively. Larger amounts of intracellular drug molecules were obtained from cells treated with a higher concentration (1. 0 μM): 15.2 ± 14.1 and 23.1 ± 16.7 amol for the treatment time of 0.5 and 1 h, respectively. The increased drug uptake amounts from individual cells in different groups are statistically significant (p < 0.01) (Figure 5). In contrast, increasing the treatment time from 0.5 to 1.0 h, while keeping the same drug concentration, has no significant effect (p > 0.05) on drug uptake.
For HeLa cells, a similar trend was found: increasing the drug concentration from 0.1 to 1.0 μM significantly (p < 0.001) increases the drug uptake amounts (Figure 5). Cells treated with 0.1 μM irinotecan reported intracellular drug amounts of 1.9 ± 1.8 and 3.2 ± 3.0 amol for 0.5- and 1.0-h treatment times, respectively. Increasing the drug treatment concentration to 1.0 μM increases the drug uptake amount to 9.8 ± 7.1 and 14.7 ± 10.4 amol for 0.5- and 1.0-h treatment times, respectively. Additionally, keeping the same drug treatment concentrations (0.1 or 1.0 μM) while increasing the treatment time from 0.5 to 1.0 h has no significant influence (p > 0.05) on intracellular drug levels. The qSCMS studies suggest that both HCT-116 and HeLa cells rapidly absorb drug compound from media.
Our experiments clearly show that cellular drug uptake amounts vary between HCT-116 and HeLa cell lines (Figure 2). Although both cell lines exhibit very similar trends of drug uptake amount, the intracellular drug amounts in single HCT-116 cells are significantly higher (p < 0.001) than those in single HeLa cells treated under the same conditions in all cases. These differences are likely attributed to multiple reasons. First, the cell sizes of these two cell lines are different. The average volume of an HCT cell (3.26 ± 0.11 pL) is about 1.3 times the volume of a single HeLa cell (2.6 ± 0.4 pL),44,45 so larger cells may have higher drug uptake amount. Second, it is possible that HCT-116 cells have a higher efficiency of irinotecan uptake since irinotecan has shown to have a greater aptitude toward the treatment of colon cancer than cervical cancer46.
Comparison of SCMS and LC/MS Results.
For comparison studies, we prepared cell lysate samples (see “Cell Sample Preparation”) and conducted traditional LC/MS experiments to measure the average amount of irinotecan inside of a single cell for both lines. d-Irinotecan at known concentrations was added during the preparation of cell lysate. Using nano-UPLC/MS, ion signals of both regular and d-irinotecan were measured. The average drug amount in a single cell was estimated by considering multiple factors, including the peak areas of both regular and d-irinotecan, the concentration of d-irinotecan in cell lysate samples, and the total number of cells in each sample.
In general, a similar trend for both SCMS and LC/MS has been observed: a higher drug treatment concentration and/or longer treatment time results in higher drug uptake for both cell lines. However, the amounts of irinotecan measured from quantitative SCMS experiments are significantly higher than those from LC/MS experiments for both cell lines treated under all conditions (Table 1). For example, HCT-116 cells that underwent 0.1 μM treatment for 1 h gave values of 8.5 ± 8.4 and 2.5 ± 0.8 amol for SCMS and LC/MS experiments, respectively. The U-test results indicate that these results are significantly different (p < 0.001). Similarly, treating cells with 1 μM irinotecan for 1 h gave averaged values of 23.1 ± 16.7 and 11.6 ± 3.4 amol for SCMS and LC/MS measurements (p < 0.001), respectively. A similar trend was found for 0.5-h drug-treated groups under different drug treatment concentrations (0.1 and 1 μM) in HeLa cell line experiments.
The difference between these two methods is likely due to two major reasons. Cell heterogeneity in SCMS experiments can be attributed to the large standard deviation, and the possible drug loss during the lengthy LC/MS sample preparation process could contribute to SCMS having larger values. First, cellular heterogeneity is likely to influence cellular phenotypes since every cell is unique and is the product of its own particular genome, epigenome, and cell status. It is becoming clear that the differences among individual cells, even within a supposedly homogeneous cell-type, can influence the behavior of a biological system.40 All of these differences among individual cells are critical for the cell functions, which may alter the capability of drug uptake. Second, the difference of cell sample preparation is likely to induce variance between the different measurements. SCMS involves minimal sample preparation, so there is less of a chance of drug compound loss between sample preparation and measurement. In contrast, cell lysate samples used for traditional LC/MS experiments involve multiple-step preparation. After anticancer drug treatment, cells undergo multiple steps that can possibly result in drug compound loss, such as trypsin detachment, multiple rounds of rinsing cells and centrifugation, and organic solvent extraction. Unfortunately, the internal standard cannot be added into cell samples during these steps to compensate for drug compound loss during these steps, and it is impractical to measure the portion of drug compound lost during these steps. In contrast, drug-treated cells are rinsed with either untreated (FBS-free) culture media or PBS and followed by immediate analysis for qSCMS experiments, minimizing drug compound loss from target single cells.
Since cells were measured in a near-native environment in SCMS experiments, the results are likely more representative of cellular status than LC/MS experiments. However, our qSCMS approach has its own limitations. First, similar to other Single-probe SCMS measurements, cells are retained in cell culture medium to maintain their viability, and no chromatographic separations are used during the in situ, real-time analysis. Thus, the detection sensitivity of target molecules may suffer from matrix effect due to the complex compositions of culture medium and cellular contents. Second, solvent extraction is performed at the single-cell level to extract drug compounds for MS analysis, which makes this method suitable to detect and quantify free and loosely bonded drugs inside single cells. However, if drug compounds form tight interactions such as covalent bonds with DNA or proteins,14,47 they are not likely to be extracted by solvent during the SCMS measurement. Nevertheless, the influence of extraction efficiency of free and loosely bonded drug molecules on the qSCMS measurement is compensated using the isotopically labeled internal standard because they both undergo the same processes (e.g., extraction, ionization, and detection) during experiments. Third, we measured approximately 30 cells for each treatment condition due to the limited SCMS experimental throughput. An increased throughput of the quantitative SCMS technique will significantly enhance experimental efficiency. Last, our current studies provide the absolute amount of drug compound inside single cells. However, we were unable to measure the volume of cells using the current experimental setup to provide intracellular drug concentration, which is likely to be of great interest for fundamental research and the pharmaceutical industry. Therefore, future technology development and more detailed studies are needed to enable deeper understanding of anticancer drug uptake and pharmacokinetics studies.
■ CONCLUSION
In the present study, we utilized the Single-probe qSCMS technique to measure the absolute amount of the anticancer drug compound irinotecan from live single cells in real time. Two cell lines, HCT-116 and HeLa, were used as the model systems and subjected to drug treatment using a series of concentrations and times. The sampling solvent containing d-irinotecan, the internal standard, was delivered to the Singleprobe device to perform microscale extraction of cellular contents. Both irinotecan and its internal standard were simultaneously detected in real-time MS analysis, and the absolute drug uptake amounts from individual cells were estimated. Our results indicate that for single cells treated using the same conditions, drug uptake amounts were broadly distributed. For cells treated under different concentrations and times, drug concentration is likely to have a more significant influence on the drug uptake amount than treatment time. Comparison between the two cell lines indicate that HCT-116 cells contain significantly more irinotecan than HeLa cells. Drug uptake amounts obtained from single cells were also compared with the results measured from cell lysates using LC/MS. The results obtained at the single-cell level were significantly higher than those from population cell measurements, which can be attributed to cell heterogeneity and potential drug compound loss during cell lysate preparation. This qSCMS technology is applicable of the analysis of many other types of drug compounds, drug metabolites, and cellular metabolites of interest and can lead to better understanding of pharmacokinetics and potential applications of compounds in precision medicine, including patient samples, to revolutionize personal chemotherapeutics.
Supplementary Material
ACKNOWLEDGMENTS
The authors thank Prof. Matthew Shair (Harvard University) for providing cell lines used in the current studies and Prof. Michael Patten (University of Oklahoma) for consulting statistical data analysis.
Funding
This research was supported by grants from the National Institute of Health (R01GM116116 and R21CA204706).
Footnotes
Supporting Information
The Supporting Information is available free of charge on the ACS Publications website at DOI: 10.1021/acs.analchem.9b01311.
qSCMS method validation (PDF)
The authors declare no competing financial interest.
REFERENCES
- (1).Chen X; Love JC; Navin NE; Pachter L; Stubbington MJT; Svensson V; Sweedler JV; Teichmann SA Nat. Biotechnol 2016, 34, 1111. [DOI] [PubMed] [Google Scholar]
- (2).Vasdekis AE; Stephanopoulos G Metab. Eng 2015, 27, 115–135. [DOI] [PMC free article] [PubMed] [Google Scholar]
- (3).Wang D; Bodovitz S Trends Biotechnol. 2010, 28 (6), 281–290. [DOI] [PMC free article] [PubMed] [Google Scholar]
- (4).Polat AN; Oizlu N Analyst 2014, 139 (19), 4733–4749. [DOI] [PubMed] [Google Scholar]
- (5).Rubakhin SS; Romanova EV; Nemes P; Sweedler JV Nat. Methods 2011, 8 (4), S20–S29. [DOI] [PMC free article] [PubMed] [Google Scholar]
- (6).Svatos A Anal. Chem 2011, 83 (13), 5037–5044. [DOI] [PubMed] [Google Scholar]
- (7).Mizuno H; Tsuyama N; Harada T; Masujima TJ Mass Spectrom 2008, 43 (12), 1692–1700. [DOI] [PubMed] [Google Scholar]
- (8).Junot C; Fenaille F; Colsch B; Becher F Mass Spectrom. Rev 2014, 33 (6), 471–500. [DOI] [PubMed] [Google Scholar]
- (9).Shrestha B; Vertes A Relative Quantitation in Single-Cell Metabolomics by Laser Ablation Electrospray Mass Spectrometry BT -Plant Metabolism: Methods and Protocols; Sriram G, Ed.; Humana Press: Totowa, NJ, 2014; pp 31–39. [DOI] [PubMed] [Google Scholar]
- (10).Hiyama E; Ali A; Amer S; Harada T; Shimamoto K; Furushima R; Abouleila Y; Emara S; Masujima T Anal. Sci 2015, 31 (12), 1215–1217. [DOI] [PubMed] [Google Scholar]
- (11).Fujii S; Matsuda S; Esaki T; Sakane I; Mizuno H; Tsuyama N; Masujima T; Tejedor ML Nat. Protoc 2015, 10 (9), 1445. [DOI] [PubMed] [Google Scholar]
- (12).Neupert S; Rubakhin SS; Sweedler JV Chem. Biol 2012, 19 (8), 1010–1019. [DOI] [PMC free article] [PubMed] [Google Scholar]
- (13).Murakami I; Oh Y; Morimoto A; Sano H; Kanzaki S; Matsushita M; Iwasaki T; Kuwamoto S; Kato M; Nagata K; et al. Clin. Proteomics 2015, 12 (1), 16. [DOI] [PMC free article] [PubMed] [Google Scholar]
- (14).Specht H; Slavov NJ Proteome Res 2018, 17 (8), 2565–2571. [DOI] [PMC free article] [PubMed] [Google Scholar]
- (15).Boggio KJ; Obasuyi E; Sugino K; Nelson SB; Agar NY; Agar JN Expert Rev. Proteomics 2011, 8 (5), 591–604. [DOI] [PMC free article] [PubMed] [Google Scholar]
- (16).Zavalin A; Todd EM; Rawhouser PD; Yang J; Norris JL; Caprioli RM J. Mass Spectrom 2012, 47 (11), i–i. [DOI] [PMC free article] [PubMed] [Google Scholar]
- (17).Krismer J; Steinhoff RF; Zenobi R Chimia 2016, 70, 236–239. [DOI] [PubMed] [Google Scholar]
- (18).Fu Q; Tang J; Cui M; Xing J; Liu Z; Liu SJ Mass Spectrom. 2016, 51, 62–68. [DOI] [PubMed] [Google Scholar]
- (19).Passarelli MK; Newman CF; Marshall PS; West A; Gilmore IS; Bunch J; Alexander MR; Dollery CT Anal. Chem 2015, 87 (13), 6696–6702. [DOI] [PubMed] [Google Scholar]
- (20).Ostrowski SG; Kurczy ME; Roddy TP; Winograd N; Ewing AG Anal. Chem 2007, 79 (10), 3554–3560. [DOI] [PMC free article] [PubMed] [Google Scholar]
- (21).Ibanez AJ; Fagerer SR; Schmidt AM; Urban PL; Jefimovs K; Geiger P; Dechant R; Heinemann M; Zenobi R Proc. Natl. Acad. Sci. U. S. A 2013, 110 (22), 8790–8794. [DOI] [PMC free article] [PubMed] [Google Scholar]
- (22).Lanni EJ; Rubakhin SS; Sweedler JV J. Proteomics 2012, 75 (16), 5036–5051. [DOI] [PMC free article] [PubMed] [Google Scholar]
- (23).Ong T-H; Kissick DJ; Jansson ET; Comi TJ; Romanova EV; Rubakhin SS; Sweedler JV Anal. Chem 2015, 87 (14), 7036–7042. [DOI] [PMC free article] [PubMed] [Google Scholar]
- (24).Passarelli MK; Ewing AG; Winograd N Anal. Chem 2013, 85 (4), 2231–2238. [DOI] [PMC free article] [PubMed] [Google Scholar]
- (25).Yang Y; Huang Y; Wu J; Liu N; Deng J; Luan T TrAC Trends Anal. Chem 2017, 90, 14–26. [Google Scholar]
- (26).Rao W; Pan N; Yang ZJ Vis. Exp 2016, No. 112, 53911. [DOI] [PMC free article] [PubMed] [Google Scholar]
- (27).Pan N; Rao W; Kothapalli NR; Liu R; Burgett AWG; Yang Z Anal. Chem 2014, 86 (19), 9376–9380. [DOI] [PubMed] [Google Scholar]
- (28).Pan N; Rao W; Standke SJ; Yang Z Anal. Chem 2016, 88 (13), 6812–6819. [DOI] [PMC free article] [PubMed] [Google Scholar]
- (29).Tian X; Zhang G; Shao Y; Yang Z Anal. Chim. Acta 2018, 1037, 211–219. [DOI] [PMC free article] [PubMed] [Google Scholar]
- (30).Sun M; Yang Z Anal. Chem 2019, 91 (3), 2384–2391. [DOI] [PMC free article] [PubMed] [Google Scholar]
- (31).Liu R; Zhang G; Yang Z Chem. Commun 2019, 55 (5), 616–619. [DOI] [PMC free article] [PubMed] [Google Scholar]
- (32).Standke SJ; Colby DH; Bensen RC; Burgett AWG; Yang Z Anal. Chem 2019, 91 (3), 1738–1742. [DOI] [PMC free article] [PubMed] [Google Scholar]
- (33).Sun M; Yang Z; Wawrik B Front. Plant Sci 2018, 9, 571. [DOI] [PMC free article] [PubMed] [Google Scholar]
- (34).Rao W; Pan N; Yang ZJ Am. Soc. Mass Spectrom 2015, 26 (6), 986–993. [DOI] [PubMed] [Google Scholar]
- (35).Rao W; Pan N; Tian X; Yang ZJ Am. Soc. Mass Spectrom 2016, 27 (1), 124–134. [DOI] [PMC free article] [PubMed] [Google Scholar]
- (36).Sun M; Tian X; Yang Z Anal. Chem 2017, 89 (17), 9069–9076. [DOI] [PMC free article] [PubMed] [Google Scholar]
- (37).Urban PL Philos. Trans. A. Math. Phys. Eng. Sci 2016, 374 (2079), 20150382. [DOI] [PMC free article] [PubMed] [Google Scholar]
- (38).Duncan MW; Roder H; Hunsucker SW Brief. Funct. Genomic. Proteomic 2008, 7 (5), 355–370. [DOI] [PMC free article] [PubMed] [Google Scholar]
- (39).Yin R; Prabhakaran V; Laskin J Anal. Chem 2018, 90 (13), 7937–7945. [DOI] [PubMed] [Google Scholar]
- (40).Bergman H-M; Lanekoff I Analyst 2017, 142 (19), 3639–3647. [DOI] [PubMed] [Google Scholar]
- (41).Shrestha B; Sripadi P; Reschke BR; Henderson HD; Powell MJ; Moody SA; Vertes A PLoS One 2014, 9 (12), e115173. [DOI] [PMC free article] [PubMed] [Google Scholar]
- (42).Thomas M; Heath BS; Laskin J; Li D; Liu E; Hui K; Kuprat AP; van Dam KK; Carson JP Conf. Proc. Annu. Int. Conf. IEEE Eng. Med. Biol. Soc. IEEE Eng. Med. Biol. Soc. Annu. Conf 2012, 2012, 5545–5548. [DOI] [PubMed] [Google Scholar]
- (43).Liu R; Pan N; Zhu Y; Yang Z Anal. Chem 2018, 90 (18), 11078–11085. [DOI] [PMC free article] [PubMed] [Google Scholar]
- (44).Tahara M; Inoue T; Miyakura Y; Horie H; Yasuda Y; Fujii H; Kotake K; Sugano K Biochem. Biophys. Res. Commun 2013, 434 (4), 753–759. [DOI] [PubMed] [Google Scholar]
- (45).Luchette M; Korideck H; Makrigiorgos M; Tillement O; Berbeco R Nanomedicine Nanotechnology, Biol. Med 2014, 10 (8), 1751–1755. [DOI] [PubMed] [Google Scholar]
- (46).Rothenberg ML Oncologist 2001, 6, 66–80. [DOI] [PubMed] [Google Scholar]
- (47).Rubakhin SS; Sweedler JV Anal. Chem 2008, 80 (18), 7128–7136. [DOI] [PMC free article] [PubMed] [Google Scholar]
Associated Data
This section collects any data citations, data availability statements, or supplementary materials included in this article.