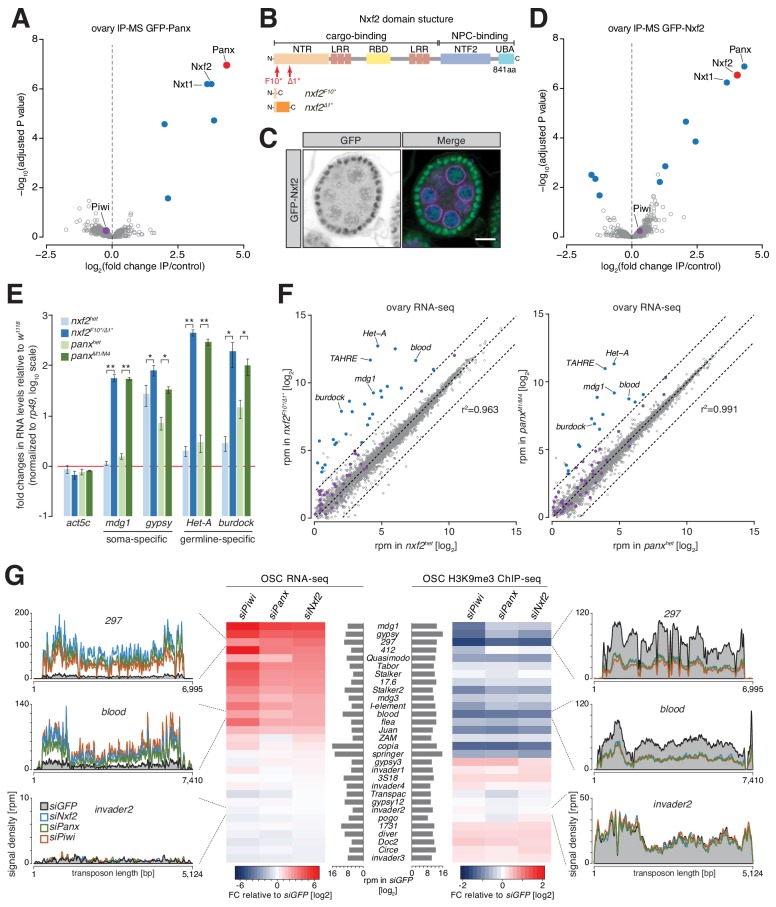
Figure 1. Nxf2 is a piRNA pathway factor that functions in transcriptional gene silencing.
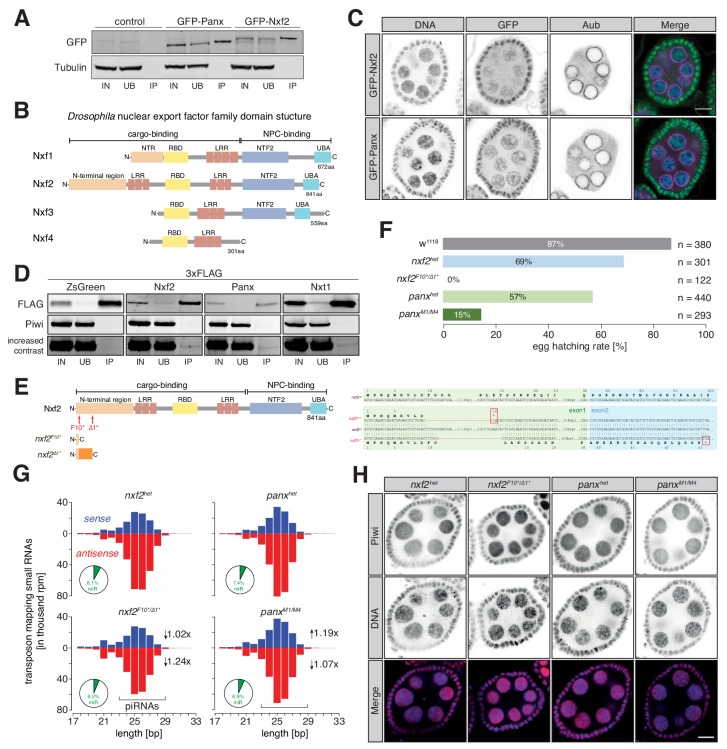
(A) Volcano plot showing enrichment values and corresponding significance levels for proteins co-purified with GFP-Panx from ovary lysates (n = 4 for GFP-Panx and n = 3 for control ovaries). Proteins with fold change >2 and adjusted P value < 0.05 are highlighted in blue. The bait protein is labeled in red and Piwi is shown in purple. (B) Cartoon displaying the Nxf2 domain structure and generated mutants. NTR, amino-terminal region; LRR, leucine rich repeats; RBD, RNA-binding domain; NTF2, NTF2-like domain; UBA, Ubiquitin associated domain. (C) Expression and localization of GFP-Nxf2 in an egg chamber is shown by immunofluorescence (see also Figure 1—figure supplement 1C). Green, GFP-Nxf2; magenta, Aubergine; blue, DNA. Scale bar, 10 µm. (D) as (A) but co-purification from GFP-Nxf2 ovary lysates (GFP-Nxf2, n = 4; control, n = 3). (E) Bar graphs showing fold changes in steady-state RNA levels of soma- (mdg1, gypsy) and germline- (HeT-A, burdock) specific transposons in total ovarian RNA from the indicated genotypes (relative to wild-type and normalized to rp49). * denotes P value < 0.05; ** denotes p<0.001 (unpaired t-test). Error bars indicate standard deviation (n = 3). (F) Scatter plots showing expression levels (reads per million sequenced reads) of genes (in grey) and transposons (in purple) from total RNA from ovaries of the indicated genotypes (left, nxf2; right, panx; n = 3; r2 values represent expression of genes only). Transposons whose abundance change more than four-fold compared to heterozygotes are highlighted in blue. (G) Heat maps showing RNA-seq (left) and H3K9me3 ChIP-seq (right) of the 30 most expressed transposons in OSCs (compared with siGFP) upon the indicated knockdowns. Density profiles of normalized reads from RNA-seq (left) and H3K9me3 ChIP-seq (right) experiments mapping to the indicated transposons.


