

Abstract
Major depressive disorder (MDD) is highly prevalent and associated with considerable morbidity, yet its pathophysiology remains only partially understood. While numerous studies have investigated the neurobiological correlates of MDD, most have used only a single neuroimaging modality. In particular, diffusion tensor imaging (DTI) studies have failed to yield uniform results. In this context, examining key tracts and using information from multiple neuroimaging modalities may better characterize potential abnormalities in the MDD brain. This study analyzed data from 30 participants with MDD and 26 healthy participants who underwent DTI, magnetic resonance spectroscopy (MRS), resting‐state functional magnetic resonance imaging (fMRI), and magnetoencephalography (MEG). Tracts connecting the subgenual anterior cingulate cortex (sgACC) and the left and right amygdala, as well as connections to the left and right hippocampus and thalamus, were examined as target areas. Reduced fractional anisotropy (FA) was observed in the studied tracts. Significant differences in the correlation between medial prefrontal glutamate concentrations and FA were also observed between MDD and healthy participants along tracts connecting the sgACC and right amygdala; healthy participants exhibited a strong correlation but MDD participants showed no such relationship. In the same tract, a correlation was observed between FA and subsequent antidepressant response to ketamine infusion in MDD participants. Exploratory models also suggested group differences in the relationship between DTI, fMRI, and MEG measures. This study is the first to combine MRS, DTI, fMRI, and MEG data to obtain multimodal indices of MDD and antidepressant response and may lay the foundation for similar future analyses.
Keywords: diffusion tensor imaging, functional magnetic resonance imaging, magnetic resonance spectroscopy, magnetoencephalography, major depressive disorder, multimodal
1. INTRODUCTION
Major depressive disorder (MDD) is a highly prevalent disease associated with significant morbidity. Despite multiple neurobiological studies, the precise etiology of MDD remains poorly understood. In this context, many studies have used both functional and structural techniques to investigate connectivity as a potential source of depressive symptomatology. Although functional connectivity studies have revealed relatively consistent alterations in brain circuitry (Kaiser, Andrews‐Hanna, Wager, & Pizzagalli, 2015), structural connectivity studies have, to date, been less informative. Structural connectivity is most readily assessed using diffusion tensor imaging (DTI), which provides a measure of the directionality of water diffusion across the brain (Basser, Pajevic, Pierpaoli, Duda, & Aldroubi, 2000). This directionality can be parameterized as fractional anisotropy (FA), which is frequently used as a proxy measure for “white matter integrity.” The two largest studies to date, each of which enrolled over 130 subjects, reported no group differences in FA between depressed and control samples across the whole brain (Choi et al., 2014; Olvet et al., 2016). A meta‐analysis that incorporated data from 188 MDD subjects and 221 healthy controls (HCs) found that MDD subjects had reduced FA in the left superior longitudinal fasciculus and increased FA in the right inferior fronto‐occipital fasciculus (Murphy & Frodl, 2011). Another, more recent meta‐analysis (N = 231 MDD subjects and 261 HCs) observed decreased FA in MDD subjects in the right inferior longitudinal fasciculus and also found reduced FA in the right inferior fronto‐occipital fasciculus, in direct contrast to findings from the prior meta‐analysis (Liao et al., 2013). Subsequent whole brain studies have also produced inconsistent results, with a variety of abnormalities reported.
Given the heterogeneity of findings from whole brain studies, an investigation of specific target tracts may provide more useful information. Indeed, overwhelming evidence implicates the subgenual anterior cingulate (sgACC) and the amygdala [reviewed in (Drevets, 2003; Drevets, Savitz, & Trimble, 2008)] in the pathophysiology of MDD, and these abnormalities have been observed across multiple neuroimaging modalities. Other studies have observed reduced hippocampal and thalamus volumes in MDD (Nugent, Davis, Zarate Jr., & Drevets, 2013). Abnormalities in white matter tracts—specifically the uncinate fasciculus (UF), the tapetum of the corpus callosum, the fornix, and the stria terminalis—have also been reported in the literature, including complex interactions between DTI parameters and other clinical or neurobiological variables. Most recently, Bhatia, Henderson, Hsu, and Yim (2018) found reduced FA in the UF and cingulum bundle, specifically in portions of the tract connecting the sgACC and amygdala. Other studies have reported that reduced white matter integrity in the UF correlated with severity of depression (Zhang et al., 2012), anhedonia (Yang et al., 2017), and early life trauma (Hanson, Knodt, Brigidi, & Hariri, 2015).
Studies have also examined the integrity of the UF and antidepressant response in MDD subjects. For instance, reduced apathy in response to treatment with selective serotonin reuptake inhibitors (SSRIs) was found to significantly correlate with greater FA in the UF (Yuen et al., 2014), and FA abnormalities in the left UF were found to resolve after SSRI treatment (Zheng et al., 2018). Interestingly, MDD carriers of the brain‐derived neurotrophic factor (BDNF) Met allele were recently found to have lower FA in the UF than subjects homozygous for the Val allele; the same study reported correlations between FA and severity of depression that were modulated by both BDNF genotype and the 5‐HTTLPR genotype (Tatham, Hall, Clark, Foster, & Ramasubbu, 2017).
It should also be noted that, in the context of using neuroimaging techniques to elucidate structural connectivity issues in MDD subjects, there is precedence in the literature for integrating multiple modalities, particularly in corticolimbic tracts. For instance, Duncan et al. (2013) combined magnetic resonance spectroscopy (MRS), DTI, and resting‐state functional magnetic resonance imaging (fMRI) and found that glutamate concentrations in the medial prefrontal cortex predicted functional connectivity with subcortical regions including the thalamus; the same study showed an additional relationship between functional and structural connectivity in HCs. Numerous studies [most prominently (Honey et al., 2009)] have also examined the correlation between structural connectivity (as assessed via DTI) and functional connectivity (as assessed via fMRI) and found that the two are positively correlated across the brain. Although fewer studies have integrated magnetoencephalography (MEG) with MRS, fMRI, or DTI, there is reason to believe that these metrics would be correlated. Gamma oscillations, for instance, are in part mediated by α‐amino‐3‐hydroxy‐5‐methyl‐4‐isoxazolepropionic acid receptor dynamics and reflect overall inhibition/excitation balance (Buzsaki & Wang, 2012); thus, they may be related to glutamate concentrations. Moreover, gamma oscillations appear to correlate with fMRI blood‐oxygen‐level‐dependent signal (Mulert et al., 2010; Niessing et al., 2005), as well as with fMRI functional connectivity (Shmuel & Leopold, 2008). Other studies that combined MEG measures with DTI found that white matter pathways were involved in coordinating alpha oscillations (Hindriks et al., 2015). Another study observed exaggerated coupling between structural connectivity (assessed via DTI) and functional connectivity (assessed via MEG) within the salience and ventral attention networks in MDD subjects (Bi et al., 2016). Given these previously observed relationships, it is probable that complex relationships exist across multiple neuroimaging modalities.
Rather than investigate whole brain connectivity, this study integrated multiple imaging modalities to investigate specific tracts connecting regions of interest (ROIs) identified a priori in MDD subjects, specifically the sgACC and amygdala as primary targets and the hippocampus and thalamus as secondary targets. The primary sgACC and amygdala pathway would primarily encompass the UF. The specific neuroimaging modalities included DTI, glutamate levels derived from MRS, functional connectivity derived from resting state fMRI, and MEG resting gamma power. Data were drawn from a previously conducted clinical trial that sought to elucidate the mechanism of action of the glutamatergic modulator ketamine (Nugent et al., 2018). While analyses of some of these data have previously been published (Evans, Lally, et al., 2018; Evans, Szczepanik, et al., 2018; Nugent et al., 2018), this study is the first to describe the data collected using DTI and to present all of these data together for comparative purposes. The first aim of this exploratory study was to evaluate differences between HCs and MDD subjects for markers derived from these imaging modalities, particularly in the tracts selected a priori. The second aim was to determine whether additional differences between groups could be observed based on the interaction of these markers. This study is unique in its incorporation of multiple modalities.
2. METHODS
2.1. Participants
Thirty‐five subjects with MDD and 26 HCs were recruited for a double‐blind, placebo‐controlled, crossover trial of 0.5 mg/kg IV ketamine compared to (saline) placebo (NCT00088699). Details regarding participant characteristics and the efficacy of ketamine have previously been published (Nugent et al., 2018). Research participants received MEG, 3 T fMRI, and 7 T MRS scans at study baseline, typically 2–3 days before the first ketamine infusion; 31 of the 35 MDD subjects and all 26 HCs also had study baseline DTI. Diagnoses were confirmed using the Structured Clinical Interview for the Diagnostic and Statistical Manual of Mental Disorders, version IV‐TR (DSM‐IV‐TR) as well as an unstructured interview with a psychiatrist. HCs had no personal or family history (first‐degree relative) of any DSM‐IV‐TR Axis I psychiatric disorder. At the time of scanning, all participants had been free of any psychotropic medications, or any other medications with potential effects on neurological function, for at least 2 weeks (5 weeks for fluoxetine). All participants were medically healthy as determined by medical history, physical exam, blood tests, electrocardiogram, and urinalysis. The study was approved by the NIH combined CNS IRB, and all subjects gave written informed consent.
2.2. Data acquisition
Structural MRI, fMRI, and DTI were collected on a 3 T GE system (GE Healthcare, Milwaukee, WI) using an eight‐channel phased array coil. A total of 60 diffusion‐weighted volumes were acquired (repetition time [TR] = 20.4 s, echo time (TE) = 86 ms, flip angle = 90, slice thickness = 2.5 mm, FOV = 240 mm, 96 × 96 resolution, resampled to 128 × 128 for reconstruction). Of the 60 diffusion‐weighted images, 6, 12, and 42 images were acquired with b‐values of 0, 300, and 1,100 s/mm2, respectively. For coregistration, both T1 (T1 = 8.84 ms, TE = 3.5 ms, inversion time = 450 ms, flip angle = 13, slice thickness = 1 mm, in‐plane resolution = 1 × 1 mm2) and T2 (BRAVO, TR = 7.1 s, TE = 100.6 ms, flip angle = 90, resolution = 1 mm isotropic) images were acquired. Resting‐state functional gradient‐echo planar images (EPIs) were acquired while subjects were instructed to relax with their eyes closed for the duration of the 8‐min scan (TR = 2.5 s, TE = 25 ms, flip angle = 90, slice thickness = 3.5 mm, in‐plane resolution = 3.75 × 3.75 mm2); group and session differences have previously been reported (Evans, Szczepanik, et al., 2018). Physiological data were acquired using a pneumatic respiratory belt and pulse oximetry device. Spectroscopy data were collected on a 7 T Siemens system (Siemens Medical Solutions, Erlangen, Germany). MRS data were acquired from the pregenual anterior cingulate as previously reported (An et al., 2015; Lally et al., 2016) using a PRESS sequence with J‐suppression (TR = 2.5 s, TE1 = 69 ms, TE2 = 37 ms, 20 mm cubical voxel); group differences have previously been reported (Evans, Lally, et al., 2018). MEG recordings were acquired on a 275‐channel CTF system (Coquitlam, BC, Canada) at 1,200 Hz, as previously described (Nugent et al., 2018).
Because subjects were enrolled in a double‐blind, placebo‐controlled, crossover ketamine trial, the Supplemental Methods also includes information regarding the collection of clinical data as well as correlations between clinical data and multimodal outcome measures.
2.3. Data processing: DTI and anatomical ROI data
DTI data were preprocessed using Tolerably Obsessive Registration and Tensor Optimization Indolent Software Ensemble, NIH, Bethesda, MD (Pierpaoli et al., 2010). Images were corrected for motion, eddy current, and B0 related distortions, re‐aligned in time, and co‐registered to the T2 anatomical image. Additional processing was performed using Analysis of Functional NeuroImages [AFNI, NIH (Cox, 1996)] and the Functional and Tractographic Connectivity Toolbox AFNI toolbox [FATCAT (Taylor & Saad, 2013)]. The diffusion tensor was calculated using the FATCAT routine 3dDWItoDT. Uncertainty of the diffusion tensor parameters were calculated using jackknifing implemented in the 3dDWUncert routine using 500 iterations.
FreeSurfer 5.3 [Massachusetts General Hospital, Boston, MA (Fischl et al., 2002)] was used to perform subcortical segmentation. Left and right amygdala (Amyg), hippocampus (Hipp), and thalamus (Thal) ROIs for each subject were obtained in native T1 anatomical space. The subcortical ROIs were transformed from T1 anatomical space to DTI space using an affine transformation derived from the T1 structural MRI. The sgACC ROI was defined by outlining a trapezoidal ROI on the Talairach template image (TT_N27) distributed with AFNI. To derive the transform matrix required to align the template sgACC ROI to each subject's anatomical space, the T1 anatomical image was first aligned to the T2 anatomical (the space of the DTI images) using an affine transform; the T1 aligned to DTI space was then transformed to Talairach space. These transforms were then combined and inverted to derive a single transform to take the sgACC ROI from Talairach space to DTI space. The ROIs underwent further processing using the FATCAT routing 3dROIMaker for use with tractography only. Each ROI was inflated until the edge voxels overlapped white matter, defined as FA > 0.2; all ROIs were inflated simultaneously such that the final ROIs did not overlap. Deterministic tractography was calculated for the whole brain for all subjects for visualization purposes. For quantitative data analysis, probabilistic tractography was performed using the 3dTrackID routine within the FATCAT toolbox between all pairs of ROIs and the following parameters: FA threshold = 0.2, max turning angle = 60, minimum tract length = 20 mm, five seeds per voxel, and 1,000 Monte Carlo iterations. Probabilistic tractography maps and metrics were calculated for all possible pairs of ROIs, and only those with nonzero values for all subjects were included in the statistical analyses. Throughout the text, we refer to each tract/region pair by an abbreviation for the two constituent regions, with an “L” or “R” denoting left or right lateralized (e.g., LHipp–RHipp; amygdala = Amyg; thalamus = Thal; hippocampus = Hipp).
2.4. Data processing: Additional modalities
The other modalities included in this study (resting state fMRI, MRS, and MEG) were each processed using independent pipelines; primary data have been reported elsewhere (see citations below). In order to integrate modalities, the previously used processing streams were retained for each modality, and the DTI space ROIs were then transformed to the space of each independent modality analysis.
All fMRI data processing was carried out using AFNI, as previously described (Evans, Szczepanik, et al., 2018). Briefly, EPIs were corrected for time series spikes, slice timing, and motion and physiological noise. Functional images were transformed to Montreal Neurological Institute (MNI) space, smoothed, and band‐pass filtered. General linear modeling was performed using motion as well as physiological and baseline regressors, and residuals were used to determine connectivity maps for the primary analysis (Evans, Szczepanik, et al., 2018). Our ROIs in native T1 anatomical space were transformed to the MNI space of the resting state data, and the AFNI FATCAT routine 3dNetCorr was used to derive connectivity matrices for the sets of ROIs.
MRS data were processed as previously described (Evans, Lally, et al., 2018). Spectra were fit using a custom linear fitting program (Li, An, & Shen, 2015) implemented in IDL (Harris Geospatial Solutions, Melbourne, FL). Metabolites included in the linear fit were glutamate, glutamine, glutathione, γ‐aminobutyric acid, N‐acetyl‐aspartame, N‐acetylaspartylglutamate, choline (Cho), and creatine (Cr). The reliability of the sequence and fitting routine has also previously been reported (Lally et al., 2016).
MEG data were processed as previously described (Nugent et al., 2018). Gamma power (30–50 Hz) was calculated from up to five to ten 15‐s segments of artifact‐free data, projected into anatomical space using synthetic aperture magnetometry [SAM, (Robinson & Vrba, 1999)], and transformed to Talairach space. The DTI space ROIs were transformed to Talairach space, and the mean gamma power within each ROI was calculated. As a representation of gamma power for each ROI pair tract measured with DTI, the mean gamma power for both ROI targets was calculated and then natural log transformed to increase the normality of the distribution.
2.5. Statistical analysis: Group differences in individual metrics
First, we investigated any group differences in the DTI measures of interest: FA, mean diffusivity, radial diffusivity (RD), number of tracts (normalized by the surface area of the target ROIs [NTnorm]), and the volume of tracts (VolTr) for each ROI connection pair. In order to ensure that errors in our statistical models (described below) were normally distributed, a square root transform for both NTnorm and VolTr was used. Linear mixed models with a compound symmetry or heterogeneous compound symmetry residual covariance matrix of ROI connection pairs (estimated separately by diagnosis where necessary) were used; diagnosis and ROI pair × diagnosis interaction were entered as fixed effects. Age and gender were modeled as main effects only. Each DTI metric was evaluated using a separate mixed model. The primary aim was assessed within these models using specific contrasts for the difference between diagnostic group in the LAmyg–sgACC and RAmyg–sgACC tracts for each metric, uncorrected. We hypothesized that the MDD group would exhibit reduced white matter integrity compared to HCs in these tracts. Similar mixed models were performed to compare the fMRI, MRS, and MEG measures between groups; the MEG measure was log‐normal transformed to reduce non‐normality in the model residuals. An identical mixed model structure was used for fMRI connectivity and MEG gamma power between ROI pairs and, again, significant post hoc tests are reported for the tracts selected a priori (p < .05). False discovery rate (FDR) corrected p values are reported for the remaining tracts. Because MRS was performed in only one voxel, there was no repeated measure of ROI.
2.6. Statistical analysis: Exploratory multimodal analyses
In order to reduce the total number of comparisons, further exploratory analyses were conducted only for DTI metrics that showed at least a trend toward significant differences between MDD subjects and HCs (p < 0.1). For the tracts identified a priori (LAmyg–sgACC and RAmyg–sgACC, encompassing the UF), Pearson correlations were calculated between the identified DTI metrics, fMRI connectivity, MEG gamma power, and medial prefrontal glutamate concentrations both across and within diagnostic groups. Where either group showed a significant correlation, these were compared between groups using the Fisher r‐to‐z transformation. FDR corrected p values are reported for each correlation matrix, both within each group and independently for tracts identified a priori.
To further examine the relationship between variables, our final exploratory analysis sought to determine if the functional variables of gamma power and fMRI connectivity predicted structural connectivity. Although we initially considered including MRS, unfortunately only 19 subjects (seven with MDD) had usable datasets for all modalities (DTI, MRS, fMRI, and MEG). However, 31 subjects (13 with MDD) had usable datasets for DTI, fMRI, and MEG. Our exploratory hypothesis was that there would be a difference between diagnostic groups in the interaction between fMRI connectivity and MEG gamma power on the DTI metrics. In order to test this hypothesis, we estimated a mixed model incorporating all three modalities (DTI, fMRI, and MEG), then tested specific contrasts for the between‐group differences in fMRI connectivity and MEG gamma power interaction for each tract. Results are reported for the tracts identified a priori first and then for all tracts (FDR corrected). Results for the full model are presented in the Supporting Information. Due to the small sample size, these results should be considered preliminary and hypothesis generating in nature. It should be pointed out, however, that models of this nature may identify convergent evidence from multiple modalities, and may be more robust than any single modality alone.
3. RESULTS
3.1. Subjects
Demographic data appear in Table 1; no age or gender differences were observed between HCs and MDD subjects. Of the 31 original MDD subjects, one was excluded after tract definition due to extremely small calculated tracts. MDD subjects had a mean Montgomery–Asberg Depression Rating Scale score of 33, placing them in the moderate to severe range. Approximately 40% reported a past suicide attempt.
Table 1.
Demographic variables for subjects included in the analysis
| HCs (N = 26) | MDD (N = 30) | |
|---|---|---|
| Age mean (SD) | 34 (10.3) | 35 (9.4) |
| Gender % female | 61.5 | 53.0 |
| N with valid MRS | 14 | 15 |
| N with valid MEG | 22 | 19 |
| N with valid fMRI | 21 | 22 |
| MADRS at baseline (SD) | 33 (4.4) | |
| Age of onset (SD) | 15 (6.1) | |
| Length of illness (SD) | 19 (9.8) | |
| Number with past suicide attempt | 12 | |
| Percent change at Day 1 following ketamine (N = 28) | −29.1 (32.8) |
fMRI, functional magnetic resonance imaging; MADRS, Montgomery–Asberg Depression Rating Scale; MEG, magnetoencephalography; MRS, magnetic resonance spectroscopy.
3.2. Group differences in DTI measures
Our seven selected ROI regions—the sgACC as well as left and right amygdala, hippocampus, and thalamus—led to a total of 21 possible pairs. Figure 1 displays the nonzero number of tracts for all subjects between 14 of these pairs. Tracts were found between the sgACC and bilateral amygdala and thalamus; both left and right amygdalae were also connected to the ipsilateral hippocampus and thalamus. Similarly, left and right hippocampi were connected to the ipsilateral thalamus. The contralateral hippocampi were connected, as were the contralateral thalamic ROIs. Finally, both the left and right amygdalae were also connected with the contralateral hippocampus. For adjacent region pairs, such as the tracts between left and right thalamus, the tracts comprised all those shared by both ROIs. For the sake of brevity, where results are given below, abbreviations will be used for ROI pairs.
Figure 1.
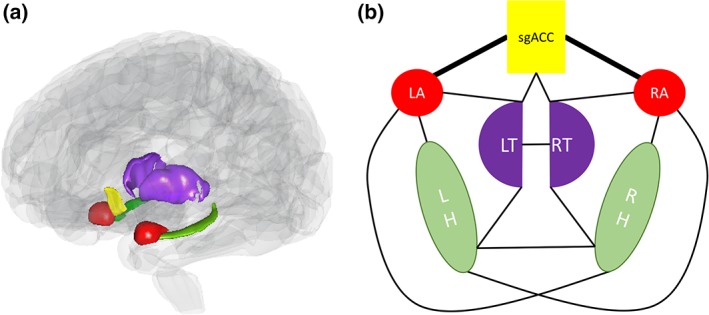
(a) Translucent brain showing regions included in the analysis. (b) Schematic of regions included in the analysis, along with lines denoting nonzero tracts between a given region of interest pair [Color figure can be viewed at http://wileyonlinelibrary.com]
In mixed models incorporating all region pairs, a significant effect of diagnosis on FA was observed (F 1,45 = 5.05, p = .030), but there was no diagnosis‐by‐region interaction. In post hoc t tests for each ROI pair, FA was significantly reduced in RAmyg–RThal (p FDR = .038), LHipp–RHipp (p FDR = .039), LHipp–RThal (p FDR = .026), RHipp–RThal (p FDR = .026), and LThal–RThal (p FDR = .026) in MDD subjects compared to HCs after FDR correction, even though FA was not reduced in the Amyg–sgACC tracts identified a priori. For RD, a trend toward a significant effect of diagnosis was observed (F 1,43 = 3.02, p = .090), again with no significant diagnosis‐by‐region interaction. As with FA, RD did not differ between groups in the Amyg–sgACC tracts selected a priori, although trends toward differences were observed for RAmyg–RHipp, RAmyg–RThal, LHipp–RThal, RHipp–LThal, RHipp–RThal, and LThal–RThal (.05 < p FDR < .1). The normalized number of tracts showed a significant diagnosis‐by‐tract interaction (F 13,106 = 2.04, p = .024), but the effect of diagnosis was not significant in any ROI pair after FDR correction for multiple comparisons (p FDR > .1). For illustrative purposes, the least square means of FA and RD for each set of tracts in HCs and MDD subjects is shown in Figure 2a,b, respectively.
Figure 2.
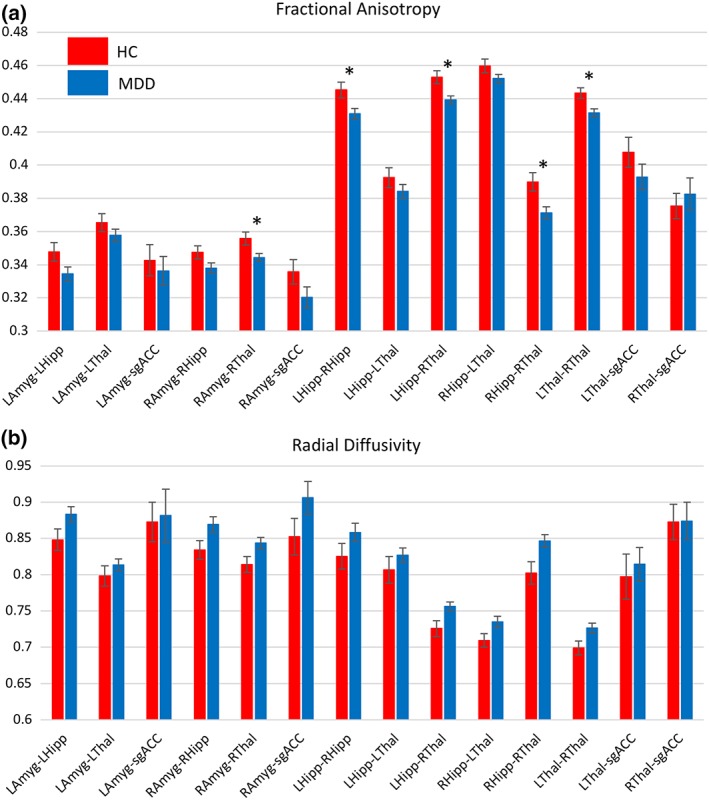
Bar graphs showing least square means from each region of interest (ROI) pair calculated from mixed models investigating diagnostic differences in (a) fractional anisotropy (FA) and (b) radial diffusivity (RD).  —ROI pair selected a priori showing a trend toward significant difference between diagnoses (p = .058).
—ROI pair selected a priori significant at p < .05. *—ROI pair significant after FDR correction over 12 secondary ROI pairs [Color figure can be viewed at http://wileyonlinelibrary.com]
—ROI pair selected a priori showing a trend toward significant difference between diagnoses (p = .058).
—ROI pair selected a priori significant at p < .05. *—ROI pair significant after FDR correction over 12 secondary ROI pairs [Color figure can be viewed at http://wileyonlinelibrary.com]
3.3. Group differences in secondary measures
Glutamate levels did not differ between groups (14 HCs and 15 MDD subjects; main effect of diagnosis F 1,25 = 1.59, p = .22), consistent with previously reported data (Evans, Lally, et al., 2018). In addition, no group differences in fMRI connectivity in the ROIs assessed here were noted (21 HCs and 22 MDD subjects; main effect of diagnosis F 1,41 = 0.15, p = .70). There was a trend toward a significant main effect of diagnosis for gamma power (22 HCs and 19 MDD subjects; main effect of diagnosis F 1,37 = 3.14, p = .084) but no significant diagnosis‐by‐region interaction; gamma power was larger in HCs than in MDD subjects for all regions. Post hoc tests in the ROI pairs identified a priori were significant for RAmyg–sgACC (F 1,43 = 4.19, p = .0468) and showed a trend toward significance for LAmyg–sgACC (F 1,43 = 3.8, p = .058). No other ROI pair was significant after FDR correction.
3.4. Correlations between measures: Bilateral amygdala and sgACC tracts
Heat maps illustrating the correlation coefficients between modalities within groups are shown in Figure 3, scatter plots are shown in Figure 4, and results appear in Supporting Table S1. Across groups, correlations between Glu/Cr and mean gamma power were noted for both the LAmyg–sgACC (R = −.484, p = .026, p FDR = .078) and the RAmyg–sgACC (R = −0.512, p = .018, p FDR > .1) ROI pairs, although neither survived correction for multiple comparisons (Figure 4a,c). Correlations were also observed between fMRI connectivity and both FA (R = .360, p = .018, p FDR = .078) and RD (R = −.417, p = .0054, p FDR = .049, Figure 4b) for the LAmyg–sgACC tracts, with the finding for fMRI and RD surviving correction for multiple comparisons. The relationships between fMRI and DTI parameters were primarily driven by the correlations in MDD subjects (FA: R = .590, p = .0039, p FDR = .035; RD: R = −.494, p = .020, p FDR = .09), with the finding for FA surviving correction for multiple comparisons. Interestingly, HCs showed a trend toward relationships between medial prefrontal Glu/Cr and both FA (R = −.615, p = .019, p FDR = .086) and RD (R = .675, p = .0081, p FDR = .073) for the RAmyg–sgACC tract; this relationship was absent in the MDD subjects. Notably, the correlation significantly differed between diagnostic groups (FA: z = −1.97, p = .049; RD: z = 2.35, p = .019, Figure 4b).
Figure 3.
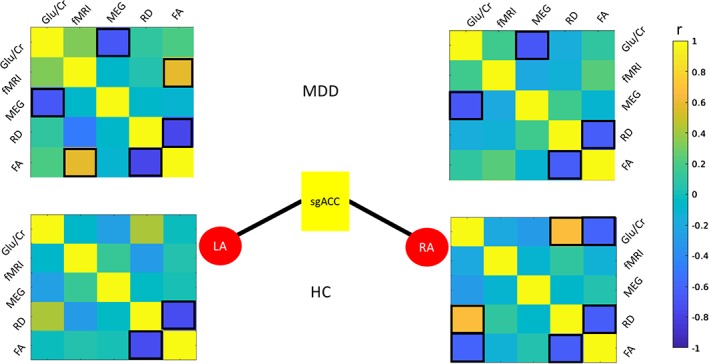
Correlations between measures for a priori region pairs LAmyg–sgACC and RAmyg–sgACC for MDD (top) and HC (bottom). Correlations significant at p < .05 are highlighted with black boxes. For brevity, MEG gamma power is abbreviated “MEG” and fMRI connectivity is abbreviated “fMRI.” fMRI, functional magnetic resonance imaging; HC, healthy control; LAmyg, left amygdala; MDD, major depressive disorder; MEG, magnetoencephalography; RAmyg, right amygdala; sgACC, subgenual anterior cingulate cortex [Color figure can be viewed at http://wileyonlinelibrary.com]
Figure 4.
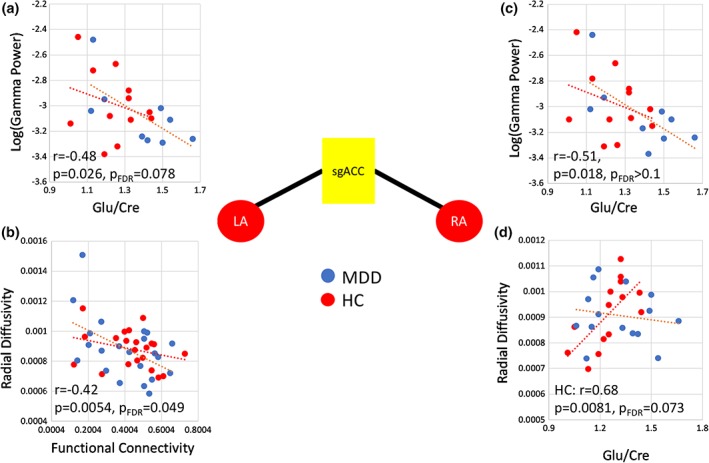
Correlations between measures for a priori region pairs LAmyg–sgACC and RAmyg–sgACC. (a and c) Significant correlations between gamma power in the ROI pair and prefrontal glutamate/creatine (Glu/Cr) for both LAmyg–sgACC and RAmyg–sgACC, respectively. For LAmyg–sgACC, a significant correlation was observed between (b) fMRI function and RD. (d) for RAmyg–sgACC, RD significantly correlated with Glu/Cr in HCs but not in subjects with MDD; this difference was statistically significant between groups (RD: z = 2.35, p = .019). fMRI, functional magnetic resonance imaging; HC, healthy control; LAmyg: left amygdala; MDD, major depressive disorder; RAmyg: right amygdala; RD, radial diffusivity; ROI, region of interest; sgACC, subgenual anterior cingulate cortex [Color figure can be viewed at http://wileyonlinelibrary.com]
3.5. Exploratory mixed model including multiple modalities
Possible differences between diagnostic groups in the interaction of fMRI connectivity and MEG gamma power in predicting DTI metrics were examined next. Our primary interest was the tracts identified a priori, although all tracts were tested. The results of the contrasts for the regions selected a priori appear in Table 2, and additional results for the remaining tracts appear in Table 3. RD in the RAmyg–sgACC tract was predicted by the relationship between gamma power and fMRI connectivity in HCs (t 26 = 4.02, p = .0004) and differed significantly between diagnostic groups (t 30 = 2.56, p = .0159). This finding could be interpreted as a difference in the relationship between diffusivity and functional connectivity depending upon mean gamma power. HCs with higher gamma power showed a positive relationship between diffusivity and functional connectivity, while subjects with lower gamma power tended to show an inverse relationship; MDD participants showed no interaction. Alternatively, this could be interpreted as a difference in the relationship between structural connectivity and gamma power depending on fMRI connectivity; subjects with higher functional connectivity had a positive relationship between diffusivity and gamma power, while subjects with lower functional connectivity had an inverse relationship. The available data do not allow us to determine which interpretation is more appropriate. No additional ROI pairs reached significance after correction for multiple comparisons. To aid in interpretation, a plot of predicted data from the model appears in Supporting Figure S1. The full output of the mixed models used to estimate the above contrasts appears in Supporting Tables S2 and S3.
Table 2.
Interaction of fMRI connectivity and MEG gamma power in predicting DTI metrics in tracts selected a priori
| Left amygdala—sgACC | |||||
|---|---|---|---|---|---|
| Fractional anisotropy | Estimate | SE | df | t | p |
| fMRI × MEG: HC | −0.025 | 0.334 | 14.160 | −0.080 | .941 |
| fMRI × MEG: MDD | −0.315 | 0.357 | 8.323 | −0.880 | .402 |
| fMRI × MEG: HC–MDD | 0.289 | 0.488 | 20.360 | 0.590 | .560 |
| Radial diffusivity | Estimate | SE | df | t | p |
| fMRI × MEG: HC | 0.258 | 0.790 | 18.480 | 0.330 | .748 |
| fMRI × MEG: MDD | 1.540 | 1.231 | 7.483 | 1.250 | .249 |
| fMRI × MEG: HC–MDD | −1.281 | 1.460 | 14.040 | −0.880 | .395 |
| Right amygdala—sgACC | |||||
| Fractional anisotropy | Estimate | SE | df | t | p |
| fMRI × MEG: | −0.271 | 0.276 | 21.020 | −0.980 | .338 |
| fMRI × MEG: MDD | 0.164 | 0.401 | 9.221 | 0.410 | .692 |
| fMRI × MEG: HC–MDD | −0.434 | 0.487 | 18.220 | −0.890 | .384 |
| Radial diffusivity | Estimate | SE | df | t | p |
| fMRI × MEG: HC | 2.785 | 0.693 | 25.790 | 4.020 | .000 |
| fMRI × MEG: MDD | 0.308 | 0.676 | 10.040 | 0.460 | .659 |
| fMRI × MEG: HC–MDD | 2.477 | 0.969 | 29.470 | 2.560 | .016 |
DTI, diffusion tensor imaging; fMRI, functional magnetic resonance imaging; HC, healthy control; sgACC, subgenual anterior cingulate cortex; MDD, major depressive disorder; MEG, magnetoencephalography.
Table 3.
Interaction of fMRI connectivity and MEG gamma power in predicting DTI metrics in the remaining tracts
| Radial diffusivity: fMRI ×MEG HC–MDD | Estimate | SE | df | t value | Pr > |t| |
|---|---|---|---|---|---|
| LAmyg–LHipp | −0.505 | 0.974 | 34.800 | −0.520 | 0.607 |
| LAmyg–LThal | 0.196 | 0.447 | 33.920 | 0.440 | 0.665 |
| RAmyg–RHipp | −0.233 | 0.588 | 27.590 | −0.400 | 0.695 |
| RAmyg–RThal | 0.560 | 0.539 | 24.380 | 1.040 | 0.308 |
| LHipp–RHipp | −3.197 | 2.537 | 15.620 | −1.260 | 0.226 |
| LHipp–LThal | −0.354 | 0.997 | 25.990 | −0.350 | 0.726 |
| LHipp–RThal | −0.788 | 0.616 | 24.410 | −1.280 | 0.213 |
| RHipp–LThal | 0.089 | 0.579 | 19.080 | 0.150 | 0.879 |
| RHipp–RThal | 0.048 | 0.646 | 27.910 | 0.070 | 0.942 |
| LThal–RThal | −2.986 | 1.910 | 11.230 | −1.560 | 0.146 |
| LThal–sgACC | 0.056 | 1.297 | 27.120 | 0.040 | 0.966 |
| RThal–sgACC | 1.334 | 1.188 | 25.020 | 1.120 | 0.272 |
| Fractional anisotropy fMRI × MEG HC–MDD | Estimate | SE | df | t value | Pr > |t| |
| LAmyg–LHipp | 0.100 | 0.357 | 29.100 | 0.280 | 0.782 |
| LAmyg–LThal | 0.070 | 0.187 | 21.530 | 0.380 | 0.709 |
| RAmyg–RHipp | 0.079 | 0.186 | 21.100 | 0.430 | 0.675 |
| RAmyg–RThal | −0.181 | 0.194 | 21.600 | −0.930 | 0.361 |
| LHipp–RHipp | −0.029 | 0.650 | 15.860 | −0.040 | 0.965 |
| LHipp–LThal | −0.089 | 0.385 | 21.760 | −0.230 | 0.819 |
| LHipp–RThal | 0.261 | 0.210 | 28.780 | 1.240 | 0.224 |
| RHipp–LThal | −0.084 | 0.235 | 26.090 | −0.360 | 0.722 |
| RHipp–RThal | 0.158 | 0.305 | 19.660 | 0.520 | 0.611 |
| LThal–RThal | −0.269 | 0.733 | 17.070 | −0.370 | 0.718 |
| LThal–sgACC | 0.378 | 0.443 | 23.570 | 0.850 | 0.402 |
| RThal–sgACC | −0.272 | 0.418 | 22.410 | −0.650 | 0.521 |
Abbreviations: DTI, diffusion tensor imaging; fMRI, functional magnetic resonance imaging; HC: healthy control; LAmyg/RAmyg, left/right amygdala; LHipp/RHipp, left/right hippocampus; LThal/RThal, left/right thalamus; MDD, major depressive disorder; MEG, magnetoencephalographyl; sgACC, subgenual anterior cingulate cortex.
4. DISCUSSION
This unique study is the first to combine data from MRS, DTI, fMRI, and MEG to obtain multimodal indices of MDD and antidepressant response. Significant reductions in FA were observed across several corticolimbic tracts, as was a trend toward increased RD; both of these findings suggest reduced white matter integrity in these tracts in MDD subjects. In the tracts identified, a priori connecting the RAmyg–sgACC and LAmyg–sgACC, several significant cross‐modal correlations were observed. Functional connectivity was significantly correlated with both FA and RD, a finding that was, surprisingly, most robust in the MDD subjects. In addition, HCs showed robust coupling between prefrontal glutamate levels and both FA and RD in the RAmyg–sgACC tract, a finding that was absent in the MDD subjects. Finally, complex interactions between modalities were observed in the RAmyg–sgACC tracts. While these results should be considered exploratory in nature, they represent the first such analysis and should be considered hypothesis generating.
As noted above, multiple DTI findings have been reported in MDD, most commonly reduced FA. A similar result was observed here, most prominently in the tracts between LHipp–RHipp (comprising the tapetum of the corpus callosum), as well as tracts shared by the thalamus and hippocampus, including the fornix. It should be noted, however, that reductions were observed in all examined tracts, as evidenced by the nonsignificant interaction of diagnosis by ROI pair. These results, taken together with previous findings reporting alterations in many tracts in MDD, suggest rather widespread reductions in white matter integrity.
Our primary hypothesis involved abnormalities in multimodal correlations in the tracts connecting the sgACC to either the LAmyg or RAmyg, comprising the UF and portions of the cingulum bundle. While there is evidence in the literature of widespread correlations between functional and structural connectivity (Honey et al., 2009), here we observed a correlation between these metrics primarily in the MDD subjects in the LAmyg–sgACC tracts. In contrast, de Kwaasteniet et al. (2013)reported a negative correlation between FA and functional connectivity in MDD subjects in the UF and, echoing our findings, no correlation in HCs; however, this finding was specific to one relatively small section of the UF. We also observed that RAmyg–sgACC FA was associated with subsequent response to ketamine, as was LAmyg–sgACC functional connectivity. Vasavada et al. (2016) recently reported that postketamine improvements in depressive symptoms were associated with greater FA and lower RD at baseline in the cingulum and forceps minor, although only nonresponders differed from HCs at baseline. While this contrasts with the present findings, it should be noted that different tracts were examined and that different analytic techniques were employed. Nevertheless, this finding may point to a potential baseline biomarker that predicts response to ketamine.
A significant correlation was also observed between prefrontal glutamate levels and FA in the RAmyg–sgACC tracts in HCs that were absent in the MDD subjects. While it would have been ideal to obtain glutamate from the sgACC rather than pregenual ACC, both regions connect to the amygdala via the UF. A recent study examining a risk allele of the SLC6A15 gene (which has been associated with depression and is believed to modulate glutamate transmission) found that FA differed in the UF between genotypes in HCs but not in MDD subjects, potentially consistent with the notion that glutamate metabolism may be related to FA in HCs but not MDD subjects (Choi et al., 2016).
The finding of an inverse correlation between glutamate levels and gamma power is somewhat counterintuitive. Glutamate is the primary excitatory neurotransmitter, and an infusion of ketamine—an N‐methyl‐d‐aspartate antagonist—results in a surge in synaptic glutamate and robust increases in gamma power (Nugent et al., 2018; Shaw et al., 2015). However, few MEG or MRS studies have directly examined this issue. One small study showed a positive correlation between glutamate concentrations measured via MRS and evoked gamma band power in the occipital cortex (Lally et al., 2014), though it should be noted that the present study involved resting gamma power. Another large study found no relationship between glutamate concentrations and gamma power evoked from a simple visual task (Cousijn et al., 2014).
Our more complex multimodal models are inherently more difficult to interpret. In the RAmyg–sgACC tracts (UF), an interaction between diagnosis, fMRI connectivity, and MEG gamma power was observed. In post hoc tests, the relationship between RD and functional connectivity was modulated by gamma power, whereas in MDD subjects, the relationship between RD and functional connectivity was not affected by differences in gamma power. It is difficult to interpret these findings in light of the relative dearth of information regarding multimodal interactions in the literature. As reviewed earlier, evidence suggests that fMRI connectivity is related to gamma oscillations (Shmuel & Leopold, 2008). The present findings may thus reflect a state of homeostatic flexibility, wherein healthy populations achieve optimum neurobiological function by balancing neuronal oscillations, hemodynamic function, and structural integrity, but dysfunction in one or more of these systems in MDD subjects may not trigger adaptation. However, given the small sample size, any such theories are speculative and require replication.
This study had several limitations. Foremost among these is the small sample size, particularly in our exploratory mixed‐model analysis. The results should therefore be considered preliminary and hypothesis generating; we have attempted to cast the results as such. Second, not all measures were obtained on the same day, which was inevitable given issues of patient scheduling and the time required for assessments. Third, while it would have been preferable to acquire MRS measurements in multiple ROIs, the time required to collect each scan and the interference of susceptibility artifacts made this impractical. Finally, although we selected regions a priori in an attempt to narrow our tests to specific hypotheses, the results are nonetheless at risk of Type I and II errors because we describe a large number of tests.
Despite these limitations, this study remains the first to combine MRS, DTI, fMRI, and MEG data to obtain multimodal indices of MDD and antidepressant response, and we hope it will lay the foundation for similar future analyses. Notably, this study also demonstrates both the feasibility and utility of such analyses. The results identified reduced FA in multiple corticolimbic tracts. In addition, HCs showed coupling of RD and glutamate levels in the right UF as well as coupling of RD, fMRI connectivity, and resting gamma power; both findings were absent in MDD subjects. It should be noted that our results suggest that important differences between healthy volunteers and MDD subjects may only be observable when multiple modalities are considered in a holistic rather than piecemeal fashion. Taken together, these results suggest altered neurobiological processes in the right UF in MDD subjects, with potential implications for response to antidepressants.
CONFLICT OF INTERESTS
Dr C.A.Z. is listed as a coinventor on a patent for the use of ketamine in major depression and suicidal ideation; as a coinventor on a patent for the use of (2R,6R)‐hydroxynorketamine, (S)‐dehydronorketamine, and other stereoisomeric dehydro and hydroxylated metabolites of (R,S)‐ketamine metabolites in the treatment of depression and neuropathic pain; and as a coinventor on a patent application for the use of (2R,6R)‐hydroxynorketamine and (2S,6S)‐hydroxynorketamine in the treatment of depression, anxiety, anhedonia, suicidal ideation, and posttraumatic stress disorders. He has assigned his patent rights to the U.S. government but will share a percentage of any royalties that may be received by the government. All other authors have no conflict of interest to disclose, financial, or otherwise.
Supporting information
Appendix S1 Supporting Information
ACKNOWLEDGMENTS
Funding for this work was supported by the Intramural Research Program at the National Institute of Mental Health, National Institutes of Health (IRP‐NIMH‐NIH; ZIA MH002857), by a Brain and Behavior Mood Disorders Research Award to Dr C.A.Z., and by a NARSAD Independent Investigator Award to Dr C.A.Z. The authors thank the 7SE research unit and staff for their support. Ioline Henter (NIMH) provided invaluable editorial assistance.
Nugent AC, Farmer C, Evans JW, Snider SL, Banerjee D, Zarate CA Jr.. Multimodal imaging reveals a complex pattern of dysfunction in corticolimbic pathways in major depressive disorder. Hum Brain Mapp. 2019;40:3940–3950. 10.1002/hbm.24679
Data Availability Statement: Data are not publicly available due to the absence of data sharing language in the consent forms signed by research participants.
Funding information National Institute of Mental Health, Grant/Award Number: ZIA MH002857
DATA AVAILABILITY
Data are not publicly available due to the absence of data sharing language in the consent forms signed by research participants.
REFERENCES
- An, L. , Li, S. , Murdoch, J. B. , Araneta, M. F. , Johnson, C. , & Shen, J. (2015). Detection of glutamate, glutamine, and glutathione by radiofrequency suppression and echo time optimization at 7 tesla. Magnetic Resonance in Medicine, 73, 451–458. [DOI] [PubMed] [Google Scholar]
- Basser, P. J. , Pajevic, S. , Pierpaoli, C. , Duda, J. , & Aldroubi, A. (2000). In vivo fiber tractography using DT‐MRI data. Magnetic Resonance in Medicine, 44, 625–632. [DOI] [PubMed] [Google Scholar]
- Bhatia, K. D. , Henderson, L. A. , Hsu, E. , & Yim, M. (2018). Reduced integrity of the uncinate fasciculus and cingulum in depression: A stem‐by‐stem analysis. Journal of Affective Disorders, 235, 220–228. [DOI] [PubMed] [Google Scholar]
- Bi, K. , Hua, L. , Wei, M. , Qin, J. , Lu, Q. , & Yao, Z. (2016). Dynamic functional‐structural coupling within acute functional state change phases: Evidence from a depression recognition study. Journal of Affective Disorders, 191, 145–155. [DOI] [PubMed] [Google Scholar]
- Buzsaki, G. , & Wang, X. J. (2012). Mechanisms of gamma oscillations. Annual Review of Neuroscience, 35, 203–225. [DOI] [PMC free article] [PubMed] [Google Scholar]
- Choi, K. S. , Holtzheimer, P. E. , Franco, A. R. , Kelley, M. E. , Dunlop, B. W. , Hu, X. P. , & Mayberg, H. S. (2014). Reconciling variable findings of white matter integrity in major depressive disorder. Neuropsychopharmacology, 39, 1332–1339. [DOI] [PMC free article] [PubMed] [Google Scholar]
- Choi, S. , Han, K. M. , Kang, J. , Won, E. , Chang, H. S. , Tae, W. S. , … Ham, B. J. (2016). Effects of a polymorphism of the neuronal amino acid transporter SLC6A15 gene on structural integrity of white matter tracts in major depressive disorder. PLoS One, 11, e0164301. [DOI] [PMC free article] [PubMed] [Google Scholar]
- Cousijn, H. , Haegens, S. , Wallis, G. , Near, J. , Stokes, M. G. , Harrison, P. J. , & Nobre, A. C. (2014). Resting GABA and glutamate concentrations do not predict visual gamma frequency or amplitude. Proceedings of the National Academy of Sciences of the United States of America, 111, 9301–9306. [DOI] [PMC free article] [PubMed] [Google Scholar]
- Cox, R. W. (1996). AFNI: Software for analysis and visualization of functional magnetic resonance neuroimages. Computers and Biomedical Research, 29, 162–173. [DOI] [PubMed] [Google Scholar]
- de Kwaasteniet, B. , Ruhe, E. , Caan, M. , Rive, M. , Olabarriaga, S. , Groefsema, M. , … Denys, D. (2013). Relation between structural and functional connectivity in major depressive disorder. Biological Psychiatry, 74, 40–47. [DOI] [PubMed] [Google Scholar]
- Drevets, W. C. (2003). Neuroimaging abnormalities in the amygdala in mood disorders. Annals of the New York Academy of Sciences, 985, 420–444. [DOI] [PubMed] [Google Scholar]
- Drevets, W. C. , Savitz, J. , & Trimble, M. (2008). The subgenual anterior cingulate cortex in mood disorders. CNS Spectrums, 13, 663–681. [DOI] [PMC free article] [PubMed] [Google Scholar]
- Duncan, N. W. , Wiebking, C. , Tiret, B. , Marjanska, M. , Hayes, D. J. , Lyttleton, O. , … Northoff, G. (2013). Glutamate concentration in the medial prefrontal cortex predicts resting‐state cortical‐subcortical functional connectivity in humans. PLoS One, 8, e60312. [DOI] [PMC free article] [PubMed] [Google Scholar]
- Evans, J. W. , Lally, N. , An, L. , Li, N. , Nugent, A. C. , Banerjee, D. , … Zarate, C. A., Jr. (2018). 7T (1)H‐MRS in major depressive disorder: A ketamine treatment study. Neuropsychopharmacology, 43, 1908–1914. [DOI] [PMC free article] [PubMed] [Google Scholar]
- Evans, J. W. , Szczepanik, J. , Brutsche, N. , Park, L. T. , Nugent, A. C. , & Zarate, C. A., Jr. (2018). Default mode connectivity in major depressive disorder measured up to 10 days after ketamine administration. Biological Psychiatry, 84, 582–590. [DOI] [PMC free article] [PubMed] [Google Scholar]
- Fischl, B. , Salat, D. H. , Busa, E. , Albert, M. , Dieterich, M. , Haselgrove, C. , … Dale, A. M. (2002). Whole brain segmentation: Automated labeling of neuroanatomical structures in the human brain. Neuron, 33, 341–355. [DOI] [PubMed] [Google Scholar]
- Hanson, J. L. , Knodt, A. R. , Brigidi, B. D. , & Hariri, A. R. (2015). Lower structural integrity of the uncinate fasciculus is associated with a history of child maltreatment and future psychological vulnerability to stress. Development and Psychopathology, 27, 1611–1619. [DOI] [PMC free article] [PubMed] [Google Scholar]
- Hindriks, R. , Woolrich, M. , Luckhoo, H. , Joensson, M. , Mohseni, H. , Kringelbach, M. L. , & Deco, G. (2015). Role of white‐matter pathways in coordinating alpha oscillations in resting visual cortex. NeuroImage, 106, 328–339. [DOI] [PubMed] [Google Scholar]
- Honey, C. J. , Sporns, O. , Cammoun, L. , Gigandet, X. , Thiran, J. P. , Meuli, R. , & Hagmann, P. (2009). Predicting human resting‐state functional connectivity from structural connectivity. Proceedings of the National Academy of Sciences of the United States of America, 106, 2035–2040. [DOI] [PMC free article] [PubMed] [Google Scholar]
- Kaiser, R. H. , Andrews‐Hanna, J. R. , Wager, T. D. , & Pizzagalli, D. A. (2015). Large‐scale network dysfunction in major depressive disorder: A meta‐analysis of resting‐state functional connectivity. JAMA Psychiatry, 72, 603–611. [DOI] [PMC free article] [PubMed] [Google Scholar]
- Lally, N. , An, L. , Banerjee, D. , Niciu, M. J. , Luckenbaugh, D. A. , Richards, E. M. , … Nugent, A. C. (2016). Reliability of 7T (1) H‐MRS measured human prefrontal cortex glutamate, glutamine, and glutathione signals using an adapted echo time optimized PRESS sequence: A between‐ and within‐sessions investigation. Journal of Magnetic Resonance Imaging, 43, 88–98. [DOI] [PMC free article] [PubMed] [Google Scholar]
- Lally, N. , Mullins, P. G. , Roberts, M. V. , Price, D. , Gruber, T. , & Haenschel, C. (2014). Glutamatergic correlates of gamma‐band oscillatory activity during cognition: A concurrent ER‐MRS and EEG study. NeuroImage, 85(Pt 2), 823–833. [DOI] [PubMed] [Google Scholar]
- Li, N. , An, L. , & Shen, J. (2015). Spectral fitting using basis set modified by measured B0 field distribution. NMR in Biomedicine, 28, 1707–1715. [DOI] [PMC free article] [PubMed] [Google Scholar]
- Liao, Y. , Huang, X. , Wu, Q. , Yang, C. , Kuang, W. , Du, M. , … Gong, Q. (2013). Is depression a disconnection syndrome? Meta‐analysis of diffusion tensor imaging studies in patients with MDD. Journal of Psychiatry & Neuroscience, 38, 49–56. [DOI] [PMC free article] [PubMed] [Google Scholar]
- Mulert, C. , Leicht, G. , Hepp, P. , Kirsch, V. , Karch, S. , Pogarell, O. , … McCarley, R. W. (2010). Single‐trial coupling of the gamma‐band response and the corresponding BOLD signal. NeuroImage, 49, 2238–2247. [DOI] [PubMed] [Google Scholar]
- Murphy, M. L. , & Frodl, T. (2011). Meta‐analysis of diffusion tensor imaging studies shows altered fractional anisotropy occurring in distinct brain areas in association with depression. Biology of Mood & Anxiety Disorders, 1, 3. [DOI] [PMC free article] [PubMed] [Google Scholar]
- Niessing, J. , Ebisch, B. , Schmidt, K. E. , Niessing, M. , Singer, W. , & Galuske, R. A. (2005). Hemodynamic signals correlate tightly with synchronized gamma oscillations. Science, 309, 948–951. [DOI] [PubMed] [Google Scholar]
- Nugent, A. C. , Ballard, E. D. , Gould, T. D. , Park, L. T. , Moaddel, R. , Brutsche, N. E. , & Zarate, C. A., Jr. (2018). Ketamine has distinct electrophysiological and behavioral effects in depressed and healthy subjects. Molecular Psychiatry. 10.1038/s41380-018-0028-2. [Epub ahead of print] [DOI] [PMC free article] [PubMed] [Google Scholar]
- Nugent, A. C. , Davis, R. M. , Zarate, C. A., Jr. , & Drevets, W. C. (2013). Reduced thalamic volumes in major depressive disorder. Psychiatry Research, 213, 179–185. [DOI] [PMC free article] [PubMed] [Google Scholar]
- Olvet, D. M. , Delaparte, L. , Yeh, F. C. , DeLorenzo, C. , McGrath, P. J. , Weissman, M. M. , … Parsey, R. V. (2016). A comprehensive examination of white matter tracts and connectometry in major depressive disorder. Depression and Anxiety, 33, 56–65. [DOI] [PMC free article] [PubMed] [Google Scholar]
- Pierpaoli, C. , Walker, L. , Irfanoglu, M. O. , Barnett, A. , Basser, P. J. , Chang, L. ‐C. , … Wu, M. (2010) TORTOISE: An integrated software package for processing of diffusion MRI data. In ISMRM 18th Annual Meeting; Stockholm, Sweden.
- Robinson, S. E. , & Vrba, J. (1999). Functional neuroimaging by synthetic aperture magnetometry (SAM) (pp. 302–305). Sendai, Japan: Tohoku University Press. [Google Scholar]
- Shaw, A. D. , Saxena, N. , L, E. J. , Hall, J. E. , Singh, K. D. , & Muthukumaraswamy, S. D. (2015). Ketamine amplifies induced gamma frequency oscillations in the human cerebral cortex. European Neuropsychopharmacology, 25, 1136–1146. [DOI] [PubMed] [Google Scholar]
- Shmuel, A. , & Leopold, D. A. (2008). Neuronal correlates of spontaneous fluctuations in fMRI signals in monkey visual cortex: Implications for functional connectivity at rest. Human Brain Mapping, 29, 751–761. [DOI] [PMC free article] [PubMed] [Google Scholar]
- Tatham, E. L. , Hall, G. B. , Clark, D. , Foster, J. , & Ramasubbu, R. (2017). The 5‐HTTLPR and BDNF polymorphisms moderate the association between uncinate fasciculus connectivity and antidepressants treatment response in major depression. European Archives of Psychiatry and Clinical Neuroscience, 267, 135–147. [DOI] [PubMed] [Google Scholar]
- Taylor, P. A. , & Saad, Z. S. (2013). FATCAT: (an efficient) functional and tractographic connectivity analysis toolbox. Brain Connectivity, 3, 523–535. [DOI] [PMC free article] [PubMed] [Google Scholar]
- Vasavada, M. M. , Leaver, A. M. , Espinoza, R. T. , Joshi, S. H. , Njau, S. N. , Woods, R. P. , & Narr, K. L. (2016). Structural connectivity and response to ketamine therapy in major depression: A preliminary study. Journal of Affective Disorders, 190, 836–841. [DOI] [PMC free article] [PubMed] [Google Scholar]
- Yang, X. H. , Wang, Y. , Wang, D. F. , Tian, K. , Cheung, E. F. C. , Xie, G. R. , & Chan, R. C. K. (2017). White matter microstructural abnormalities and their association with anticipatory anhedonia in depression. Psychiatry Research: Neuroimaging, 264, 29–34. [DOI] [PubMed] [Google Scholar]
- Yuen, G. S. , Gunning, F. M. , Woods, E. , Klimstra, S. A. , Hoptman, M. J. , & Alexopoulos, G. S. (2014). Neuroanatomical correlates of apathy in late‐life depression and antidepressant treatment response. Journal of Affective Disorders, 166, 179–186. [DOI] [PMC free article] [PubMed] [Google Scholar]
- Zhang, A. , Leow, A. , Ajilore, O. , Lamar, M. , Yang, S. , Joseph, J. , … Kumar, A. (2012). Quantitative tract‐specific measures of uncinate and cingulum in major depression using diffusion tensor imaging. Neuropsychopharmacology, 37, 959–967. [DOI] [PMC free article] [PubMed] [Google Scholar]
- Zheng, K. Z. , Wang, H. N. , Liu, J. , Xi, Y. B. , Li, L. , Zhang, X. , … Li, B. J. (2018). Incapacity to control emotion in major depression may arise from disrupted white matter integrity and OFC‐amygdala inhibition. CNS Neuroscience & Therapeutics, 24, 1053–1062. [DOI] [PMC free article] [PubMed] [Google Scholar]
Associated Data
This section collects any data citations, data availability statements, or supplementary materials included in this article.
Supplementary Materials
Appendix S1 Supporting Information
Data Availability Statement
Data are not publicly available due to the absence of data sharing language in the consent forms signed by research participants.