

Abstract
As the water-gas shift (WGS) reaction serves as a crucial industrial process, strategies for developing robust WGS catalysts are highly desiderated. Here we report the construction of stabilized bulk-nano interfaces to fabricate highly efficient copper-ceria catalyst for the WGS reaction. With an in-situ structural transformation, small CeO2 nanoparticles (2–3 nm) are stabilized on bulk Cu to form abundant CeO2-Cu interfaces, which maintain well-dispersed under reaction conditions. This inverse CeO2/Cu catalyst shows excellent WGS performances, of which the activity is 5 times higher than other reported Cu catalysts. Long-term stability is also very solid under harsh conditions. Mechanistic study illustrates that for the inverse CeO2/Cu catalyst, superb capability of H2O dissociation and CO oxidation facilitates WGS process via the combination of associative and redox mechanisms. This work paves a way to fabricate robust catalysts by combining the advantages of bulk and nano-sized catalysts. Catalysts with such inverse configurations show great potential in practical WGS applications.
Subject terms: Heterogeneous catalysis, Solid-state chemistry, Catalytic mechanisms
Cu-CeO2 has been considered as promising alternative to Cu-Zn-Al catalyst for water-gas shift (WGS) reaction, but it still suffers from low activity caused by Cu sintering. Here, the authors develop inverse CeO2/Cu catalyst with remarkable activity and stability in WGS via construction of stabilized bulk-nano interfaces.
Introduction
Bulk catalysts with stable structure have been applied to many industrial procedures, such as fused Fe for ammonia synthesis1 and Cu–Zn–Al for water–gas shift (WGS) reaction2. In recent years, the introduction of nanotechnology has brought valuable insights into heterogeneous catalysis. Remarkable catalytic performances in many reactions have been discovered for supported nanoparticles, clusters, and single atoms3–7, of which defects and vacancies on the oxide supports are often considered as important anchoring sites. One major shortcoming of these supported catalysts is the vulnerability against sintering8–10. The highly dispersed active sites tend to aggregate and deactivate under reaction conditions. Thus, combining the advantages of bulk and nano-sized catalysts is of great significance, though it seems tough, since the bulk structure contradicts the high dispersion.
WGS (CO + H2O = CO2 + H2) reaction is a crucial process in H2 production industry11, to which Cu-based catalysts have been applied for decades12–14. Cu–CeO2 has been considered as promising alternative to Cu–Zn–Al catalyst, while it still suffers from low activity caused by Cu sintering15–17. It has been known that the metal–oxide interface plays a critical role in catalyzing WGS reaction, of which the key is the adsorption and activation of reactants18–20. To deeply understand the interface effect, catalysts with inverse configuration have been designed21–23. Different to commonly supported catalysts, for which active metals are loaded onto the oxide supports, active metals serve as the support for oxides nanoparticles in inverse catalyst24–27. Model inverse CeOx/Cu(111) has shown superior WGS activity to normal Cu/CeO2(111), owing to enhanced reducibility of CeO228. Meanwhile, the CeO2–Cu interface could be highly stable, since bulk Cu has grown well and CeO2 nanoparticles are anti-sintering under WGS conditions, which is very beneficial to the catalyst stability. Thus, prominent activity and stability promotion of Cu–CeO2 catalyst is expected by applying inverse configuration. However, the assumed high WGS activity has never been found on real CeO2/Cu catalyst, due to severe separation of bulk Cu and CeO2 nanoparticles29. Therefore, strategies to fabricate inverse CeO2/Cu catalyst with sufficient bulk–nano interfaces are in great need.
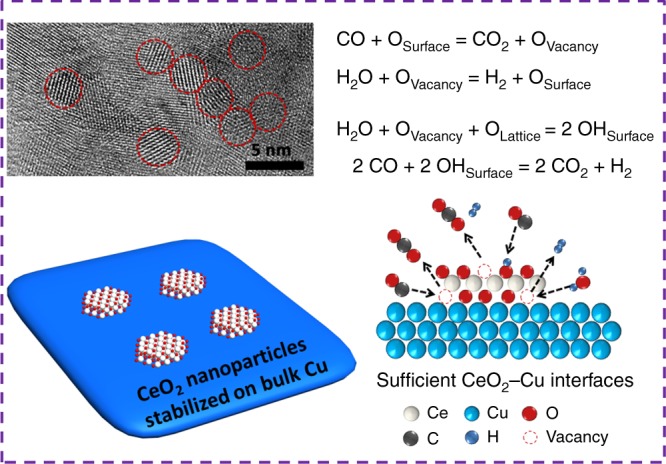
Herein, we have constructed stabilized bulk–nano interfaces to fabricate inverse CeO2/Cu catalyst, through which the advantages of bulk and nano-sized catalysts are perfectly combined. With an in situ structural transformation, CeO2 nanoparticles (2–3 nm) are dispersed on bulk Cu, forming sufficient CeO2–Cu interfaces with great stability. Enrichment of stable bulk–nano interfaces results in great promotion of WGS activity and stability. The inverse CeO2/Cu catalyst achieves a remarkable WGS reaction rate of 47.3 μmol g−1 s−1 (300 °C), which is at least five times of that for other Cu catalysts. Mechanistic study demonstrates the CeO2/Cu catalyst possesses superb capability of H2O dissociation and CO oxidation, which facilitates WGS reaction via the combination of associative and redox mechanism. Development of such inverse catalyst is very likely to make huge breakthrough in the exploration of other robust catalysts.
Results
Catalytic performances of the inverse CeO2/Cu catalyst
A series of catalysts with different Cu/Ce ratio was prepared via an aerosol-spray method30–32. As shown in Supplementary Fig. 1a and c, the inverse CeO2/Cu catalyst with Cu/Ce ratio of 9:1 showed the highest and repeatable WGS activity. Increased or decreased proportion of Cu led to lower CO conversion (Supplementary Fig. 1b). The physical and chemical properties of the catalysts are listed in Supplementary Table 1. Fresh CeO2/Cu catalyst contained 61.5 wt% of Cu, and the Cu content elevated to 82.9 wt% after WGS reaction, due to the reduction of CuO to Cu. The 17.1 wt% CeO2 loading corresponded well to the finding of Rodriguez et al.24, illustrating the optimal CeO2 coverage on Cu surface was around 20%. For supported Cu/CeO2 catalyst, 10 wt% of Cu has often been applied to obtain an effective catalyst33–35. Therefore, normal Cu/CeO2 catalyst, with 10.7 wt% of Cu, was chosen for comparison.
In Table 1, the two fresh catalysts exhibited similar specific BET surface areas (SBET, 46‒48 m2 g−1). After catalysis, the SBET of CeO2/Cu catalyst (16.2 m2 g−1) apparently decreased, while that of Cu/CeO2 catalyst (42.8 m2 g−1) was well preserved. Cu surface area (SCu) was also calculated for both catalysts (see Supplementary Methods for detail). The SCu of Cu/CeO2 (71.7 m2 g−1) was also higher than that of CeO2/Cu (50.7 m2 g−1). However, the inverse CeO2/Cu catalyst exhibited much higher WGS conversion than that of Cu/CeO2 catalyst (Fig. 1a). Within the tested temperature range, the reaction rate (r) of CeO2/Cu measured under kinetics conditions was 4–5 times higher than that of Cu/CeO2 catalyst. Under the industrial WGS atmosphere, as illustrated in Fig. 1b, the activity of inverse CeO2/Cu catalyst was very close to that of commercial Cu–Zn–Al, approaching the equilibrium in harsh reaction conditions. To further demonstrate the promotion of WGS activity, r values at 300 °C for different catalysts were illustrated in Fig. 1c. Normal Cu/CeO2 gave r of 10.2 μmol g−1 s−1, slightly higher than that of reported Cu–Ce(La)Ox (9.0 μmol g−1 s−1)15. The similar r values here reflected the general WGS activity of supported Cu/CeO2 catalysts. Meanwhile, the inverse CeO2/Cu gave a very high r value of 47.3 μmol g−1 s−1, which was five times that of normal Cu/CeO2 catalyst. Compared to former inverse CeOx/Cu catalyst (9.8 μmol g−1 s−1)29, the r of inverse CeO2/Cu was also much higher. The activities of some efficient WGS catalysts are listed in Supplementary Table 2. The inverse CeOx/Cu catalyst exhibited the highest r among the Cu-based catalysts, and its activity was even close to supported Pt catalysts36,37. Thus, we believe that the inverse CeO2/Cu catalyst with tremendous WGS activity has been successively developed. Arrhenius plots for the catalysts were constructed by using the ln of r (Supplementary Fig. 2). In the repeated experiments, the WGS on inverse CeO2/Cu gave an apparent energy (Ea) of ca. 37 kJ mol−1, which was a little lower than that (ca. 40 kJ mol−1) found on normal Cu/CeO2.
Table 1.
Physicochemical properties of fresh and used catalysts
| Catalyst | Cu (wt%)a | dCeO2 (nm)b | dCu (nm)b | SBET (m2 g–1) | SCu (m2 g–1) | TOF (s−1)c | Interface sitesc | ||||
|---|---|---|---|---|---|---|---|---|---|---|---|
| CeO2/Cu | 61.5d | 82.9e | 2.6d | 2.7e | 8.0d | 101.2e | 47.7d | 16.2e | 50.7 | 0.058 | 4.9 × 10²⁰ |
| Cu/CeO2 | 10.7 | 13.4 | 3.6 | 4.7 | − | − | 46.2 | 42.8 | 71.7 | 0.056 | 1.1 × 10²⁰ |
aWeight ratio of fresh catalysts determined by EDS
bCuO for fresh samples, Cu for used samples. Determined by the XRD patterns and Scherrer formula
cSee detailed calculation process in Supplementary Methods
dData acquired from fresh catalysts
eData acquired from used catalysts
Fig. 1.

Catalytic performances of the inverse CeO2/Cu catalyst. a Water–gas shift (WGS) activities of the inverse CeO2/Cu and normal Cu/CeO2 catalysts. b WGS activities of the inverse CeO2/Cu catalyst and commercial Cu–Zn–Al under industrial atmosphere. c Comparison of WGS reaction rates for different catalysts at 300 °C. d Time-on-stream tests of the inverse CeO2/Cu, normal Cu/CeO2 catalysts, and commercial Cu–Zn–Al
For WGS catalysts, sintering is often considered as the main reason for deactivation8–10,38. The well-dispersed active species may aggregate and deactivate rapidly under reaction conditions. Figure 1d present the results of time-on-stream stability tests. Normal Cu/CeO2 gave very low r (3 μmol g−1 s−1), while the inverse CeO2/Cu exhibited surprisingly high stability. With the temperature of 250 °C and very high space velocity of 600,000 cm3 g−1 h−1, the WGS r of the inverse CeO2/Cu maintained at 17 μmol g−1 s−1, showing negligible decrease in the test up to 50 h. The long-term stability of commercial Cu–Zn–Al was measured as well. The initial r of Cu–Zn–Al was slightly higher than that of inverse CeO2/Cu. After 50 h test, the r dropped from 19.5 to 14.8 μmol g−1 s−1. Thus, the CeO2/Cu catalyst gave very solid performance in the time-on-stream test, which showed superior stability under very high space velocity (600,000 cm3 g−1 h−1).
Construction of bulk–nano interfaces
The catalytic performances were largely determined by the structure of the catalysts. CeO2 has been well known as suitable support for Cu catalysts, since the strong interaction between CuO and CeO2 could achieve homogeneous Cu dispersion39–41. For the fresh CeO2/Cu catalyst, such interaction could be confirmed by temperature-programmed reduction by H2 (H2-TPR), with the fact that reducibility for CuO was enhanced after CeO2 addition (Supplementary Fig. 3). Moreover, the strong CuO–CeO2 interaction was convinced by the X-ray photoelectron spectroscopy (XPS) (Supplementary Fig. 4a) and ultraviolet–visible spectroscopy (UV–vis) analysis (Supplementary Fig. 5a), showing peak shifting and broadening with increased CeO2 content. The strong CuO–CeO2 interaction enhanced the redox properties of the catalysts, and improved the dispersion of both Cu and CeO2. Raman spectra of the catalysts depicted in Supplementary Fig. 5b exhibited a tiny peak of Raman mode Ag42,43, which belonged to cupric oxide. Thus, it seemed difficult to tell whether CeO2 was doped into CuO lattice.
The structural and chemical information of inverse CeO2/Cu catalyst is given in Fig. 2. The transmission electron microscopy (TEM) image (Fig. 2a) of fresh inverse CeO2/Cu catalysts present morphology of microspheres with diameters ranging from 200 to 500 nm. These microspheres were stacked of CuO and CeO2 nanoparticles. After WGS reaction, the microspheres became condensed and formed bulk particles (Fig. 2b). Catalysts with other Cu–Ce ratios exhibited similar size and morphology (Supplementary Fig. 6). Powder X-ray diffraction (XRD) results (Supplementary Fig. 7) showed that monoclinic CuO and fluorite CeO2 served as dominate phase for the fresh catalyst. In Fig. 2c, the XRD pattern of Cu/CeO2 had no observable change after WGS test, indicating the Cu-species remained well-dispersed. This observation correlated well with the stable nature of Cu/CeO2 (Fig. 1d). For inverse CeO2/Cu catalyst, sharp metallic Cu peaks emerged after WGS test, and the crystalline size of Cu reached 101.2 nm (Table 1). The XRD results were consistent with the trend of dispersity for Cu (Supplementary Table 1), though CeO2 has been found to participate in N2O chemisorption, causing higher measured dispersion44. The XRD data demonstrated that the CeO2/Cu catalyst underwent severe sintering and bulk Cu was formed during WGS reaction. However, even though formation of bulk Cu was observed, the WGS activity and long-term stability of inverse CeO2/Cu were surprisingly excellent (Fig. 1). This finding was contrary to former knowledge that WGS was favored with smaller Cu-species38,45. The unusual phenomenon could be well explained by the fact that WGS reaction occurred at CeO2–Cu interfaces of inverse CeO2/Cu. As the bulk Cu was present, sufficient interfaces could be created if CeO2 was well dispersed. Small CeO2 nanoparticles supported on CuO were confirmed by high-resolution TEM (HR-TEM) images in Fig. 2e and Supplementary Fig. 8. After WGS reaction, small-sized CeO2 (2–3 nm) was still well-dispersed on bulk Cu (Fig. 2f and Supplementary Fig. 8). The element mapping results (Fig. 2g) further demonstrated the high dispersion of CeO2, with Ce signal appearing uniformly on the surface of used CeO2/Cu catalyst. XPS profiles of Ce 3d were recorded in Fig. 2d. For both inverse and normal catalysts, Ce4+ present as the dominating chemical state before and after WGS reaction. The other prepared Cu–CeO2 catalysts also exhibited only Ce4+ (Supplementary Fig. 4b). Combining with the fact that no shift for the CeO2 XRD peaks were observed (Fig. 2c), we believed that the CeO2 nanoparticles were supported on CuO, rather than incorporated into the CuO lattice. Therefore, enriched CeO2–Cu interfaces were present in the inverse CeO2/Cu catalyst.
Fig. 2.

Structure evolution of inverse CeO2/Cu catalyst during WGS reaction. a, b Transmission electron microscope (TEM) images of a fresh and b used inverse CeO2/Cu catalysts. c X-ray diffraction (XRD) patterns of the fresh and used catalysts. d Ce 3d X-ray photoelectron spectroscopy (XPS) results of the fresh and used catalysts. e, f High-resolution TEM (HR-TEM) images of fresh e and used f inverse CeO2/Cu catalyst, red circles reflect to CeO2, blue circles reflect to CuO. g Scanning transmission electron microscope (STEM) image and element mapping results of used inverse CeO2/Cu catalyst, the inset bar: 200 nm. h Scheme of structural evolution for inverse CeO2/Cu catalyst during WGS reaction, CeO2 nanoparticles are well stabilized despite Cu sintering
The structural evolution of the inverse catalyst is depicted in Fig. 2h. With the strong interaction, CeO2 nanoparticles were well dispersed in CuO matrix of the fresh sample. After H2 reduction, CuO was reduced and sintered to form bulk Cu. Meanwhile, the CeO2 nanoparticles showed outstanding stability, holding high dispersion under WGS conditions. The aerosol-spray method enabled the inverse CeO2/Cu catalyst to give homogeneous Cu–CeO2 dispersion, which induced an in situ structural transformation, resulting in CeO2 nanoparticles (2–3 nm) stabilized on bulk Cu. The construction of bulk–nano interfaces brought stable structure of bulk materials and high dispersion of nano-sized catalysts. Tremendous promotion in WGS activity was thus achieved via creation of such bulk–nano interfaces, which was no longer at the risk of sintering deactivation.
Simulation of sintering via in situ XRD
In order to better simulate the sintering phenomenon during catalysis, in situ XRD measurements under 5% H2/Ar were performed towards the inverse and normal catalysts. As shown in Fig. 3a, the peaks for metallic Cu of inverse CeO2/Cu catalyst emerged at 150 °C and sharpened, indicating rapid sintering of Cu. Amplified Cu region in Fig. 3d illustrates that bulk Cu formed below 200 °C. For normal Cu/CeO2 catalyst (Fig. 3b), no obvious Cu peaks could be observed. Amplified Cu region in Fig. 3e displayed a tiny Cu peak centered at 43°. The Cu peak was absent for used Cu/CeO2 catalyst (Fig. 2c), which might due to the re-oxidation and dispersion of Cu under ex situ mode. Besides, the structural evolutions of CeO2 under reduction are given in Fig. 3c, e. The broad peaks suggested that CeO2 nanoparticles in inverse CeO2/Cu were maintained at very small size (2.1–2.9 nm, Supplementary Fig. 9), which was in accordance to the XRD data of used inverse catalyst (2.6–2.7 nm, Table 1). Figure 3e shows that the CeO2 size of normal Cu/CeO2 grew under H2 reduction (2.8–5.3 nm, Supplementary Fig. 9). Thus, compared to depositing Cu nanoparticles on CeO2 support, the dispersion of CeO2 on bulk Cu created more stable CeO2–Cu interfaces. This enrichment of stable interfaces for inverse CeO2/Cu catalyst resulted in tremendous promotion of WGS activity, corresponding well to former report, in which Cu–CeO2 interface was suggested to have great importance in WGS model catalyst18.
Fig. 3.

Simulation of sintering via in situ XRD. a In situ XRD patterns under 5% H2–Ar for inverse CeO2/Cu catalyst. b In situ XRD patterns under 5% H2–Ar for normal Cu/CeO2 catalyst. c Amplified CeO2 region of in situ XRD patterns for inverse CeO2/Cu catalyst. d Amplified Cu region of in situ XRD patterns for inverse CeO2/Cu catalyst. e Amplified CeO2 region of in situ XRD patterns for normal Cu/CeO2 catalyst. f Amplified Cu region of in situ XRD patterns for normal Cu/CeO2 catalyst
WGS mechanism study
For WGS reaction, two catalytic mechanisms have been proposed, namely, redox mechanism and associative mechanism46–48. In the redox mechanism, CO reacts with surface oxygen of supports after adsorption, forming CO2 and oxygen vacancy. H2O dissociates at the vacancy and produces H2. In the associative mechanism, CO and H2O adsorb on the catalyst to form an intermediate, which decomposes to yield CO2 and H2. It has been proved that with associative mechanism, surface hydroxyl serves as the active species in Au/CeO2 system49,50. In this case, two CO molecules react with two surface hydroxyl groups to form 2 CO2 molecules and 1 H2 molecule:
The amount of produced CO2 is supposed to be double of that of H2 in the outlet gas. Temperature-programmed surface reaction (TPSR) were carried out to check the reaction pathway. As shown in Fig. 4b, CO purging gave the ratio of generated CO2 and H2 as 2:1, corresponding very well to the above reaction. After H2O was introduced, no H2 signal was detected on Cu/CeO2, proving the pure associative mechanism for the normal Cu/CeO2 catalyst. However, for the inverse CeO2/Cu catalyst (Fig. 4a), the ratio of generated CO2 and H2 was 3:1 after CO introduction. This meant that besides the surface hydroxyls, active oxygen atoms created by the dissociation of H2O were also involved in the reaction. When H2O was injected, H2 formation could be observed immediately. These observations matched the features of redox mechanism, assuming that H2O dissociated on CeO2 oxygen vacancy to generate H2 and active surface oxygen atoms. After H2O injection, we removed the surface oxygen with H2 reduction and preserved the surface hydroxyls50, after which CO was purged into the system to conduct the TPSR test again. The subsequent CO treatment gave a CO2:H2 ratio of 2:1, showing the typical results of associative mechanism. The TPSR experiment was cycled three times in a row, and it gave very repeatable results for both catalysts. Thus, it turned out that both the redox and associative mechanism were present in the WGS reaction catalyzed by the inverse CeO2/Cu catalyst.
Fig. 4.

WGS mechanism study of the inverse CeO2/Cu catalyst. a Temperature-programmed surface reaction (TPSR) on the inverse CeO2/Cu with consecutive switch of CO, H2O, and H2 at 200 °C. b TPSR on normal Cu/CeO2 with consecutive switch of CO, H2O, and H2 at 200 °C. c Temperature-programmed desorption of CO (CO-TPD) and d in situ diffused reflectance infrared Fourier transform spectroscopy (DRIFTS) results of the inverse CeO2/Cu under the WGS conditions (2%CO/2%H2O/Ar, at 200 °C)
It has been generally believed that the redox mechanism occurs on metals46,47 and the associative mechanism dominates at the metal/oxide interface50,51. However, redox pathway has now been found on inverse CeO2/Cu catalyst. The improved redox properties of CeO2 nanoparticles on inverse CeO2/Cu played an important role. Temperature-programmed desorption of CO (CO-TPD) was applied to detect the CO sorption on the inverse catalyst. As illustrated in Fig. 4c, after CO pre-adsorption, CO2 was the only desorption species on CeO2/Cu, showing easy transformation from CO to CO2. For better study over CO adsorption, diffuse reflectance infrared Fourier transform spectroscopy (DRIFTS) was introduced. As shown in Fig. 4d, the in situ DRIFTS of the inverse CeO2/Cu catalyst under WGS conditions exhibited CO2 signal52 (2334, 2364 cm−1) at the beginning, which indicated the ongoing of WGS reaction. Meanwhile, no signal of CO was detected during the measurement, while normal Cu/CeO2 gave CO–Cu0 adsorption (2094 cm−1)53,54 (Supplementary Fig. 10b). Pure Cu showed no adsorption behavior under both WGS and CO modes, suggesting CO adsorption on bulk Cu was not favored (Supplementary Fig. 10c and d). Besides, the results of in situ DRIFTS for CO adsorption on the CeO2/Cu also only present CO2 signal, which showed that active surface species of the catalyst was reduced by CO (Supplementary Fig. 10a). Besides, we measured the reaction orders of CO and H2O for different catalysts. As shown in Supplementary Fig. 11, the H2O reaction order increased when CeO2 content was elevated, giving the catalyst stronger capability to consume H2O. The CO reaction order on inverse CeO2/Cu was 0.75, which suggested CO was comparatively insufficient during WGS reaction. All the above data demonstrated the easy transformation from CO to CO2 on inverse CeO2/Cu, reflecting unique redox properties of the CeO2 nanoparticles. The surface oxygen of inverse CeO2/Cu was proved to be flexible under CO, which facilitated the formation of defect sites.
Role of the surface defects in the catalysts
The formation of defect sites on inverse CeO2/Cu were evidenced by in situ Raman measurements, since ex situ Raman and XPS results did not show pronounced Ce3+ signals. As shown in Fig. 5a, the Raman spectra of the inverse CeO2/Cu after H2 activation gave a hump at 600 cm−1, which was ascribed to the intrinsic defects55,56. When CO was filled in, surface oxygen was removed, forming two characteristic peaks located at 546 and 456 cm−1, respectively. The peak centered at 546 cm−1 (D peak) resulted from defects where Ce4+ was replaced by Ce3+ 56, and the peak centered at 456 cm−1 was typical vibration mode (F2g) of fluorite-type structure56,57. It is surprising that the Raman signals of the inverse CeO2/Cu showed that the defect D peak was even more pronounced than F2g peak. When H2O was introduced, the intensity of the D peaks decreased apparently, which meant the Ce3+ defects were filled. The second cycle gave the same results. The introduction of CO induced the creation of surface defects through the reaction:
Fig. 5.

Examination of defect sites in the catalysts. a In situ Raman spectra of the inverse CeO2/Cu with CO/H2O switch under 200 °C. b In situ Raman spectra of the normal Cu/CeO2 with CO/H2O switch under 200 °C. c In situ Raman under the WGS conditions for both catalysts, the inset figure gave D/F2g integral ratio at different temperatures
For the normal Cu/CeO2 catalyst (Fig. 5b), the intensity of Ce3+ D peaks was clearly weakened. The generation and elimination of defects with the CO/H2O switch was also sluggish. In situ Raman under WGS conditions (Fig. 5c) showed consistent results. The inverse CeO2/Cu also gave more pronounced signal of surface defects under the WGS conditions, with D/F2g integral ratio of 1.8. These results were totally different from those of pure CeO2 sample (Supplementary Fig. 12), which gave very strong F2g peak and nearly no defect peak. The in situ Raman results have confirmed the enrichment of Ce3+ defect sites in inverse CeO2/Cu under WGS conditions, which further proved the enhanced redox properties of CeO2 on inverse CeO2/Cu.
For both catalysts, metallic Cu was the only phase detected under the WGS conditions. Supplementary Fig. 13 displayed the TPSR results of inverse CeO2/Cu and normal Cu/CeO2 catalysts. The WGS reaction began to occur at ~100 °C. After TPSR, the following H2-TPR measurement gave no H2 reduction peaks, which suggested Cu remained in fully metallic state during the WGS reaction. This finding was in accordance with the former work reported by Barrio et al.29 However, considering the very high WGS activity of the inverse CeO2/Cu catalyst, the active site was more likely to locate at Cu–CeO2 interfaces rather than metallic Cu.
Discussion
The mixed oxides of Cu–Zn–Al have been applied as industrial WGS catalysts for decades. Though lots of efforts have been made, few reports have found Cu-based catalysts as effective as Cu–Zn–Al, especially under industrial atmosphere. Herein, the inverse CeO2/Cu catalyst showed greatly promoted WGS activity, which was five times higher than that of normal Cu/CeO2 catalyst. The WGS conversion of the inverse CeO2/Cu was very close to that of commercial Cu–Zn–Al under industrial WGS atmosphere, approaching the equilibrium maximum. The high WGS activity for the inverse CeO2/Cu catalyst originated from its unique structure, where bulk–nano interfaces were constructed. When Cu was loaded on CeO2, sintering was inevitable as the aggregation of Cu species lowered the surface energy. The dynamic elimination of Cu–CeO2 interfaces caused rapid deactivation. Thus, for normal Cu/CeO2 catalyst, though Cu–CeO2 interfaces were created, the elimination due to structural change would take place even in H2 pre-treatment. This deactivation resulted in very low WGS r in activity and stability tests (Fig. 1a, d). Considering its high Cu dispersion, the turnover frequency (TOF) of normal Cu/CeO2 was calculated for single site on Cu–CeO2 interface (see detail in Supplementary Methods). The derived TOF was 0.056 s−1, as shown in Table 1.
Meanwhile, for inverse CeO2/Cu catalyst, bulk Cu formed steady structure under WGS conditions. Small CeO2 nanoparticles were dispersed on bulk Cu and were also very stable against sintering. The maximized and stabilized bulk–nano interfaces in the inverse CeO2/Cu catalyst gave significant WGS promotion. The high WGS activity resulted from the structural nature of the inverse CeO2/Cu catalyst, which lied in creation and preservation of stabilized bulk–nano interfaces. A theoretical model has been built to calculate TOF for the inverse CeO2/Cu. A 3 nm CeO2 nanoparticle with 231 Ce atoms was loaded on metallic Cu. As shown in Supplementary Fig. 14, 16 Ce atoms were located at the periphery of Cu–CeO2 interface. Based on this model, the TOF of the inverse CeO2/Cu catalyst for single site on CeO2–Cu interface was 0.058 s−1 (see detail in Supplementary Methods). The similar TOF of both catalysts proved that the Cu–CeO2 and CeO2–Cu interfaces possessed the same intrinsic activities. As shown in Table 1, the amount of interface sites for inverse CeO2/Cu was four times higher than that for normal Cu/CeO2. The highly promoted WGS activity of inverse CeO2/Cu originated from the enrichment of interface sites. Besides, owing to the strong Cu–CeO2 interaction, the redox properties of inverse CeO2/Cu catalyst were improved. The surface oxygen of inverse CeO2/Cu catalyst was proved to be flexible under CO, leading to the formation of defects. H2O dissociated at the defects, promoting the WGS activity via a combination of both the associative mechanism and redox mechanism. The discussion of reactivity and mechanism was concluded in Fig. 6.
Fig. 6.
Role of inverse CeO2/Cu in catalyzing the WGS reaction. Role of the CeO2–Cu interfaces in catalyzing the WGS reaction on inverse CeO2/Cu catalyst
The pursuing of highly active and stable catalysts would never be out of date. A strategy to fabricate robust WGS catalyst was proposed, where the key was the construction of bulk–nano interfaces. By using aerosol-spray method, we developed the CeO2/Cu catalysts with inverse configuration. Small CeO2 nanoparticles (2–3 nm) were stabilized on bulk Cu, forming stable CeO2–Cu interfaces under reaction conditions. The enrichment and preservation of such interfaces resulted in significant promotion in activity. The inverse CeO2/Cu catalyst exhibited great WGS activity, which was at least five times higher than other reported Cu catalysts. The improved redox properties of the inverse CeO2/Cu catalyst facilitated the H2O dissociation and CO oxidation, boosting WGS activity via the combination of associative and redox mechanism. Catalyst with sufficient bulk–nano interfaces has now been proved to give excellent WGS performances under realistic conditions, and show great potentials in practical applications and other catalytic systems.
Methods
Catalyst preparation
In a typical synthesis of CuaCebOx, 4 mmol of metal nitrates (99%, Tianjin Kermal Factory) were added to 60 ml of absolute ethanol (99%, Tianjin Fuyu Fine Chemical Reagent Factory). This mixture was stirred for 10 min and then put into a ultrasonic humidifier (30 W, 1.5 MHz). Industrial N2 served as the carrier gas to bring the spray generated through sonication into the tube furnace (pre-heated to 400 °C). The mist drop evaporated and the precursor underwent decomposition and self-assembly. The metal oxides products were spherical nanoparticles, which were collected on a piece of filter paper and dried overnight at 60 °C. Then, the obtained powder was calcined in air for 4 h (1 °C min−1 of ramping rate). The obtained catalysts were nominated as CuaCebOx, of which a and b referred to the molar ratio of corresponding element, respectively. Commercial Cu–Zn–Al catalyst (37 wt% CuO, 52 wt% ZnO, 11 wt% Al2O3, determined by EDS) was bought from Sichuan Shutai Chemical Engineering Company.
Transmission electron microscope (TEM)
All images of TEM were taken on a JEOL JEM-2100F microscope, of which the acceleration voltage was 200 kV. The images of HR-TEM were obtained by using a Philips Tecnai F20 instrument with the acceleration voltage of 200 kV. The element mapping results and EDS analysis were acquired from the same machine under STEM mode.
X-ray diffraction (XRD)
For the XRD data, all experiments were performed on a PANalytical B.V. X’pert3 powder diffractometer with CuKα radiation (λ = 0.15418 nm). Accelerating voltage and current of 40 kV and 40 mA were applied for ex situ and in situ modes. Ex situ XRD patterns were obtained by using a PIXcellD detector in the 2θ range of 20‒80°. For the in situ XRD experiments, an Anton Paar XRK900 in situ chamber was applied. The XRD data were measured from 50 to 400 °C in 5% H2/Ar mixture (30 cm3 min−1).
X-ray photoelectron spectroscopy (XPS)
The XPS measurements were performed on an Axis Ultra XPS spectrometer from Kratos, Japan. The operation was under 225 W of accelerating voltage and Al Kα radiation. The C 1s line located at 284.8 eV was used to calibrate each spectra for accurate binding energies.
Raman spectroscopy
Ex situ and in situ Raman spectra were obtained by excitation of the catalysts at 633 nm laser, using a LabRAM HR800 Raman spectrometer (Horiba Jobin Yvon) with the range from 200 to 800 cm−1 in a spectral resolution of 2 cm−1.
Temperature-programmed surface reaction (TPSR)
An online mass spectrometer (Ametek LC-D200M) was used to analyze the outlet gases for TPSR, as well as CO-TPD. 100 mg of each sample were treated with 5% H2/Ar (30 cm3 min−1) for 30 min at 300 °C before test. The sample was then flushed under pure He for 1 h. For CO-TPD, the samples were purged with 5% CO/Ar (30 cm3 min−1) for 0.5 h, and then flushed under pure He for another 1 h at room temperature. Afterwards, the samples were heated from room temperature to 500 °C under He flow. For TPSR, the catalysts were heated from 120 to 400 °C under 2%H2O, 2% CO/Ar gas flow (30 cm3 min−1). For the examination of reaction mechanisms, the samples went through WGS reaction for 1 h at 200 °C after H2 reduction. The catalysts were then purged by Ar at 200 °C, followed by the switch of 2%CO/Ar, pure Ar, 2%H2O/Ar, pure Ar, 5%H2/Ar, pure Ar, and 2%CO/Ar to collect the mass spectrometer signal. The heating rate for all tests was set as 10 °C min−1.
Catalytic tests and kinetics measurement
A fixed-bed reactor with diameter of 1 cm was used for the WGS reaction tests. In order to give accurate results, a thermocouple connected with a PID temperature controller was mounted on top of the catalyst bed. The catalyst powder (100 mg) was loaded and reduced with 5% H2/Ar mixture for 0.5 h at 300 °C. The reaction gas contained 2% CO and 10% H2O, balanced with N2. The total gas hourly space velocity (GHSV) was 42,000 cm3 g−1 h−1. In order to prevent water condensation, all pipes of the reactor were binded with heating belts. The activity results of catalysts were measured from 150 to 400 °C as 50 °C per step. Each catalyst was tested repeatedly to rule out the uncertainty. A Gasboard 3500 IR spectroscopy (WuhanSifang Company, China) was used to analyze all the outlet gases online. For the stability tests, the CO conversion data of the catalysts were continuously recorded under 250 °C for 50 h. The mass of the catalysts and the flow rate of reaction gas were tuned to keep the CO conversion under 15%. The WGS activity was measured by means of CO conversion, which was defined as the following formula:
| 1 |
For the kinetic tests, 20 mg of catalysts were pre-reduced with 5% H2/Ar mixture. The apparent activation energy (Ea) of each catalyst for WGS reaction was obtained by keeping 10% equal CO conversion with the regulation of reaction temperature, catalysts mass, and stream flow rate. The calculation of reaction rate (r) for WGS followed the equation:
| 2 |
where F is the total flow rate of the reaction stream (mol s−1). r is the WGS reaction rate by means of CO (mol g−1 s−1). COconverted is the concentration of converted CO on the IR spectroscopy and W is the mass of the catalyst (g).
The reaction orders of CO and H2O for the catalysts were measured under 250 °C. The WGS activity was recorded while the concentration of CO or H2O in the reaction gas was varied on purpose.
Supplementary information
Acknowledgements
This work is financially supported from the Excellent Young Scientists Fund from National Science Foundation of China (NSFC, grant nos. 21622106), other projects from the NSFC (grant nos. 21501109, 21771117, and 21805167), the Taishan Scholar Project of Shandong Province of China, the Outstanding Young Scholar Fund (grant no. JQ201703), and the Doctoral Fund (grant no. ZR2018BB010) from Science Foundation of Shandong Province of China and the Foundation of State Key Laboratory of Coal Conversion (grant no. J17-18-902). We thank the Center of Structural Characterizations and Property Measurements at Shandong University for the help on sample characterizations.
Author contributions
C.-J.J. supervised the work; H.Y., Z.J. and C.-J.J. had the idea for and designed the experiments, analyzed the results, and wrote the manuscript; H.Y., C.Y. and W.-P.S. performed the catalyst preparation and catalytic tests; H.Y. and L.-H.C. performed the TPSR, TPD, and kinetic experiments; H.Y. and W.-W.W. performed the ex situ and in situ XRD, Raman, and DRIFTS measurements.
Data availability
The main data supporting the findings of this study are available within the article and its Supplementary information. Extra data are available from the corresponding author upon request.
Competing interests
The authors declare no competing interests.
Footnotes
Peer review information: Nature Communications thanks the anonymous reviewers for their contribution to the peer review of this work. Peer reviewer reports are available.
Publisher’s note: Springer Nature remains neutral with regard to jurisdictional claims in published maps and institutional affiliations.
Supplementary information
Supplementary Information accompanies this paper at 10.1038/s41467-019-11407-2.
References
- 1.Kowalczyk Z, et al. Effect of potassium on the kinetics of ammonia synthesis and decomposition over fused iron catalyst at atmospheric pressure. J. Catal. 1997;169:407–414. doi: 10.1006/jcat.1997.1664. [DOI] [Google Scholar]
- 2.Koryabkina NA, et al. Determination of kinetic parameters for the water–gas-shift reaction on copper catalysts under realistic conditions for fuel cell applications. J. Catal. 2003;217:233–239. [Google Scholar]
- 3.Qiao B, et al. Single-atom catalysis of CO oxidation using Pt1/FeOx. Nat. Chem. 2011;3:634–641. doi: 10.1038/nchem.1095. [DOI] [PubMed] [Google Scholar]
- 4.Yang M, et al. Catalytically active Au–O(OH)x-species stabilized by alkali ions on zeolites and mesoporous oxides. Science. 2014;346:1498–1501. doi: 10.1126/science.1260526. [DOI] [PubMed] [Google Scholar]
- 5.Guo LW, et al. Contributions of distinct gold species to catalytic reactivity for carbon monoxide oxidation. Nat. Commun. 2016;7:13481. doi: 10.1038/ncomms13481. [DOI] [PMC free article] [PubMed] [Google Scholar]
- 6.Yao S, et al. Atomic-layered Au clusters on α-MoC as catalysts for the low-temperature water–gas shift reaction. Science. 2017;357:389–393. doi: 10.1126/science.aah4321. [DOI] [PubMed] [Google Scholar]
- 7.Liu L, Corma A. Metal catalysts for heterogeneous catalysis: from single atoms to nanoclusters and nanoparticles. Chem. Rev. 2018;118:4981–5079. doi: 10.1021/acs.chemrev.7b00776. [DOI] [PMC free article] [PubMed] [Google Scholar]
- 8.Campbell CT, et al. The effect of size-dependent nanoparticle energetics on catalyst sintering. Science. 2002;298:811–814. doi: 10.1126/science.1075094. [DOI] [PubMed] [Google Scholar]
- 9.Carter JH, et al. Activation and deactivation of gold/ceria-zirconia in the low-temperature water–gas-shift reaction. Angew. Chem. Int. Ed. 2017;56:16037–16041. doi: 10.1002/anie.201709708. [DOI] [PubMed] [Google Scholar]
- 10.Dai Y, Lu P, Cao Z, Campbell CT, Xia Y. The physical chemistry and materials science behind sinter-resistant catalysts. Chem. Soc. Rev. 2018;47:4314–4331. doi: 10.1039/C7CS00650K. [DOI] [PubMed] [Google Scholar]
- 11.Ratnasamy T, et al. Water gas shift catalysis. Catal. Rev. Sci. Eng. 2009;51:325–440. doi: 10.1080/01614940903048661. [DOI] [Google Scholar]
- 12.Gawande MB, et al. Cu and Cu-based nanoparticles: synthesis and applications in catalysis. Chem. Rev. 2016;116:3722–3811. doi: 10.1021/acs.chemrev.5b00482. [DOI] [PubMed] [Google Scholar]
- 13.Campbell CT, Daube KA. A surface science investigation of the water–gas-shift reaction on Cu (111) J. Catal. 1987;104:109–119. doi: 10.1016/0021-9517(87)90341-1. [DOI] [Google Scholar]
- 14.Nakamura J, Campbell JM, Campbell CT. Kinetics and mechanism of the water-gas shift reaction catalysed by the clean and Cs-promoted Cu (110) surface: a comparison with Cu (111) J. Chem. Soc. Faraday Trans. 1990;86:2725–2734. doi: 10.1039/ft9908602725. [DOI] [Google Scholar]
- 15.Li Y, Fu Q, Flytzani-Stephanopoulos M. Low-temperature water-gas shift reaction over Cu- and Ni-loaded cerium oxide catalysts. Appl. Catal. B. 2000;27:179–191. doi: 10.1016/S0926-3373(00)00147-8. [DOI] [Google Scholar]
- 16.Qi X, Flytzani-Stephanopoulos M. Activity and stability of Cu–CeO2 catalysts in high-temperature water–gas shift for fuel-cell applications. Ind. Eng. Chem. Res. 2004;43:3055–3062. doi: 10.1021/ie0306170. [DOI] [Google Scholar]
- 17.Zerva C, Philippopoulos CJ. Ceria catalysts for water gas shift reaction: influence of preparation method on their activity. Appl. Catal. B. 2006;67:105–112. doi: 10.1016/j.apcatb.2006.04.013. [DOI] [Google Scholar]
- 18.Mudiyanselage K, et al. Importance of the metal–oxide interface in catalysis: in situ studies of the water–gas shift reaction by ambient-pressure x-ray photoelectron spectroscopy. Angew. Chem. Int. Ed. 2013;52:5101–5105. doi: 10.1002/anie.201210077. [DOI] [PubMed] [Google Scholar]
- 19.Aranifard S, Ammal SC, Heyden A. On the importance of metal–oxide interface sites for the water–gas shift reaction over Pt/CeO2 catalysts. J. Catal. 2014;309:314–324. doi: 10.1016/j.jcat.2013.10.012. [DOI] [Google Scholar]
- 20.Xu M, et al. Insights into interfacial synergistic catalysis over Ni@TiO2-x catalyst toward water-gas shift reaction. J. Am. Chem. Soc. 2018;140:11241–11251. doi: 10.1021/jacs.8b03117. [DOI] [PubMed] [Google Scholar]
- 21.Rodriguez JA, Hrbek J. Inverse oxide/metal catalysts: a versatile approach for activity tests and mechanistic studies. Surf. Sci. 2010;604:241–244. doi: 10.1016/j.susc.2009.11.038. [DOI] [Google Scholar]
- 22.Senanayake SD, et al. Unique properties of ceria nanoparticles supported on metals: novel inverse ceria/copper catalysts for CO oxidation and the water-gas shift reaction. Acc. Chem. Res. 2013;46:1702–1711. doi: 10.1021/ar300231p. [DOI] [PubMed] [Google Scholar]
- 23.Rodriguez JA, et al. Inverse oxide/metal catalysts in fundamental studies and practical applications: a perspective of recent developments. J. Phys. Chem. Lett. 2016;7:2627–2639. doi: 10.1021/acs.jpclett.6b00499. [DOI] [PubMed] [Google Scholar]
- 24.Rodriguez JA, Ma S, Liu P, Hrbek J, Evans J, Pérez M. Activity of CeOx and TiOx nanoparticles grown on Au(111) in the water–gas shift reaction. Science. 2007;318:1757–1760. doi: 10.1126/science.1150038. [DOI] [PubMed] [Google Scholar]
- 25.Shi J, et al. Nanoporous gold-supported ceria for the water–gas shift reaction: UHV inspired design for applied catalysis. Catal. J. Phy. Chem. C. 2014;118:29270–29277. doi: 10.1021/jp505433a. [DOI] [Google Scholar]
- 26.Shi J, et al. A versatile sol–gel coating for mixed oxides on nanoporous gold and their application in the water gas shift reaction. Catal. Sci. Technol. 2016;6:5311–5319. doi: 10.1039/C5CY02205C. [DOI] [Google Scholar]
- 27.Shi J, et al. Steam reforming of methanol over oxide decorated nanoporous gold catalysts: a combined in situ FTIR and flow reactor study. Phys. Chem. Chem. Phys. 2017;19:8880–8888. doi: 10.1039/C6CP08849J. [DOI] [PubMed] [Google Scholar]
- 28.Rodriguez JA, et al. Water-gas shift reaction on a highly active inverse CeOx/Cu (111) catalyst: unique role of ceria nanoparticles. Angew. Chem. Int. Ed. 2009;121:8191–8194. doi: 10.1002/ange.200903918. [DOI] [PubMed] [Google Scholar]
- 29.Barrio L, et al. Unraveling the active site in copper-ceria system for the water-gas shift reaction: in situ characterization of an inverse powder CeO2-x/CuO–Cu catalyst. J. Phy. Chem. C. 2010;114:3580–3587. doi: 10.1021/jp910342b. [DOI] [Google Scholar]
- 30.Lu. Y, et al. Aerosol-assisted self-assembly of mesostructured spherical nanoparticles. Nature. 1999;398:223–226. doi: 10.1038/18410. [DOI] [Google Scholar]
- 31.Jin Z, Xiao M, Bao Z, Wang P, Wang J. A general approach to mesoporous metal oxide microspheres loaded with noble metal nanoparticles. Angew. Chem. Int. Ed. 2012;51:6406–6410. doi: 10.1002/anie.201106948. [DOI] [PubMed] [Google Scholar]
- 32.Yan H, et al. Promoted multimetal oxide catalysts for the generation of hydrogen via ammonia decomposition. J. Phy. Chem. C. 2016;120:7685–7696. doi: 10.1021/acs.jpcc.6b01595. [DOI] [Google Scholar]
- 33.Gawade P, Mirkelamoglu B, Ozkan US. The role of support morphology and impregnation medium on the water gas shift activity of ceria-supported copper catalysts. J. Phy. Chem. C. 2010;114:18173–18181. doi: 10.1021/jp104715w. [DOI] [Google Scholar]
- 34.Si R, Zhang L, Chan SW, Flytzani-Stephanopoulos M. Structure sensitivity of the low-temperature water–gas shift reaction on Cu–CeO2 catalysts. Catal. Today. 2012;180:68–80. doi: 10.1016/j.cattod.2011.09.008. [DOI] [Google Scholar]
- 35.Saw ET, et al. Bimetallic Ni–Cu catalyst support on CeO2 for high-temperature water–gas shift reaction: methane suppression via enhanced CO adsorption. J. Catal. 2014;314:32–46. doi: 10.1016/j.jcat.2014.03.015. [DOI] [Google Scholar]
- 36.Miao D, Goldbach A, Xu H. Platinum/apatite water-gas shift catalysts. ACS Catal. 2016;6:775–783. doi: 10.1021/acscatal.5b01909. [DOI] [Google Scholar]
- 37.Fu Q, Saltsburg H, Flytzani-Stephanopoulos M. Active nonmetallic Au and Pt species on ceria-based water–gas shift catalysts. Science. 2003;301:935–938. doi: 10.1126/science.1085721. [DOI] [PubMed] [Google Scholar]
- 38.Yan H, Qin XT, Yin Y, Teng YF, Jin Z, Jia CJ. Promoted Cu–Fe3O4 catalysts for low-temperature water gas shift reaction: optimization of Cu content. Appl. Catal. B. 2018;226:182–193. doi: 10.1016/j.apcatb.2017.12.050. [DOI] [Google Scholar]
- 39.Yang F, et al. CeO2↔CuOx interactions and the controlled assembly of CeO2 (111) and CeO2 (100) nanoparticles on an oxidized Cu (111) substrate. J. Phys. Chem. C. 2011;115:23062–23066. doi: 10.1021/jp2082837. [DOI] [Google Scholar]
- 40.Konsolakis M. The role of copper–ceria interactions in catalysis science: recent theoretical and experimental advances. Appl. Catal. B. 2016;198:49–66. doi: 10.1016/j.apcatb.2016.05.037. [DOI] [Google Scholar]
- 41.Wang X, et al. Sacrificial adsorbate strategy achieved strong metal-support interaction of stable Cu nanocatalysts. ACS Appl. Energy Mater. 2018;1:1408–1414. doi: 10.1021/acsaem.8b00049. [DOI] [Google Scholar]
- 42.Fu J, Ji W, Shen Z, Tang S. Preparation and characterization of CuO nanocrystals. J. Solid State Chem. 1999;147:516–519. doi: 10.1006/jssc.1999.8409. [DOI] [Google Scholar]
- 43.Reina TR, et al. The role of Au, Cu & CeO2 and their interactions for an enhanced WGS performance. Appl. Catal. B. 2016;187:98–107. doi: 10.1016/j.apcatb.2016.01.031. [DOI] [Google Scholar]
- 44.Wang W, et al. Crystal plane effect of ceria on supported copper oxide cluster catalyst for CO oxidation: importance of metal-support interaction. ACS Catal. 2017;7:1313–1329. doi: 10.1021/acscatal.6b03234. [DOI] [Google Scholar]
- 45.Yahiro H, et al. Study on the supported Cu-based catalysts for the low-temperature water–gas shift reaction. Catal. Today. 2007;126:436–440. doi: 10.1016/j.cattod.2007.06.020. [DOI] [Google Scholar]
- 46.Gokhale AA, Dumesic JA, Mavrikakis M. On the mechanism of low-temperature water gas shift reaction on copper. J. Am. Chem. Soc. 2008;130:1402–1414. doi: 10.1021/ja0768237. [DOI] [PubMed] [Google Scholar]
- 47.Lin CH, Chen CL, Wang JH. Mechanistic studies of water–gas-shift reaction on transition metals. J. Phy. Chem. C. 2011;115:18582–18588. doi: 10.1021/jp2034467. [DOI] [Google Scholar]
- 48.Kalamaras CM, Americanou S, Efstathiou AM. “Redox” vs. “associative formate with –OH group regeneration” WGS reaction mechanism on Pt/CeO2: effect of platinum particle size. J. Catal. 2011;279:287–300. doi: 10.1016/j.jcat.2011.01.024. [DOI] [Google Scholar]
- 49.Zhai Y, et al. Alkali-stabilized Pt-OHx species catalyze low-temperature water–gas shift reactions. Science. 2010;329:1633–1636. doi: 10.1126/science.1192449. [DOI] [PubMed] [Google Scholar]
- 50.Fu X, et al. Direct identification of active surface species for the water–gas shift reaction on a gold−ceria catalyst. J. Am. Chem. Soc. 2019;141:4613–4623. doi: 10.1021/jacs.8b09306. [DOI] [PubMed] [Google Scholar]
- 51.Aranifard S, Ammal SC, Heyden A. On the importance of metal–oxide interface sites for the water–gas shift reaction over Pt/CeO2 catalysts. J. Catal. 2014;309:314–324. doi: 10.1016/j.jcat.2013.10.012. [DOI] [Google Scholar]
- 52.Chen CS, et al. Active sites on Cu–SiO2 prepared using the atomic layer technique for a low-temperature water–gas shift reaction. J. Catal. 2009;263:155–166. doi: 10.1016/j.jcat.2009.02.004. [DOI] [Google Scholar]
- 53.Chen CS, Lai TW, Chen CC. Effect of active sites for a wate–gas shift reaction on Cu nanoparticles. J. Catal. 2010;273:18–28. doi: 10.1016/j.jcat.2010.04.019. [DOI] [Google Scholar]
- 54.Yao SY, et al. Morphological effect of the nanostructured ceria support on the activity and stability of CuO/CeO2 catalysts for water-gas shift reaction. Phys. Chem. Chem. Phys. 2014;16:17183–19195. doi: 10.1039/C4CP02276A. [DOI] [PubMed] [Google Scholar]
- 55.Mcbride JR, et al. Raman and x-ray studies of Ce1−xRExO2−y, where RE=La, Pr, Nd, Eu, Gd, and Tb. J. Appl. Phys. 1994;76:2435–2441. doi: 10.1063/1.357593. [DOI] [Google Scholar]
- 56.Wu Z, et al. Probing defect sites on CeO2 nanocrystals with well-defined surface planes by Raman spectroscopy and O2 adsorption. Langmuir. 2010;26:16595–16606. doi: 10.1021/la101723w. [DOI] [PubMed] [Google Scholar]
- 57.Guo M, et al. UV and visible Raman studies of oxygen vacancies in rare-earth-doped ceria. Langmuir. 2011;27:3872–3877. doi: 10.1021/la200292f. [DOI] [PubMed] [Google Scholar]
Associated Data
This section collects any data citations, data availability statements, or supplementary materials included in this article.
Supplementary Materials
Data Availability Statement
The main data supporting the findings of this study are available within the article and its Supplementary information. Extra data are available from the corresponding author upon request.