

Abstract
Objectives
This study aimed to assess the accuracy of pregnant women’s perceptions of maternity facility quality and the association between perception accuracy and the quality of facility chosen for delivery.
Design
A cohort study.
Setting
Nairobi, Kenya.
Participants
180 women, surveyed during pregnancy and 2 to 4 weeks after delivery.
Primary outcome measures
Women were surveyed during pregnancy regarding their perceptions of the quality of all facilities they were considering during delivery and then, after delivery, about their ultimate facility choice. Perceptions of quality were based on perceived ability to handle emergencies and complications. Delivery facilities were assigned a quality index score based on a direct assessment of performance of emergency ‘signal functions’, skilled provider availability, medical equipment and drug stocks. ‘Accurate perceptions’ was a binary variable equal to one if a woman’s ranking of facilities based on her quality perception equalled the index ranking. Ordinary least squares and logistic regressions were used to analyse associations between accurate perceptions and quality of the facility chosen for delivery.
Results
Assessed technical quality was modest, with an average index score of 0.65. 44% of women had accurate perceptions of quality ranking. Accurate perceptions were associated with a 0.069 higher delivery facility quality score (p=0.039; 95% CI: 0.004 to 0.135) and with a 14.5% point higher probability of delivering in a facility in the top quartile of the quality index (p=0.015; 95% CI: 0.029 to 0.260).
Conclusions
Patient misperceptions of technical quality were associated with use of lower quality facilities. Larger studies could determine whether improving patient information about relative facility quality can encourage use of higher quality care.
Keywords: health economics, health & safety, quality in health care
Strengths and limitations of this study.
This study measured pregnant women’s perceptions of maternity facility quality in the informal settlements of Nairobi, Kenya, where most women deliver in facilities, but facility quality varies widely.
This is one of the first studies to quantify information asymmetry in low- and middle- income countries, through measuring the accuracy of pregnant women’s perceptions of technical quality at delivery facilities.
This study measured perception accuracy longitudinally, so that perceptions were captured prior to facility choice.
Limitations of the study include the relatively small sample size and the possible limited generalisability to populations outside the urban poor in Nairobi, Kenya.
Introduction
Sixty-six per cent of maternal deaths in 2015 took place in sub-Saharan Africa, a substantial percentage of which result from conditions that are treatable or preventable with high-quality care such as infections and postpartum haemorrhage.1–3 Nearly one-third of deaths in the first 24 hours of life are attributable to a lack of simple measures such as skin-to-skin contact and proper cleaning of the umbilical cord, and around 75% of maternal deaths are due to preventable and/or treatable causes.3 4
Recent studies show high variability in maternity facility quality levels in the context of Africa and highlight inadequate quality as a major challenge to maternal and newborn mortality reductions.2 5–10 One study found that nearly 90% of maternal care facilities in five African countries lacked the capacity to perform C-sections.10 Other multi-country studies have found that high coverage of basic essential services may not be enough to reduce delivery-related mortality without improving the technical quality of care received.2 6–8 In Nairobi, Kenya, hundreds of widely varying maternity facilities operate. These facilities are not well-regulated and many do not meet minimum quality standards.11
Several studies from Africa provide evidence that, while women have strong stated and revealed preferences for delivering in high-quality facilities, many of them do not end up in facilities of high quality.12–15 Important factors in determining maternity facility choice are facility cost and distance, as well as women’s education level and cultural beliefs.16 17 Evidence from low-income countries show that perceptions of facility quality may also influence facility choice.13 14 18 While pregnant women often express preference for delivering with high-quality providers, the extent to which women can accurately perceive quality prior to utilisation is unknown. Asymmetric information about provider quality is a well-known driver of market failures in health.19 20 Inaccurate perceptions of provider quality may be significant for pregnant women because obstetrical and newborn complications are rare, and the technical skills of maternity providers are hard to observe. Several studies have explored questions pertaining to information asymmetry by, for example, investigating women’s reliance on or understanding of quality metrics in their decision-making.21 22 A recent study in Africa also showed a disconnect between women’s perceptions of quality and objective technical quality measures.23 However, none explores the accuracy of women’s perceptions of facility quality prior to facility utilisation and the degree to which misperceptions of quality are associated with use of lower quality care.
This study measured the accuracy of perceptions of maternity facility quality among a sample of pregnant women in Nairobi, Kenya, and analysed the extent to which accurate perceptions are associated with delivery in higher quality facilities.
Methods
Patient and public involvement statement
The study did not involve patients, as it was based on a secondary analysis of data collected for a previous study.12
Study participants and data collection
We used data collected for a randomised controlled trial described in detail in Cohen et al (2017).12 The study took place between 2015 and 2016 in 24 neighbourhoods within the informal settlements (‘slums’) surrounding Nairobi, Kenya. These neighbourhoods are densely populated, with limited access to social services.24 Pregnant women were recruited through community recruitment events, community health worker listings and snowball sampling. For study inclusion, women had to be in their 5th to 7th gestational month, at least 18 years old, planning to stay in Nairobi until at least 2 weeks postpartum, and intending to deliver at a health facility. Women were surveyed at three time-points: baseline (5th to 7th gestational month), midline (8th gestational month) and endline (2 to 4 weeks after delivery).
The baseline and midline surveys captured basic demographic information and pregnancy-related history. The endline survey captured information about the woman’s delivery, including her facility of choice. Three-quarters of the sample was randomly selected to be surveyed at baseline and midline about perceptions of delivery facility quality. Women in this subsample were asked to list all facilities being considered for delivery, regardless of how likely they thought it was that they would use the facility. Each facility name was written on a piece of paper and cut out. Women were then asked to rank these facilities on a visual analogue ladder scale from best to worst based on different dimensions of perceived quality and cost, with ties allowed. The quality dimension used in this study was women’s ranking of facilities based on her perception of their ‘ability to handle emergencies and complications’.
Information about the technical quality of facilities where women delivered was also collected. The facility assessment was adapted from the Averting Maternal Death and Disability Program’s emergency obstetric and newborn care (EmONC) needs assessment toolkit.25 This toolkit assesses inputs including infrastructure, human resources, supplies and equipment for EmONC. It collects information about performance of ‘signal functions’ of basic and comprehensive emergency obstetric and newborn care, which have been shown to be correlated with delivery outcomes.25 The assessment also collects information on recent performance of the routine care signal functions proposed by Gabrysch et al and Tripathi et al. 26 27
Measure of facility technical quality
A facility technical quality index was constructed based on the data collected from the facility assessment. The index captured a facility’s ability to handle emergencies and complications through measures of facility process, equipment, supplies and skilled provider availability (online supplementary table A1). It included 17 facility-reported signal functions measuring recent performance of emergency obstetric and newborn care practices, for example the administration of parenteral oxytocin for postpartum haemorrhage and parenteral antibiotics for newborn sepsis.26 27 The index also included a facility-reported variable for whether at least one medical officer was present onsite 24 hours a day and 7 days a week, as well as a binary variable for whether the facility was observed to have stocks of certain essential equipment necessary for common and rare complications as defined by Ngabo et al.28 The facility quality index was calculated as the fraction of these 19 variables met at each facility.
bmjopen-2019-029486supp001.pdf (268.9KB, pdf)
Measure of accuracy of quality perceptions
We created a measure of accurate perceptions of facility technical quality using women’s rankings during their 8th gestational month. This variable is equal to 1 if the woman’s ranking of facilities based on her perception of their ability to handle emergencies matched the actual ranking based on the quality index. For women who had more than one facility with the same relative ranking (17% of the study sample), perceptions were considered accurate if the facilities had an identical quality index score.
Sample
Five hundred and fifty-three women were surveyed at baseline. Among these, 459 women and 454 women were reached for midline and endline, respectively. Attrition was primarily due to temporary relocation around the time of delivery to be with family members, miscarriages or newborn mortality.12 The study sample was constructed from the women surveyed at midline who were also randomly selected to be asked about facility quality perceptions (n=334). We restricted the sample to women considering more than one facility, in order for us to assess their quality rankings (n=280), and to women whose consideration set included at least two assessed facilities (n=221). Finally, we only included women whose delivery facility was assessed. The final analysis sample included 180 women. The characteristics of this analysis sample are similar to the original baseline sample ((online supplementary table A2).
Seventy-nine health facilities were targeted for assessment in the original study and all but 15 of these were reached for assessment (online supplementary figure A1). Incompletion was primarily due to facility administrative delays and permanent facility closure. Of these 64 health facilities assessed in the original study, 3 reported no deliveries in the past 3 months and 22 were not used by women in our analysis sample. The facility analysis sample thus included 42 facilities, of which 16 were public, 18 were private and eight were non-governmental organisations (NGO)/mission facilities. Twenty of the facilities were hospitals and 22 were health centres.
Statistical methods
The primary outcome was the quality of facility used for delivery with respect to the facility’s ability to manage emergencies and complications, as measured by the quality index. We used ordinary least squares regressions to analyse the relationship between accurate perceptions and the quality index for the delivery facility used. Adjusted regressions included indicator variables for treatment arm in the original randomised controlled trial, neighbourhood location, gestational month at baseline and the number of facilities in a woman’s consideration set. They also included: (i) a categorical variable indicating if she previously had a C-section or whether the child was a first birth, (ii) a binary variable indicating whether she reported receiving information from a health worker that her current pregnancy was high-risk, (iii) a binary variable indicating whether she reported that it would be difficult to collect 1000 Ksh, (roughly 10 US$) if needed for a health emergency, (iv) a binary variable for whether she obtained a education or higher, (v) a binary variable indicating marital status, (vi) a binary variable indicating health insurance status and (vii) a binary variable indicating whether she had four or more prenatal care visits. In ordinary least squares and logistic regression specifications, we also estimated the association between accurate perceptions and delivery in a facility in each quartile of the quality index range and in facilities at different levels of the health system (primary health centre, hospital and tertiary hospital). Robust standard errors were used in the ordinary least squares specifications.
We tested the robustness of the results to a different definition of facility quality and to a more lenient definition of accurate perceptions. For facility quality, we used the number (count) of basic emergency obstetric and newborn care (BEmONC) signal functions (out of 7) performed.29 For the more lenient definition of accurate perceptions, we consider women who incorrectly ranked two facilities with equal index values as not being tied to have had ‘accurate’ perceptions.
Results
The mean quality index for the 42 delivery facilities used by women in the study sample was 0.652 (SE=0.240), meaning that the average facility met 65.2% of the quality measures captured in the index. The index ranged from 0.16 to 1 across facilities. Average quality was 0.707 (SE=0.213) for public facilities, 0.544 (SE=0.231) for private facilities and 0.873 (0.193) for NGO/mission facilities. Quality was higher for hospitals than for lower level facilities (0.823 vs 0.496; p<0.001). Online supplementary table A2 presents facilities’ performance for each item in the index. There was wide variation in the percentage of facilities meeting each item. For example, most facilities reported administering parenteral antibiotics and oxytocin for maternal sepsis and (pre-)eclampsia, and very few reported conducting assisted delivery with vacuum/forceps.
Forty-four per cent of women had accurate perceptions of facility quality. table 1 presents characteristics of the sample, overall and by perception accuracy. On average, women in the sample were 25 years old, 32.7% of them were pregnant for the first time and 85.6% were married. There were no statistically significant differences between women with accurate and inaccurate quality perceptions.
Table 1.
Sample characteristics (N=180)
| Mean/percentage (SE) | Overall sample | Inaccurate perceptions | Accurate perceptions | P value on test of equality: (2)=(3) |
| 1 | 2 | 3 | 4 | |
| Mean age, years | 25.34 (4.73) | 25.02 (0.43) | 25.75 (0.59) | 0.31 |
| Married | 85.56 (0.35) | 85.15 (0.04) | 86.07 (0.04) | 0.86 |
| Any secondary or postsecondary education | 65.56 (0.48) | 66.34 (0.047) | 64.56 (0.054) | 0.80 |
| Electricity in household | 93.89 (0.24) | 92.08 (0.03) | 96.20 (0.02) | 0.25 |
| Would be “difficult” or “very difficult” to pay roughly $10 for treatment if household member became ill† | 60.00 (0.49) | 61.39 (0.05) | 58.23 (0.06) | 0.67 |
| Health insurance | 38.33 (0.49) | 37.62 (0.05) | 39.24 (0.06) | 0.82 |
| First pregnancy | 32.67 (0.47) | 27.78 (0.05) | 36.71 (0.05) | 0.20 |
| Pregnancies, number | 2.13 (1.05) | 2.15 (0.10) | 2.10 (0.12) | 0.77 |
| Antenatal visits, number | 2.99 (1.05) | 2.98 (0.10) | 3.01 (0.11) | 0.16 |
| Previous C-section (among those with previous birth) | 9.83 (0.30) | 8.22 (0.03) | 12.25 (0.05) | 0.46 |
| People with whom delivery location was discussed, number | 0.54 (0.76) | 0.56 (0.08) | 0.51 (0.08) | 0.61 |
| Informed by provider to have a high risk pregnancy | 8.33 (0.38) | 5.15 (0.02) | 11.39 (0.035) | 0.19 |
*Amount converted from Kenyan Shillings (1000) to US Dollars using April 2017 conversion rate of 0.0097.
Figure 1 presents the distribution of the quality index for facilities used by women in the study sample. The mean quality of facility used for delivery was 0.716 and the median was 0.737. Accurate perceptions of facility quality were associated with a 0.075 (p=0.026) higher delivery facility quality in the unadjusted model and a 0.069 (p=0.039) higher delivery facility quality in the adjusted model (table 2). Figure 2 demonstrates the fraction of women delivering in facilities of each quartile of the quality index. A 10.9% of women with inaccurate perceptions delivered in the highest quartile facilities, compared with 26.6% of women with accurate perceptions (figure 2). Regression coefficient estimates associated with this figure are presented in online supplementary table A3, along with logistic regression models of the association between perception accuracy and delivery in a facility within each quartile of the quality index.
Figure 1.

Distribution of quality index among facilities used for delivery (N=180). Notes: Box plot presenting the distribution of the index measure for final facilities of choice in the overall sample of 180 women. Top and bottom horizontal boundaries of the boxes show the 25th and 75th percentiles, respectively, while the extending top and bottom vertical lines denote the 95th and 5th percentiles, respectively.
Table 2.
Regression estimates of association between perception accuracy and quality of delivery facility (N=180)
| Variable | Unadjusted | Adjusted | |||||
| Estimate | P value | 95% CI | Estimate | P value | 95% CI | ||
| Accurate perceptions of quality | 0.075* | 0.026 | 0.009 | 0.141 | 0.069* | 0.039 | 0.004 to 0.135 |
| Antenatal visits, 4+ | 0.071* | 0.032 | 0.006 to 0.135 | ||||
| Very difficult to collect 1000 Ksh | 0.042 | 0.181 | −0.020 to 0.104 | ||||
| Secondary education or higher | -0.065* | 0.046 | −0.128 to −0.001 | ||||
| Consideration set size (ref=2) | |||||||
| 3 | -0.013 | 0.741 | −0.092 to 0.066 | ||||
| 4+ | 0.159** | 0.001 | 0.070 to 0.248 | ||||
| Insurance (self-reported) | 0.037 | 0.246 | −0.026 to 0.099 | ||||
| C-section (ref=no; not first pregnancy) | |||||||
| Yes | 0.241*** | 0.000 | 0.140 to 0.343 | ||||
| No, because first pregnancy | 0.141*** | 0.000 | 0.075 to 0.207 | ||||
| Information about risk in pregnancy by a provider | 0.028 | 0.638 | −0.089 to 0.145 | ||||
| Married | -0.015 | 0.745 | −0.107 to 0.076 | ||||
Ordinary least squares regressions with robust standard errors.
*p<0.05; **p<0.01; ***p<0.001.
Ksh, Kenyan Shillings.
Figure 2.

Fraction of women delivering in each quartile of quality index, by perception accuracy (N=180). Notes: Quartile ranges: bottom (0.15–0.47), second (0.53–0.74), third (0.79–0.89), top (0.95–1.0).
Figure 3 shows multivariate logistic regression estimates of the relationship between perception accuracy and the odds of delivery in facilities at different levels of the health system. Accurate perceptions were associated with 0.49 lower odds of delivering in a primary health centre (p=0.084) and 1.73 higher odds of delivering in a tertiary hospital (p=0.199), but neither was statistically significant.
Figure 3.
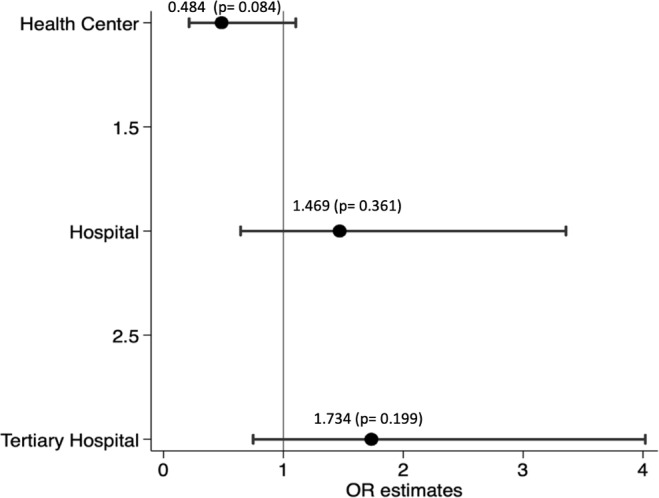
Multivariate logistic regressions of delivering in facilities by level (N=180). Notes: Multivariate logistic regressions. Each estimate is from a separate regression with odds of delivering at facility level as outcome. All covariates are measured at midline and missing values are imputed with values reported as baseline.
Sensitivity analyses showed that the results were robust to changes in the definition of the quality index and to the construction of the perceptions variable. Accurate perceptions were associated with an increase of roughly 0.5 (out of 7) BEmONC signal functions in the facility used for delivery (online supplementary table A4). When using a more lenient definition of ‘accurate perceptions’, accurate perceptions were associated with a 0.090 (p=0.009) higher delivery facility quality (online supplementary table A5).
Discussion
This study found that pregnant women often misjudge the quality of available maternity facilities with respect to their ability to handle emergencies. Accurate perceptions were associated with the use of higher technical quality facilities and with an increase the probability of delivery in the highest-quality (top-quartile) facilities.
Several factors likely contributed to the observed inaccuracy of quality perceptions. First, the maternity landscape in Nairobi, Kenya, is complex and women face a substantial degree of choice, with hundreds of different options when choosing a maternity facility. Second, most women do not deliver where they receive prenatal care and there is not a strong role of referral in Nairobi so there are relatively few opportunities to receive information about facilities’ technical competence. Additionally, many elements of facility technical quality would be hard for patients to observe and judge. Finally, we do not find meaningful associations between measures of socioeconomic status and quality perceptions. It is possible however that the urban poor patients’ perceptions of facility quality are overly positive partly because of the typical living conditions in urban informal settlements and how they compare with the conditions in facilities.
Our study has several strengths. To the best of our knowledge, this is the first study that attempts to quantify the accuracy of patient perceptions of maternity facility quality prior to their delivery. We assess quality perceptions in a context where women have the choice of many widely-varying providers and where the lowest quality facilities appear extremely ill-equipped to manage emergencies. Our study assesses the relationship between stated quality perceptions and facility choice longitudinally, so that perceptions are captured prior to facility choice and delivery experience. Many studies assess the relationship between patient-reported experiences and assessed facility quality after patients’ experience of care.23 30 31 These studies offer valuable information about how patients’ experiences of care align with ‘objective’ measures of facility quality but do not allow for an analysis of how quality perceptions influence facility choice. Our results are also robust to different specifications, covariate adjustment and constructions of the dependent and independent variables.
Our study has several limitations. First, the sample size was limited and results may not be generalisable to populations outside the urban poor in Nairobi, Kenya. This population is likely to be increasingly important for understanding public health, as nearly one billion people live in urban slums worldwide and more than half of all births are projected to be in urban areas by 2050.32 33 Second, while our measure of facility quality was derived from commonly-used indicators in the literature, it was based on facility-reported performance of essential functions and observations of equipment and medications, rather than observations of the actual care women receive in labour and delivery.
There are also several potential limitations to our measure of quality perceptions. In order to align our measure of perceptions with our measure of assessed facility quality we focused on a facility’s emergency capability. However, overall facility quality (and women’s perceptions of quality) is based on many factors beyond emergency capability. Full analyses of the relationship between quality perceptions and objective facility quality would need to incorporate the many other dimensions of quality highlighted in the literature including waiting time, respectful care, provider skill, etc.23 34 35 More research is needed on which aspects of quality perceptions matter most to women in their choice of delivery facility, and what attributes of quality would most benefit health outcomes when improved.14 23 36–39 Furthermore, our study did not necessarily capture the causal relationship between quality perceptions and facility quality. While our estimates were robust to adjustment for measured confounders, potential uncontrolled confounding is still possible.
The United Nations has set ambitious Sustainable Development Goals, which include target reductions in maternal and newborn mortality by 2030.40 With poor quality of care estimated to cause half of maternal deaths annually, accelerating progress toward these goals in sub-Saharan Africa requires a shift from ensuring access to institutional delivery toward encouraging delivery in a high-quality facility.41 Our study supports previous evidence on the wide variation in facility quality that has been found previously in Africa. While our study simply cannot establish a causal relationship between misperception of quality and delivery in high-quality facilities, it suggests that providing information to pregnant women about the quality of available maternity facilities may be a promising approach to steering women toward higher quality options and should be evaluated. To evaluate the potential impact of information on facility delivery choice more research is needed on how to collect and disseminate reliable and comprehensible measures of delivery facility quality in low- and middle-income countries.
Supplementary Material
Footnotes
Contributors: ZAS implemented the data analysis and wrote the first draft of the manuscript. JC oversaw data analysis and contributed substantially to the editing of the manuscript. MMcC contributed to the conceptual development of the research question and sensitivity analysis and edited the manuscript. JC and MMcC led the experimental design and data collection process of the primary data that was used in the study. GG, GN and CR contributed to study design, participant enrolment data analysis and manuscript review.
Funding: The authors have not declared a specific grant for this research from any funding agency in the public, commercial or not-for-profit sectors.
Competing interests: None declared.
Patient consent for publication: Not required.
Ethics approval: The randomised controlled trial that generated the data used in this secondary analysis received IRB approval from Institutional Review Boards at both the Harvard T. H. Chan School of Public Health and AMREF Health Africa. This secondary analysis used de-identified data from this study.
Provenance and peer review: Not commissioned; externally peer reviewed.
Data availability statement: Data are available upon reasonable request.
References
- 1. WHO Trends in maternal mortality: 1990 to 2015 estimates by who, UNICEF, UNFPA, world bank group and the United nations population division, 2015. Available: https://apps.who.int/iris/bitstream/handle/10665/194254/9789241565141_eng.pdf?sequence=1 [Accessed on: May 11, 2019].
- 2. Kruk ME, Gage AD, Joseph NT, et al. Mortality due to low-quality health systems in the universal health coverage era: a systematic analysis of amenable deaths in 137 countries. The Lancet 2018;392:2203–12. 10.1016/S0140-6736(18)31668-4 [DOI] [PMC free article] [PubMed] [Google Scholar]
- 3. Say L, Chou D, Gemmill A, et al. Global causes of maternal death: a who systematic analysis. The Lancet Global Health 2014;2:e323–33. 10.1016/S2214-109X(14)70227-X [DOI] [PubMed] [Google Scholar]
- 4. World Health Organization Every newborn: an action plan to end preventable deaths. Geneva: World Health Organization, 2014. [Google Scholar]
- 5. Bhutta ZA, Das JK, Bahl R, et al. Can available interventions end preventable deaths in mothers, newborn babies, and stillbirths, and at what cost? The Lancet 2014;384:347–70. 10.1016/S0140-6736(14)60792-3 [DOI] [PubMed] [Google Scholar]
- 6. Jha AK, Larizgoitia I, Audera-Lopez C, et al. The global burden of unsafe medical care: Analytic modelling of observational studies. BMJ Qual Saf 2013;22:809–15. 10.1136/bmjqs-2012-001748 [DOI] [PubMed] [Google Scholar]
- 7. Fink G, Ross R, Hill K. Institutional deliveries weakly associated with improved neonatal survival in developing countries: evidence from 192 demographic and health surveys. Int J Epidemiol 2015;44:1879–88. 10.1093/ije/dyv115 [DOI] [PubMed] [Google Scholar]
- 8. Souza JP, Gülmezoglu AM, Vogel J, et al. Moving beyond essential interventions for reduction of maternal mortality (the who multicountry survey on maternal and newborn health): a cross-sectional study. The Lancet 2013;381:1747–55. 10.1016/S0140-6736(13)60686-8 [DOI] [PubMed] [Google Scholar]
- 9. Kruk ME, Leslie HH, Verguet S, et al. Quality of basic maternal care functions in health facilities of five African countries: an analysis of national health system surveys. The Lancet Global Health 2016;4:e845–55. 10.1016/S2214-109X(16)30180-2 [DOI] [PubMed] [Google Scholar]
- 10. Montagu D, Sudhinaraset M, Diamond-Smith N, et al. Where women go to deliver: understanding the changing landscape of childbirth in Africa and Asia. Health Policy Plan 2017;32:1146–52. 10.1093/heapol/czx060 [DOI] [PMC free article] [PubMed] [Google Scholar]
- 11. Ziraba AK, Mills S, Madise N, et al. The state of emergency obstetric care services in Nairobi informal settlements and environs: results from a maternity health facility survey. BMC Health Serv Res 2009;9:46 10.1186/1472-6963-9-46 [DOI] [PMC free article] [PubMed] [Google Scholar]
- 12. Cohen J, Rothschild C, Golub G, et al. Measuring the impact of cash transfers and behavioral ‘nudges’ on maternity care In Nairobi, Kenya. Health Aff 2017;36:1956–64. 10.1377/hlthaff.2017.0537 [DOI] [PubMed] [Google Scholar]
- 13. Leonard KL. Active patients in rural African health care: implications for research and policy. Health Policy Plan 2014;29:85–95. 10.1093/heapol/czs137 [DOI] [PubMed] [Google Scholar]
- 14. Kruk ME, Paczkowski M, Mbaruku G, et al. Women's preferences for place of delivery in rural Tanzania: a population-based discrete choice experiment. Am J Public Health 2009;99:1666–72. 10.2105/AJPH.2008.146209 [DOI] [PMC free article] [PubMed] [Google Scholar]
- 15. Uzochukwu BSC, Onwujekwe OE, Akpala CO. Community satisfaction with the quality of maternal and child health services in Southeast Nigeria. East Afr Med J 2004;81:293–9. 10.4314/eamj.v81i6.9178 [DOI] [PubMed] [Google Scholar]
- 16. Kyei-Nimakoh M, Carolan-Olah M, McCann TV. Access barriers to obstetric care at health facilities in sub-Saharan Africa—a systematic review. Syst Rev 2017;6:110 10.1186/s13643-017-0503-x [DOI] [PMC free article] [PubMed] [Google Scholar]
- 17. Onah HE, Ikeako LC, Iloabachie GC. Factors associated with the use of maternity services in Enugu, southeastern Nigeria. Soc Sci Med 2006;63:1870–8. 10.1016/j.socscimed.2006.04.019 [DOI] [PubMed] [Google Scholar]
- 18. Fisseha G, Berhane Y, Worku A, et al. Distance from health facility and mothers’ perception of quality related to skilled delivery service utilization in northern Ethiopia. International Journal of Women’s Health 2017;9:749–56. 10.2147/IJWH.S140366 [DOI] [PMC free article] [PubMed] [Google Scholar]
- 19. Arrow K. Uncertainty and the welfare economics of medical care. American Economic Review 1963;53:941–73. [Google Scholar]
- 20. Hsiao WC. Abnormal economics in the health sector. Health Policy 1995;32:125–39. 10.1016/0168-8510(95)00731-7 [DOI] [PubMed] [Google Scholar]
- 21. Gourevitch RA, Mehrotra A, Galvin G, et al. How do pregnant women use quality measures when choosing their obstetric provider? Health Affairs 2017;44:120–7. [DOI] [PMC free article] [PubMed] [Google Scholar]
- 22. Bailit JL, Gregory KD, Srinivas S, et al. Society for Maternal-Fetal medicine (SMFM) special report: current approaches to measuring quality of care in obstetrics. Am J Obstet Gynecol 2016;215:B8–B16. 10.1016/j.ajog.2016.06.048 [DOI] [PubMed] [Google Scholar]
- 23. Diamond-Smith N, Sudhinaraset M, Montagu D. Clinical and perceived quality of care for maternal, neonatal and antenatal care in Kenya and Namibia: the service provision assessment. Reprod Health 2016;13 10.1186/s12978-016-0208-y [DOI] [PMC free article] [PubMed] [Google Scholar]
- 24. Beguy D, Elung'ata P, Mberu B, Donatien B, Patricia E, Blessing M, et al. Health & Demographic Surveillance System Profile: The Nairobi Urban Health and Demographic Surveillance System (NUHDSS). Int J Epidemiol 2015;44:462–71. 10.1093/ije/dyu251 [DOI] [PubMed] [Google Scholar]
- 25. The Averting Maternal Death and Disability program Available: https://www.mailman.columbia.edu/research/averting-maternal-death-and-disability-amdd/toolkit [Accessed on 13 May 2019].
- 26. Gabrysch S, Civitelli G, Edmond KM, et al. New signal functions to measure the ability of health facilities to provide routine and emergency newborn care. PLoS Med 2012;9:e1001340 10.1371/journal.pmed.1001340 [DOI] [PMC free article] [PubMed] [Google Scholar]
- 27. Tripathi V, Stanton C, Strobino D, et al. Development and validation of an index to measure the quality of Facility-Based labor and delivery care processes in sub-Saharan Africa. PLoS One 2015;10:e0129491 10.1371/journal.pone.0129491 [DOI] [PMC free article] [PubMed] [Google Scholar]
- 28. Ngabo F, Zoungrana J, Faye O. Quality of care for prevention and management of common maternal and newborn complications findings from a national health facility survey in Rwanda. Jhpiego Baltimore 2012. [Google Scholar]
- 29. WHO Unicef, UNFPA, et al Monitoring emergency obstetric care: a Handbook. Geneva: World Health Organization, 2009: Available at: 11 May 2019. [Google Scholar]
- 30. Seth WG, Boulding W, Manary M, et al. Patient satisfaction and its relationship with clinical quality and inpatient mortality in acute myocardial infarction. Cardiovascular Quality and Outcomes 2010;3:188–95. [DOI] [PubMed] [Google Scholar]
- 31. Valentine N, Darby C, Bonsel GJ. Which aspects of non-clinical quality of care are most important? Results from WHO's general population surveys of “health systems responsiveness” in 41 countries. Soc Sci Med 2008;66:1939–50. 10.1016/j.socscimed.2007.12.002 [DOI] [PubMed] [Google Scholar]
- 32. Myrphy J. 1 billion live in slums, 2003. Available: https://www.cbsnews.com/news/1-billion-live-in-slums [Accessed on : 8 Dec 2018].
- 33. Kruk ME, Kujawski S, Moyer CA, et al. Next generation maternal health: external shocks and health-system innovations. The Lancet 2016;388:2296–306. 10.1016/S0140-6736(16)31395-2 [DOI] [PMC free article] [PubMed] [Google Scholar]
- 34. Abuya T, Warren CE, Miller N, et al. Exploring the prevalence of Disrespect and abuse during childbirth in Kenya. PLoS One 2015;10:e0123606 10.1371/journal.pone.0123606 [DOI] [PMC free article] [PubMed] [Google Scholar]
- 35. Kelley JM, Kraft-Todd G, Schapira L, et al. The influence of the patient-clinician relationship on healthcare outcomes: a systematic review and meta-analysis of randomized controlled trials. PLoS One 2014;9:e94207 10.1371/journal.pone.0094207 [DOI] [PMC free article] [PubMed] [Google Scholar]
- 36. Belay A, Sendo E. Factors determining choice of delivery place among women of child bearing age in Dega Damot district, North West of Ethiopia: a community based cross- sectional study. BMC Pregnancy Childbirth 2016;16:229 10.1186/s12884-016-1020-y [DOI] [PMC free article] [PubMed] [Google Scholar]
- 37. Isaac T, Zaslavsky AM, Cleary PD, et al. The relationship between patients' perception of care and measures of hospital quality and safety. Health Serv Res 2010;45:1024–40. 10.1111/j.1475-6773.2010.01122.x [DOI] [PMC free article] [PubMed] [Google Scholar]
- 38. Chang JT, Hays RD, Shekelle PG, et al. Patients’ global ratings of their health care are not associated with the technical quality of their care. Ann Intern Med 2006;145:635–6. [DOI] [PubMed] [Google Scholar]
- 39. Tayler-Smith K, Zachariah R, Manzi M, et al. An ambulance referral network improves access to emergency obstetric and neonatal care in a district of rural Burundi with high maternal mortality. Trop Med Int Health 2013;18:993–1001. 10.1111/tmi.12121 [DOI] [PubMed] [Google Scholar]
- 40. UN Sustainable development Goals- health, 2018. Available: https://www.un.org/sustainabledevelopment/health/ [Accessed on May 11, 2019].
- 41. Kruk ME, Gage AD, Arsenault C, Catherine A, et al. High-Quality health systems in the sustainable development goals era: time for a revolution. The Lancet Global Health 2018;6:e1196–252. 10.1016/S2214-109X(18)30386-3 [DOI] [PMC free article] [PubMed] [Google Scholar]
Associated Data
This section collects any data citations, data availability statements, or supplementary materials included in this article.
Supplementary Materials
bmjopen-2019-029486supp001.pdf (268.9KB, pdf)