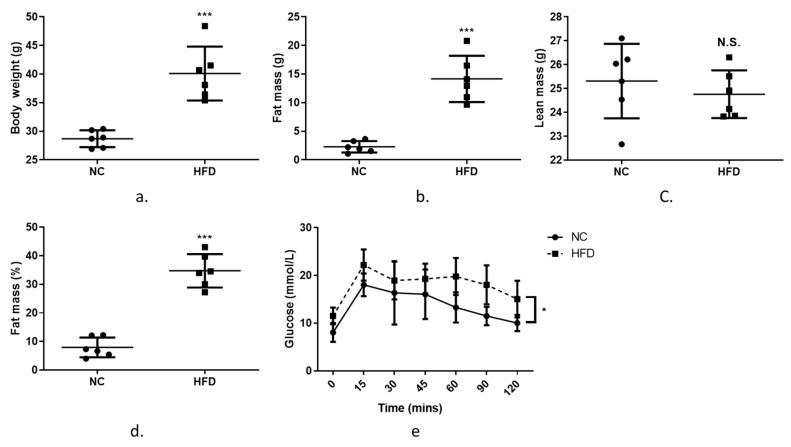
Figure 6.
Characteristics of mice fed a normal chow (NC) diet or a high-fat diet (HFD) for 10 weeks. (a) body weight (g), (b) fat mass (g), (c) lean mass (g), (e) fat mass (%), (f) plasma glucose levels over 120 min following an oral gavage of 2 g glucose/kg lean body mass (25% w/v glucose solution). Unpaired t-test was used for the NC versus the HFD comparisons (a–d) and a two-way repeated measure ANOVA was used for the OGTT (e). Graphs indicate mean ± SD. * = p < 0.05. *** p < 000.1.

