

Abstract
Pelargonidin, a well-known natural anthocyanidin found in berries strawberries, blueberries, red radishes and other natural foods, has been found to possess health beneficial effects including anti-cancer effect. Herein, we investigated the effect of pelargonidin on cellular transformation in mouse skin epidermal JB6 (JB6 P+) cells induced by tumor promoter 12-O-tetradecanoylphorbol-13-acetate (TPA). Pelargonidin treatment significantly decreased colony formation and suppressed cell viability of JB6 P+ cells. Pelargonidin also induced the anti-oxidant response element (ARE)-luciferase activation in HepG2-C8 cells overexpressing the ARE-luciferase reporter. Knockdown of nuclear factor E2-related factor 2 (Nrf2) in shNrf2 JB6 P+ cells enhanced TPA-induced colony formation and attenuated pelargonidin’s blocking effect. Pelargonidin reduced the protein levels of genes encoding methyltransferases (DNMTs) and histone deacetylases (HDACs). Importantly, pelargonidin decreased the DNA methylation in the Nrf2 promoter region of JB6 P+ cells and increased Nrf2 downstream target genes expression, such as NAD(P)H/quinone oxidoreductase 1 (NQO1) and heme oxygenase-1 (HO-1), involved in cellular protection. In summary, our results showed that pelargonidin blocks TPA-induced cell transformation. The possible molecular mechanisms of its potential anti-cancer effects against neoplastic transformation may be attributed to its activation of Nrf2-ARE signaling pathway and its cytoprotective effect.
Keywords: pelargonidin, epigenetics, Nrf2, antioxidant, mouse epidermal cells
1. Introduction
Anthocyanidins are well-known and powerful antioxidants that have been applied in the treatment of various disorders induced by oxidative stress [1]. Pelargonidin (pelargonidin chloride chemical structure is shown in Fig. 1) is one type of anthocyanidin, which are plant pigments that are found in vegetables and fruits, such as red radishes [2] and berries, including lingonberries, cranberries, saskatoon berries, chokeberries, blueberries and strawberries [3–5]. Pelargonidin has also been detected in pomegranate [6] and kidney beans [7]. Pelargonidin exerts various biological activities including antioxidant [8], anti-inflammatory [9], antithrombotic [10], and anti-diabetic [11]. Furthermore, the chemopreventive potential of pelargonidin has been investigated in a cell model, in which it upregulated the activities and levels of detoxification enzymes to block reactive oxygen species (ROS) [8]. However, the underlying antioxidant mechanism of pelargonidin remains poorly understood.
Fig. 1.
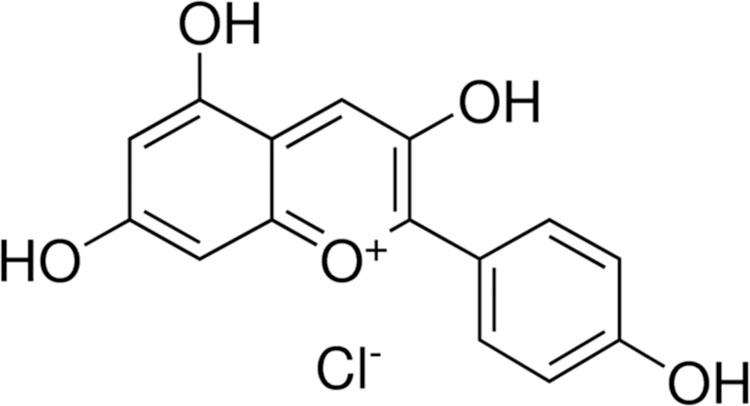
Chemical structure of pelargonidin chloride.
Nuclear factor E2-related factor 2 (Nrf2) is an important transcription factor that protects against damage induced by oxidative stress [12]. Nrf2 is transported into the nucleus in response to oxidative stress to activate the expression of many antioxidative stress genes by binding to the antioxidant response element (ARE) region [13]. In unstressed conditions, the Nrf2 level is very low, and is mainly located in the perinuclear cytoplasm through a negative regulator of Kelch-like ECH-associated protein 1 (KEAP1) in normal cells. However, activated Nrf2 translocates to the nucleus, where it binds to ARE and induces transcription of many cytoprotective genes under oxidative stress caused by ROS and toxic chemicals [14, 15]. Importantly, aberrant accumulation of Nrf2 has been reported in Nrf2-addicted cancer cells through disrupted binding of KEAP1 to Nrf2 [15, 16]. Aberrant Nrf2 activation promotes cell proliferation and cancer progression, and contributes to therapy resistance [16]. Previous studies have also reported that Nrf2 plays an important role in resistance to oxidative stress and chemical-induced damage, as verified by Nrf2-deficient mice [17, 18]. Recent research has indicated that many dietary natural compounds, such as triterpenoids, isothiocyanates, and polyphenols, exert anti-inflammatory, anti-tumor and antioxidation effects by activating the Nrf2-ARE pathway [19].
Epigenetic regulation is emerging as an important mechanism for controlling phenotypic gene expression and is potentially involved in many diseases, including cancer [20–24]. Evidence suggests that epigenetic mechanisms may lead to chromatin remodeling and genomic instability via histone status and DNA methylation [25]. In recent years, many natural compounds possessing cancer chemopreventive effects were also shown to elicit epigenetic effects [21]. Dietary phytochemicals have been shown to modify DNA methyltransferases (DNMTs) and histone deacetylases (HDACs), which could contribute to the regulation of epigenetic modification [26]. Hypermethylation of the KEAP1 promoter have been reported to be associated with KEAP1 downregulation and aberrant Nrf2 activation in lung cancer [27]. In our previous studies, dietary phytochemicals activates the Nrf2-ARE pathway, induces demethylation of Nrf2 promoter and decreases protein levels of DNMTs and HDACs [22, 28–30]. Thus, it is important to understand how bioactive dietary components can induce DNA methylation changes and chromatin alterations associated with gene expression [21, 31].
So far, however, there has been little discussion about pelargonidin in the Nrf2 activation associated with skin cells. Mouse skin epidermal JB6 (JB6 P+) cells are sensitive to transformation by tumor-promoting agents such as 12-O-tetradecanoylphorbol-13-acetate (TPA) [28]. By topical application of TPA in vivo onto the skin, TPA can induce oxidative stress, increase ear thickness, weight and inflammatory cytokines [32–34]. Moreover, TPA promotes the expression of oncogene REGγ through the MAPK/p38/AP-1 signaling pathway and protein kinase C (PKC) and activates Wnt/β-catenin pathway, which is important for the initiation and progression of skin carcinogenesis [35]. In our current study, we evaluated whether the pelargonidin can decrease neoplastic transformation caused by TPA in mouse epidermal JB6 P+ cells. We also explored the underlying mechanisms by which pelargonidin exerts its effects against cell transformation, including the Nrf2-ARE pathway and epigenetic modifications.
2. Materials and Methods
2.1. Reagents
Pelargonidin chloride was purchased from Alkemist labs (Costa Mesa, CA, USA). 5-aza-deoxycytidine (5-aza), Eagle’s basal medium, trichostatin A (TSA) and TPA were provided by Sigma-Aldrich (St. Louis, MO, USA). The CellTiter 96® AQueous One Solution Reagent (MTS) and luciferase activity assay kit were provided by Promega (Madison, WI, USA). Primary antibodies specific for actin, Nrf2, NQO1, and HO1 were provided by Santa Cruz Biotechnology (CA, USA). Specific antibodies for HDAC1, HDAC2, HDAC3, HDAC4 and HDAC6, DNMT1, DNMT3a and DNMT3b were provided by Cell Signaling Technology (Beverly, MA, USA). The TOPO TA Cloning Kit was provided by Invitrogen (Invitrogen, USA).
2.2. Cell Culture and Treatment
JB6 P+ cells, HepG2-C8 cells, and JB6 P+ cells transfected with the shMock (wild type) and shNrf2 (knockdown) virus-mediated short hairpin RNAs (shRNAs) were maintained as described in our previous reports [22, 28]. After overnight incubation, the medium was changed to include different concentrations of pelargonidin in MEM supplemented with 1% FBS. Treatment with 250 nmol/L 5-aza (an inhibitor of DNA methyltransferases) and 50 nmol/L TSA (an inhibitor of histone deacetylases) served as positive control. TSA was only added on day 4. DMSO (0.1%) was used as a vehicle control. The treatment agents were changed every other day.
2.3. Cell Viability and Proliferation Assay
First, JB6 P+ cells (3×10³ cells per well) were maintained in 96-well plates for 24 hours. Then, the cells were exposed to either DMSO (0.1%) or pelargonidin (10, 30, 50, 70 and 100 µM) in MEM supplemented with 1% FBS. The cell culture medium containing pelargonidin was changed every other day. To determine cell viability and proliferation, 20 µL of MTS reagent was added to each well of the 96-well plates after 1, 3, or 5 days of treatment. The absorbance at 490 nm was recorded after 1 hour of incubation.
2.4. Cell Cycle Analysis
Briefly, the JB6 P+ cells were incubated in 100-mm dishes with 5% FBS/MEM at a density of 3×10⁵ cells per dish and allowed to adhere via overnight incubation. After treatment with various concentrations of pelargonidin (10, 30, 50, 70 and 100 µM) in 1% FBS for 3 days, the cells were collected and fixed with chilled 66% ethanol. DMSO (0.1%) was used as a vehicle control. The cells were stained by propidium iodide flow cytometry kit (cat no. ab139418, Abcam, Cambridge, MA, USA). The stained cells were further analyzed by Beckman Coulter Gallios Flow Cytometer. The cell cycle distributions were recorded by Gallios software during sample acquisition. Data were analyzed from three parallel experiments.
2.5. Anchorage-independent Cell Transformation Assay
This assay was based on the established TPA-induced neoplastic transformation assay, as described previously [22, 30]. Cells (4×10⁴ cells per well) were pretreated with TPA (20 ng/mL) or TPA plus pelargonidin in 6-well plates for 3 days. Then, the pretreated cell suspension (8,000 cells/well) and 0.66% agar were mixed at a 1:1 ratio. The pretreated cells were incubated with TPA or TPA with different concentrations of pelargonidin in soft agar for an additional 2 weeks. Imaging was performed by a Nikon ACT-1 system, and colonies in soft agar were counted by ImageJ analysis software.
2.6. Luciferase Reporter Activity Assay
HepG2-C8 Cells were established from immortalized HepG2 cell line by transfection with a plasmid containing pARE-TI-luciferase to investigate the potency of pelargonidin in activating the Nrf2 pathway. The HepG2 cells are adherent, epithelial-like cells derived from a liver hepatocellular carcinoma, which are used as a tool for the exploration of cytoprotective, antigenotoxic and cogenotoxic agents [36]. HepG2-C8 cells (1×10⁵ cells per well) were cultured in 12-well plates overnight. Then, the cells were treated with DMSO (0.1%) or different concentrations of pelargonidin for 24 hours. Sulforaphane (SFN) served as a positive control. After the cells in each well were lysed by the reporter lysis buffer, 10µL of cell lysate with 50µL of luciferase assay reagent was analyzed, according to the protocol described in our previous report [28].
2.7. Western Blotting
JB6 P+ cells (3×10⁵ cells per 100-mm dish) were cultured overnight. Then, the cells were incubated with pelargonidin (10, 30 and 50 µM) and 0.1% DMSO (control) in MEM supplemented with 1% FBS. Total protein from the control group and treatment groups was extracted using sonication in RIPA lysis buffer supplemented with a protease inhibitor cocktail, as described previously [22]. Subsequently, the proteins were transferred and detected by antibodies specific for NQO1 (1:1000), HO1 (1:1000), Nrf2 (1:1000), DNMT1 (1:2000), DNMT3a (1:2000), DNMT3b (1:2000), HDAC1 (1:2000), HDAC2 (1:2000), HDAC3 (1:2000), HDAC4 (1:2000), HDAC6 (1:2000) and actin (1:3000). The signal band intensity was calculated using ImageJ software. The relative expression level was calculated based on the intensity of each band normalized to β-actin.
2.8. Quantitative Real-time Polymerase Chain Reaction
Cells (3×10⁵ cells per 100-mm dish) were incubated with pelargonidin (10, 30 and 50 µM), and 0.1% DMSO (control) in MEM containing 1% FBS. RNA was extracted from each group by GeneJET RNA Purification Kits (Thermo Fisher Scientific, Rockford, IL). Then, 1 µg of RNA was used for reverse transcription by Taqman Reverse Transcription Reagents (Thermo Fisher Scientific, Rockford, IL). Gene expression was measured on the transcription level by quantitative real-time PCR on a QuantStudio 5 Real-Time PCR System (Thermo Fisher Scientific, Rockford, IL) and quantified by the ∆∆Ct method. The data from triplicate experiments were subjected to statistical analysis. The primers are listed as follows: Nrf2: 5’-GGCTCAGCACCTTGTATCTT-3’ and 5’-CACATTGCCATCTCTGGTTTG-3’; NQO1: 5’-GAGAAGAGCCCTGATTGTACTG-3’ and 5’-ACCTCCCATCCTCTCTTCTT-3’; GAPDH: 5’-AACAGCAACTCCCACTCTTC-3’ and 5’ -CCTGTTGCTGTAGCCGTATT-3’; and HO-1: 5’-CTCCCTGTGTTTCCTTTCTCTC-3’ and 5’-GCTGCTGGTTTCAAAGTTCAG-3’.
2.9. Bisulfite Genomic Sequencing
This assay was performed based on our previous report [22]. Briefly, JB6 P+ cells (3×10⁵ cells per 100-mm dish) were incubated overnight. Then cells were incubated with pelargonidin (10, 30 and 50 µM), 0.1% DMSO (control) or 5-aza (500 nM) in 1% FBS MEM for 5 days. The 5-aza cotreatment with TSA served as positive control group. TSA (100 nM) was only added on day 4. The combination of 5-aza with TSA could generate greater effects on the cell growth and DNA synthesis than either agent alone [37]. Several reports have shown that TSA also can directly or indirectly affect DNA methylation [38, 39]. Genomic DNA was collected on day 5. Then, the DNA (500 ng) was subjected to bisulfite conversion using the EZ DNA Methylation Gold Kit. The murine Nrf2 promoter sequence from −863 to −1226 was amplified using specific primers. The specific sequences were as follows: sense, 5′-AGTTATGAAGTAGTAGTAAAAA-3′; antisense, 5′-ACCCCAAAAAAATAAATAAATC-3′. Then, the extracted PCR products were cloned into pCR4 TOPO vectors. At least 10 colonies per group from three independent experiments were randomly picked and the sequences were analyzed using T7 primers by Genewiz (South Plainfield, NJ, USA).
2.10. Statistical Analysis
All values are expressed as the mean ± SD of at least three independent replicates. Statistical analysis between groups was performed by Student’s t-test. *, P< 0.05 and **, P< 0.01 were considered to be statistically significant.
3. Results
3.1. Cytotoxicity of Pelargonidin
First, to measure the cytotoxicity of pelargonidin, mouse epidermal JB6 P+ cells were treated with pelargonidin (0, 10, 30, 50, 70 and 100 µM) dissolved in DMSO (vehicle). Cell viability assays were performed on days 1, 3 and 5. Treatment with pelargonidin resulted in time- and dose-dependent effects on cell viability (Fig. 2A). The cell viabilities following pelargonidin (< 50 µM) treatment were above 70% after the 1-day, 3-day and 5-day treatments. Hence, those doses were selected for subsequent experiments.
Fig. 2.

Effects of pelargonidin on cell growth in vitro. (A) Cell viability of JB6 P+ cells after treatment with pelargonidin. (B) Percentage of JB6 P+ cells in different phases of the cell cycle after treatment with pelargonidin (10, 30 and 50 µM) for 3 days. *, P< 0.05 compared to the control group.
3.2. Effects of Pelargonidin on the Cell Cycle
To further investigate the effects of pelargonidin on growth, the cell cycle was measured using flow cytometry. As shown in Fig. 2B, the cell cycle distributions of JB6 P+ cells were not obviously altered by treatment with pelargonidin on day 3. However, the presence of apoptotic nuclei was found, as indicated by increases in the hypodiploid cell population. The sub-G1 phase cells showed a dose-dependent response to pelargonidin treatment (Fig. 2B). The proportion of cells in the sub-G1 phases on day 3 in the control group was 3.75 ± 0.45%, whereas those in the pelargonidin groups (10, 30 and 50 µM) were 6.90 ± 2.96%, 7.98 ± 1.58%, 8.42 ± 0.68%, respectively.
3.3. Pelargonidin Inhibits TPA-induced JB6 P+ Cells Transformation
To determine whether pelargonidin possess chemopreventive and anticancer effects, we examined the effect of pelargonidin on TPA-induced cell transformation in soft agar for two weeks. The TPA treatment group exhibited a 5.8-fold change in transformed cell colonies compared with the control group, indicating that TPA can induce epidermal JB6 P+ cell transformation (Fig. 3). Compared with the TPA treatment group, pelargonidin treatment at various concentrations ranging from 0 to 50 µM, significantly reduced the number of transformed cell colonies (Fig. 3). These data suggest that pelargonidin has the potential to against TPA-induced cell transformation in epidermal JB6 P+ cells.
Fig. 3.

Pelargonidin inhibits TPA-induced cell transformation. (A) Representative images of colony growth in soft agar. (B) The statistical results are presented as the mean ± SD of three independent replicates. **, P< 0.01 indicates significant differences between the treatment and TPA alone groups. Student’s t-test was performed to calculate significant differences.
3.4. Pelargonidin Induces ARE-Luciferase Reporter Activity
We investigated the efficacy of pelargonidin in inducing ARE-luciferase reporter expression in HepG2-C8 cells that were established by transfection with pARE-TI-luciferase to investigate the potency of pelargonidin in activating the Nrf2-ARE pathway. The results showed that pelargonidin induced luciferase expression in a dose-dependent manner, with upregulations of approximately 1.7-fold and 3-fold after pelargonidin treatment (50 and 100 µM, respectively) compared to the control group (Fig. 4). The luciferase activity also increased after treatment with the SFN (10 µM) positive control, as expected. This finding suggests that pelargonidin can reactivate the Nrf2 pathway and subsequently regulate the transcription of antioxidant/detoxification genes.
Fig. 4.

Increase in ARE-luciferase expression in response to pelargonidin in HepG2-C8 cells. Luciferase expression was calculated based on the protein concentrations in each group. The statistical data are presented as the mean ± SD of three independent treatments in HepG2-C8 cells. *, P< 0.05 and **, P< 0.01, compared to the control group.
3.5. Pelargonidin Increases the Gene Expression of Nrf2 Target Genes
Next, to further evaluate the ability of pelargonidin to reactivate Nrf2 and its downstream genes, qPCR and western blotting were performed in JB6 P+ cells. Our results show that the mRNA expression levels of HO-1 and NQO1 increased in a dose-dependent manner when the cells were treated with pelargonidin for 6 hours (Fig. 5A) and5 days (Fig. 5B). In addition, pelargonidin significantly elevated the protein levels of the Nrf2 target genes HO-1 and NQO1 after 5 days of treatment. Together, these findings suggest that pelargonidin has the ability to increase the Nrf2 downstream genes expression in JB6 P+ cells.
Fig. 5.

Effect of pelargonidin on the expression of Nrf2 and its target genes in JB6 P+ cells. Pelargonidin significantly promoted the mRNA expression of HO-1 and NQO1 after 6 hours (A) and 5 days of treatment (B). (C) Protein levels of Nrf2, NQO1, β-actin and HO-1 after 5 days of treatment with various concentrations of pelargonidin were determined by immunoblot analyses. (D) The relative expression level was calculated based on the intensity of each band normalized to β-actin. The statistical data are presented as the mean ± SD of three independent experiments. *, P< 0.05 compared to the control group.
3.6. The Knockdown of Nrf2 Reduces Resistance to TPA-induced Colony Formation
To test the impact of Nrf2 on TPA-induced anchorage-independent growth, shMock and shNrf2 JB6 P+ cell lines were used, as described in our previous reports [22, 28]. The results showed that treatment with pelargonidin suppressed colony formation in both shMock and shNrf2 JB6 P+ cells (Fig. 6). Compared to shMock cells, knockdown Nrf2 in shNrf2 JB6 P+ cells enhanced TPA-induced colony formation and attenuated pelargonidin’s blocking effect. As shown in Fig. 6, pelargonidin at concentrations of 0, 10, 30, and 50 µM reduced the colony formation frequency of shMock cells to 6.3%, 5.3%, 4.4% and 1.6%, respectively. Compared to shMock cells, pelargonidin at a concentration of 50 µM mediated an inhibitory effect on the colony formation frequency of shNrf2 cells, with an increase from 1.6% to 4.2% (Fig. 6). These findings demonstrate that Nrf2 plays an important role in the preventive effect of pelargonidin on TPA-induced colony formation.
Fig. 6.

Inhibitory effects of pelargonidin on the cell transformation of stably transfected shNrf2 and shMock JB6 P+ cells. (A) Representative images of colony growth in soft agar. (B) The incidence of cell transformation was decreased during pelargonidin treatment. The transformation frequency data are presented as the mean ± SD of three independent replicates. *, P< 0.01 indicates significant differences between the shNrf2 and shMock groups. Student’s t-test was performed to calculate significant differences.
3.7. Pelargonidin Decreases DNA Methylation of the Nrf2 Promoter
To examine whether the Nrf2 promoter was epigenetically modified by pelargonidin in JB6 P+ cells, we explored the DNA methylation status of the mouse Nrf2 promoter located from−1226 to−863 by bisulfite genomic DNA sequencing, as previously reported [22, 30]. Bisulfite genomic sequencing showed that the proportion of methylated CpG sites significantly decreased after treatment with pelargonidin. As shown in Fig. 7, 88.5 ± 6.6% of sites in the promoter of Nrf2 were methylated in the control group. However, after treatment with 10 µM, 30 µM and 50 µM pelargonidin for 5 days, the proportion of methylated sites was reduced to 85.6 ± 2.0%, 83.6 ± 2.7%, and 76.5 ± 4.1%, respectively. The cells treated with the combination of 5-aza (an inhibitor of DNA methyltransferases) and TSA (an inhibitor of histone deacetylases), had a decreased DNA methylation rate of 70.0 ± 5.7% (Fig. 7), which is similar to that described in our previous report [29]. This finding suggests that pelargonidin can decrease the DNA methylation rate in the Nrf2 promoter region.
Fig. 7.

Pelargonidin decreases DNA methylation of the Nrf2 promoter region. DNA was extracted from pelargonidin- and 5-aza/TSA-treated JB6 P+ cells after 5 days. The methylation level at the 15 CpG sites (located between −1226 and −863 relative to the transcriptional start site) in the Nrf2 promoter region was determined by bisulfite genomic sequencing. Black spots indicate methylated CpGs, and hollow dots indicate unmethylated CpGs. At least 10 clones from each group were sequenced using T7 primers. The data are shown as the percentage of methylated cytosines among a total of 15 CpGs from three individual experiments.
3.8. Pelargonidin Decreases Protein Levels of DNMTs and HDACs
To explore the potential molecular epigenetic mechanisms by which pelargonidin reduced DNA methylation in the Nrf2 promoter, we further measured the effects of pelargonidin on protein levels of DNMTs and HDACs. Treatment with pelargonidin caused a significant decrease in DNMT1 and DNMT3b expression in JB6 P+ cells (Fig. 8A). DNMT3a protein levels were not significantly affected by pelargonidin treatment. Since, gene expression can be affected or modified by histone de-acetylation and acetylation, Wang et al [40] reported that histone deacetylase inhibitor TSA could induce acetylation of Nrf2 and activates transcription factor Nrf2, although may or may not affect CpG methylation per se. Here, we observed that the levels of HDACs were also decreased by pelargonidin treatment (Fig. 8B). Among the HDACs, the levels of HDAC1, HDAC2, HDAC3, HDAC4, and HDAC7 were significantly reduced by pelargonidin treatment. This finding suggests that pelargonidin can decrease protein levels of DNMTs and HDACs, which may potentially contribute to the DNA demethylation of the Nrf2 promoter region.
Fig. 8.

Effect of pelargonidin on protein levels of DNMTs and HDACs in JB6 P+ cells. (A) The protein levels of DNMT1, DNMT3a and DNMT3b after 5 days of treatment with various concentrations of pelargonidin was determined by immunoblot analyses. (B) The protein levels of HDAC1, HDAC2, HDAC3, HDAC4 and HDAC7 after 5 days of treatment with various concentrations of pelargonidin was determined by immunoblot analyses. The statistical data are presented as the mean ± SD of three independent experiments. *, P< 0.05 compared to the control group.
4. Discussion
Numerous studies have reported that bioactive dietary components with therapeutic potential exert effects in disease prevention by immunomodulation [41], epigenetic modifications [26, 42], cellular metabolism [43], inhibition of inflammation and cell cycle alterations [44]. Recently, anthocyanidins, which are pigments in fruits and vegetables, have received increased attention because they exhibit tumor cell proliferation inhibitory activity [45, 46]. Pelargonidin, cyanidin, malvidin, delphinidin, peonidin, and petunidin all belong to the bioflavonoid anthocyanidins [47]. Pelargonidin, the most abundant anthocyanidin found in strawberries and radish, has multiple protective effects against many diseases by preventing or decreasing inflammation and oxidative stress [8, 9]. Here, we showed that pelargonidin can reduce cell transformation caused by TPA in epidermal cells in vitro. Furthermore, the possible molecular mechanisms for the ability of pelargonidin against transformation can be attributed to its activity in the Nrf2-ARE signaling pathway through demethylation of Nrf2 promoter and its cytoprotective effect.
The ROS produced by oxidative stress could destroy cellular components and subsequently impact cell apoptosis and proliferation, invasiveness and metastasis [48, 49]. Fruits and vegetables that are rich in antioxidants can help reduce the harm induced by excess ROS [50]. Nrf2 and its interaction with AREs increase the transcription of phase II detoxifying/antioxidant enzymes, such as superoxide dismutase (SOD), HO-1, and NQO1, which are indispensable for preventing oxidative stress and cancer initiation [51, 52]. We demonstrate that treatment with pelargonidin increases ARE-luciferase expression in HepG2-C8 cells stably transfected with the ARE-luciferase reporter gene. In addition, pelargonidin promoted the mRNA and protein levels of HO-1 and NQO1 after 6 hours and 5 days of treatment. TPA has often been employed as an inducer for endogenous superoxide production and as a potent skin carcinogenesis promoter and is routinely used to activate the signal transduction enzyme protein kinase C in biomedical studies [53–55]. We observed that colony formation induced by TPA was suppressed by pelargonidin treatment. Furthermore, our previous studies indicated that expressing the antioxidant genes HO-1 and NQO1 by reactivation of the Nrf2 pathway appeared to be important for the reduction of TPA-induced cell transformation [22, 28, 56]. To further demonstrate the function of Nrf2 in cell transformation, we generated Nrf2 knockdown JB6 P+ cell lines by virus-mediated short hairpin RNAs. The inhibition of colony growth in soft agar by pelargonidin treatment was attenuated through the ablation of Nrf2 expression in JB6 P+ shNrf2 cells. In the absence of Nrf2, pelogonidin, may not able to activate some of the Nrf2 pathway genes and therefore, may not be able to block of some the TPA-induced ROS/inflammatory driven cellular transformation machinery.
Genomic hypermethylation of DNA within CpG islands is observed in cancers [57, 58]. Many dietary components have exhibited important effects in regulating these epigenetic modifications [59]. Bioactive natural compounds with chemoprevention activities mediated by epigenetic regulation are regarded as potential therapeutic drugs against human disease. This evidence is also consistent with our previous observations, which showed that bioactive natural compounds reduced the methylation of the CpGs of Nrf2 compared with that of the control group [22, 28, 30]. In this study, our study also showed that pelargonidin reduced the DNA methylation of the Nrf2 promoter region in the first 15 CpG sites (Fig. 7). Compared with the control, 50 µM pelargonidin decreased DNA methylation, similar to the positive control 5-aza+TSA, which significantly reduced the methylation of CpG sites, as expected, suggesting that activation of the Nrf2-ARE signaling pathway is associated with the demethylation of CpG sites. Enzymes in the DNA methyltransferase family, including DNMT1, DNMT3A, and DNMT3B, catalyze the transfer of a methyl group to DNA at the 5′ position of the cytosine residue within CpG dinucleotides [60]. We observed that pelargonidin can decrease the expression of DNMT1 and DNMT3b (Fig. 8). Furthermore, we also observed that the protein levels of the histone deacetylases HDAC1, HDAC2, HDAC3, HDAC4 and HDAC7 were significantly reduced by pelargonidin treatment in a dose-dependent manner (Fig. 8). HDAC inhibitors have been reported as potential anticancer drugs previously [61]. Our results revealed that the antioxidant effects of pelargonidin are closely correlated with its ability to decrease protein levels of DNMTs and HDACs, which is the key link to DNA demethylation in the Nrf2 promoter region.
In conclusion, our results show that pelargonidin can inhibit neoplastic transformation caused by TPA in skin epidermal cells. Moreover, the possible molecular mechanisms of the chemopreventive effects of pelargonidin against neoplastic transformation can be attributed to activation of the Nrf2-ARE defense pathway through demethylation of Nrf2 promoter and its cytoprotective effect.
Highlights.
Anthocyanin pelargonidin attenuates colony formation of JB6 mouse epidermal cells
Pelargonidin transcriptionally activates the antioxidant response element (ARE)
Pelargonidin enhances Nrf2-mediated antioxidant gene expression
Knockdown of Nrf2 attenuates blocking effect of pelargonidin on colony formation
Pelargonidin epigenetically decreases the DNA CpG methylation of Nrf2 promoter
Acknowledgments
This study was supported by R01AT009152 from the National Center for Complementary & Alternative Medicine (NCCAM) and R01CA200129 from the National Cancer Institute (NCI). The authors appreciate all the members of Dr. Kong’s laboratory for their invaluable support and technical assistance.
Abbreviations
- TPA
12-O-tetradecanoylphorbol-13-acetate
- ARE
anti-oxidant response element
- Nrf2
nuclear factor E2-related factor 2
- DNMTs
DNA methyltransferases
- HDACs
histone deacetylases
- HO-1
heme oxygenase-1
- NQO1
NAD(P)H/quinone oxidoreductase 1
- KEAP1
Kelch like-ECH-associated protein 1
- SOD
superoxide dismutase
- ROS
reactive oxygen species
Footnotes
Publisher's Disclaimer: This is a PDF file of an unedited manuscript that has been accepted for publication. As a service to our customers we are providing this early version of the manuscript. The manuscript will undergo copyediting, typesetting, and review of the resulting proof before it is published in its final citable form. Please note that during the production process errors may be discovered which could affect the content, and all legal disclaimers that apply to the journal pertain.
Conflicts of Interest
The authors have no potential conflicts of interest to disclose.
Declaration of interests
The authors declare that they have no known competing financial interests or personal relationships that could have appeared to influence the work reported in this paper.
References
- [1].Olas B. Berry Phenolic Antioxidants - Implications for Human Health? Frontiers in pharmacology 2018;9:78. [DOI] [PMC free article] [PubMed] [Google Scholar]
- [2].Wang LS, Sun XD, Cao Y, Wang L, Li FJ, Wang YF. Antioxidant and pro-oxidant properties of acylated pelargonidin derivatives extracted from red radish (Raphanus sativus var. niger, Brassicaceae). Food and chemical toxicology : an international journal published for the British Industrial Biological Research Association 2010;48:2712–8. [DOI] [PubMed] [Google Scholar]
- [3].Mazza G. Compositional and functional properties of saskatoon berry and blueberry. International journal of fruit science 2005;5:101–20. [Google Scholar]
- [4].Zheng W, Wang SY. Oxygen radical absorbing capacity of phenolics in blueberries, cranberries, chokeberries, and lingonberries. Journal of agricultural and food chemistry 2003;51:502–9. [DOI] [PubMed] [Google Scholar]
- [5].Giampieri F, Forbes-Hernandez TY, Gasparrini M, Alvarez-Suarez JM, Afrin S, Bompadre S, et al. Strawberry as a health promoter: an evidence based review. Food Funct 2015;6:1386–98. [DOI] [PubMed] [Google Scholar]
- [6].Noda Y, Kaneyuki T, Mori A, Packer L. Antioxidant activities of pomegranate fruit extract and its anthocyanidins: delphinidin, cyanidin, and pelargonidin. Journal of agricultural and food chemistry 2002;50:166–71. [DOI] [PubMed] [Google Scholar]
- [7].Lin LZ, Harnly JM, Pastor-Corrales MS, Luthria DL. The polyphenolic profiles of common bean (Phaseolus vulgaris L.). Food chemistry 2008;107:399–410. [DOI] [PMC free article] [PubMed] [Google Scholar]
- [8].Sharath Babu GR, Anand T, Ilaiyaraja N, Khanum F, Gopalan N. Pelargonidin Modulates Keap1/Nrf2 Pathway Gene Expression and Ameliorates Citrinin-Induced Oxidative Stress in HepG2 Cells. Frontiers in pharmacology 2017;8:868. [DOI] [PMC free article] [PubMed] [Google Scholar]
- [9].Lee IC, Bae JS. Suppressive effects of pelargonidin on PolyPhosphate-mediated vascular inflammatory responses. Archives of pharmacal research 2017;40:258–67. [DOI] [PubMed] [Google Scholar]
- [10].Ku SK, Yoon EK, Lee W, Kwon S, Lee T, Bae JS. Antithrombotic and antiplatelet activities of pelargonidin in vivo and in vitro. Archives of pharmacal research 2016;39:398–408. [DOI] [PubMed] [Google Scholar]
- [11].Mirshekar M, Roghani M, Khalili M, Baluchnejadmojarad T, Arab Moazzen S. Chronic oral pelargonidin alleviates streptozotocin-induced diabetic neuropathic hyperalgesia in rat: involvement of oxidative stress. Iranian biomedical journal 2010;14:33–9. [PMC free article] [PubMed] [Google Scholar]
- [12].Moi P, Chan K, Asunis I, Cao A, Kan YW. Isolation of NF-E2-related factor 2 (Nrf2), a NF-E2-like basic leucine zipper transcriptional activator that binds to the tandem NF-E2/AP1 repeat of the beta-globin locus control region. Proceedings of the National Academy of Sciences of the United States of America 1994;91:9926–30. [DOI] [PMC free article] [PubMed] [Google Scholar]
- [13].Nguyen T, Nioi P, Pickett CB. The Nrf2-antioxidant response element signaling pathway and its activation by oxidative stress. Journal of Biological Chemistry 2009;284:13291–5. [DOI] [PMC free article] [PubMed] [Google Scholar]
- [14].Hennig P, Garstkiewicz M, Grossi S, Di Filippo M, French LE, Beer HD. The Crosstalk between Nrf2 and Inflammasomes. International Journal of Molecular Sciences 2018;19. [DOI] [PMC free article] [PubMed]
- [15].Taguchi K, Yamamoto M. The KEAP1–NRF2 system in cancer. Frontiers in oncology 2017;7:85. [DOI] [PMC free article] [PubMed] [Google Scholar]
- [16].de la Vega MR, Chapman E, Zhang DD. NRF2 and the hallmarks of cancer. Cancer cell 2018. [DOI] [PMC free article] [PubMed]
- [17].Iida K, Itoh K, Kumagai Y, Oyasu R, Hattori K, Kawai K, et al. Nrf2 is essential for the chemopreventive efficacy of oltipraz against urinary bladder carcinogenesis. Cancer research 2004;64:6424–31. [DOI] [PubMed] [Google Scholar]
- [18].Saw CL, Huang MT, Liu Y, Khor TO, Conney AH, Kong AN. Impact of Nrf2 on UVB‐induced skin inflammation/photoprotection and photoprotective effect of sulforaphane. Molecular carcinogenesis 2011;50:479–86. [DOI] [PubMed] [Google Scholar]
- [19].Li W, Guo Y, Zhang C, Wu R, Yang AY, Gaspar J, et al. Dietary Phytochemicals and Cancer Chemoprevention: A Perspective on Oxidative Stress, Inflammation, and Epigenetics. Chemical research in toxicology 2016;29:2071–95. [DOI] [PubMed] [Google Scholar]
- [20].Esteller M. Relevance of DNA methylation in the management of cancer. The Lancet Oncology 2003;4:351–8. [DOI] [PubMed] [Google Scholar]
- [21].Hardy TM, Tollefsbol TO. Epigenetic diet: impact on the epigenome and cancer. Epigenomics 2011;3:503–18. [DOI] [PMC free article] [PubMed] [Google Scholar]
- [22].Su ZY, Zhang C, Lee JH, Shu L, Wu TY, Khor TO, et al. Requirement and epigenetics reprogramming of Nrf2 in suppression of tumor promoter TPA-induced mouse skin cell transformation by sulforaphane. Cancer prevention research (Philadelphia, Pa) 2014;7:319–29. [DOI] [PubMed] [Google Scholar]
- [23].Yu S, Khor TO, Cheung KL, Li W, Wu TY, Huang Y, et al. Nrf2 expression is regulated by epigenetic mechanisms in prostate cancer of TRAMP mice. PloS one 2010;5:e8579. [DOI] [PMC free article] [PubMed] [Google Scholar]
- [24].Egger G, Liang G, Aparicio A, Jones PA. Epigenetics in human disease and prospects for epigenetic therapy. Nature 2004;429:457–63. [DOI] [PubMed] [Google Scholar]
- [25].Rajendran P, Ho E, Williams DE, Dashwood RH. Dietary phytochemicals, HDAC inhibition, and DNA damage/repair defects in cancer cells. Clinical epigenetics 2011;3:4. [DOI] [PMC free article] [PubMed] [Google Scholar]
- [26].Shukla S, Meeran SM, Katiyar SK. Epigenetic regulation by selected dietary phytochemicals in cancer chemoprevention. Cancer letters 2014;355:9–17. [DOI] [PMC free article] [PubMed] [Google Scholar]
- [27].Wang R, An J, Ji F, Jiao H, Sun H, Zhou D. Hypermethylation of the Keap1 gene in human lung cancer cell lines and lung cancer tissues. Biochemical and biophysical research communications 2008;373:151–4. [DOI] [PubMed] [Google Scholar]
- [28].Yang Y, Yang I, Cao M, Su ZY, Wu R, Guo Y, et al. Fucoxanthin Elicits Epigenetic Modifications, Nrf2 Activation and Blocking Transformation in Mouse Skin JB6 P+ Cells. The AAPS journal 2018;20:32. [DOI] [PMC free article] [PubMed] [Google Scholar]
- [29].Paredes-Gonzalez X, Fuentes F, Su ZY, Kong AN. Apigenin reactivates Nrf2 anti-oxidative stress signaling in mouse skin epidermal JB6 P + cells through epigenetics modifications. The AAPS journal 2014;16:727–35. [DOI] [PMC free article] [PubMed] [Google Scholar]
- [30].Kim H, Ramirez CN, Su ZY, Kong AN. Epigenetic modifications of triterpenoid ursolic acid in activating Nrf2 and blocking cellular transformation of mouse epidermal cells. The Journal of nutritional biochemistry 2016;33:54–62. [DOI] [PMC free article] [PubMed] [Google Scholar]
- [31].Fernandes GFS, Silva GDB, Pavan AR, Chiba DE, Chin CM, Dos Santos JL. Epigenetic Regulatory Mechanisms Induced by Resveratrol. Nutrients 2017;9. [DOI] [PMC free article] [PubMed] [Google Scholar]
- [32].Kulkarni NM, Muley MM, Jaji MS, Vijaykanth G, Raghul J, Reddy NKD, et al. Topical atorvastatin ameliorates 12-O-tetradecanoylphorbol-13-acetate induced skin inflammation by reducing cutaneous cytokine levels and NF-κB activation. Archives of pharmacal research 2015;38:1238–47. [DOI] [PubMed] [Google Scholar]
- [33].Bralley EE, Greenspan P, Hargrove JL, Wicker L, Hartle DK. Topical anti-inflammatory activity of Polygonum cuspidatum extract in the TPA model of mouse ear inflammation. Journal of Inflammation 2008;5:1. [DOI] [PMC free article] [PubMed] [Google Scholar]
- [34].Khan AQ, Khan R, Rehman MU, Lateef A, Tahir M, Ali F, et al. Soy isoflavones (daidzein & genistein) inhibit 12-O-tetradecanoylphorbol-13-acetate (TPA)-induced cutaneous inflammation via modulation of COX-2 and NF-κB in Swiss albino mice. Toxicology 2012;302:266–74. [DOI] [PubMed] [Google Scholar]
- [35].Li L, Dang Y, Zhang J, Yan W, Zhai W, Chen H, et al. REGγ is critical for skin carcinogenesis by modulating the Wnt/β-catenin pathway. Nature communications 2015;6:6875. [DOI] [PubMed] [Google Scholar]
- [36].Mersch-Sundermann V, Knasmüller S, Wu X-j, Darroudi F, Kassie F. Use of a human-derived liver cell line for the detection of cytoprotective, antigenotoxic and cogenotoxic agents. Toxicology 2004;198:329–40. [DOI] [PubMed] [Google Scholar]
- [37].Shaker S, Bernstein M, Momparler LF, Momparler RL. Preclinical evaluation of antineoplastic activity of inhibitors of DNA methylation (5-aza-2′-deoxycytidine) and histone deacetylation (trichostatin A, depsipeptide) in combination against myeloid leukemic cells. Leukemia research 2003;27:437–44. [DOI] [PubMed] [Google Scholar]
- [38].Selker EU. Trichostatin A causes selective loss of DNA methylation in Neurospora. Proceedings of the National Academy of Sciences 1998;95:9430–5. [DOI] [PMC free article] [PubMed] [Google Scholar]
- [39].Ou J-N, Torrisani J, Unterberger A, Provençal N, Shikimi K, Karimi M, et al. Histone deacetylase inhibitor Trichostatin A induces global and gene-specific DNA demethylation in human cancer cell lines. Biochemical pharmacology 2007;73:1297–307. [DOI] [PubMed] [Google Scholar]
- [40].Wang B, Zhu X, Kim Y, Li J, Huang S, Saleem S, et al. Histone deacetylase inhibition activates transcription factor Nrf2 and protects against cerebral ischemic damage. Free Radical Biology and Medicine 2012;52:928–36. [DOI] [PMC free article] [PubMed] [Google Scholar]
- [41].Mollazadeh H, Cicero AF, Blesso CN, Pirro M, Majeed M, Sahebkar A. Immune modulation by curcumin: The role of interleukin-10. Critical reviews in food science and nutrition 2017:1–13. [DOI] [PubMed]
- [42].Meeran SM, Ahmed A, Tollefsbol TO. Epigenetic targets of bioactive dietary components for cancer prevention and therapy. Clinical epigenetics 2010;1:101. [DOI] [PMC free article] [PubMed] [Google Scholar]
- [43].Cerella C, Radogna F, Dicato M, Diederich M. Natural compounds as regulators of the cancer cell metabolism. International journal of cell biology 2013;2013. [DOI] [PMC free article] [PubMed]
- [44].Nosrati N, Bakovic M, Paliyath G. Molecular mechanisms and pathways as targets for cancer prevention and progression with dietary compounds. International Journal of Molecular Sciences 2017;18:2050. [DOI] [PMC free article] [PubMed] [Google Scholar]
- [45].Zhang Y, Vareed SK, Nair MG. Human tumor cell growth inhibition by nontoxic anthocyanidins, the pigments in fruits and vegetables. Life sciences 2005;76:1465–72. [DOI] [PubMed] [Google Scholar]
- [46].Wang L-S, Stoner GD. Anthocyanins and their role in cancer prevention. Cancer letters 2008;269:281–90. [DOI] [PMC free article] [PubMed] [Google Scholar]
- [47].Rozanska D, Regulska-Ilow B. The significance of anthocyanins in the prevention and treatment of type 2 diabetes. Advances in clinical and experimental medicine : official organ Wroclaw Medical University 2018;27:135–42. [DOI] [PubMed] [Google Scholar]
- [48].Halliwell B. Oxidative stress and cancer: have we moved forward? The Biochemical journal 2007;401:1–11. [DOI] [PubMed] [Google Scholar]
- [49].Waris G, Ahsan H. Reactive oxygen species: role in the development of cancer and various chronic conditions. Journal of carcinogenesis 2006;5:14. [DOI] [PMC free article] [PubMed] [Google Scholar]
- [50].Seifried HE, Anderson DE, Fisher EI, Milner JA. A review of the interaction among dietary antioxidants and reactive oxygen species. The Journal of nutritional biochemistry 2007;18:567–79. [DOI] [PubMed] [Google Scholar]
- [51].Hu R, Saw CL, Yu R, Kong AN. Regulation of NF-E2-related factor 2 signaling for cancer chemoprevention: antioxidant coupled with antiinflammatory. Antioxidants & redox signaling 2010;13:1679–98. [DOI] [PMC free article] [PubMed] [Google Scholar]
- [52].Rojo de la Vega M, Chapman E, Zhang DD. NRF2 and the Hallmarks of Cancer. Cancer cell 2018. [DOI] [PMC free article] [PubMed]
- [53].Huang R, Zhao L, Chen H, Yin RH, Li CY, Zhan YQ, et al. Megakaryocytic differentiation of K562 cells induced by PMA reduced the activity of respiratory chain complex IV. PloS one 2014;9:e96246. [DOI] [PMC free article] [PubMed] [Google Scholar]
- [54].Fukushima K, Takahashi K, Fukushima N, Honoki K, Tsujiuchi T. Different effects of GPR120 and GPR40 on cellular functions stimulated by 12-O-tetradecanoylphorbol-13-acetate in melanoma cells. Biochemical and biophysical research communications 2016;475:25–30. [DOI] [PubMed] [Google Scholar]
- [55].Lii CK, Chang JW, Chen JJ, Chen HW, Liu KL, Yeh SL, et al. Docosahexaenoic acid inhibits 12-O-tetradecanoylphorbol-13-acetate-induced fascin-1-dependent breast cancer cell migration by suppressing the PKCdelta- and Wnt-1/beta-catenin-mediated pathways. Oncotarget 2016;7:25162–79. [DOI] [PMC free article] [PubMed] [Google Scholar]
- [56].Wang L, Zhang C, Guo Y, Su ZY, Yang Y, Shu L, et al. Blocking of JB6 cell transformation by tanshinone IIA: epigenetic reactivation of Nrf2 antioxidative stress pathway. The AAPS journal 2014;16:1214–25. [DOI] [PMC free article] [PubMed] [Google Scholar]
- [57].Bostick M, Kim JK, Estève P-O, Clark A, Pradhan S, Jacobsen SE. UHRF1 plays a role in maintaining DNA methylation in mammalian cells. Science 2007;317:1760–4. [DOI] [PubMed] [Google Scholar]
- [58].Ehrlich M. DNA methylation in cancer: too much, but also too little. Oncogene 2002;21:5400. [DOI] [PubMed] [Google Scholar]
- [59].Link A, Balaguer F, Goel A. Cancer chemoprevention by dietary polyphenols: promising role for epigenetics. Biochemical pharmacology 2010;80:1771–92. [DOI] [PMC free article] [PubMed] [Google Scholar]
- [60].Bird A. DNA methylation patterns and epigenetic memory. Genes & development 2002;16:6–21. [DOI] [PubMed] [Google Scholar]
- [61].Korfei M, Stelmaszek D, Skwarna S, Chillappagari S, Bach A, MacKenzie B, et al. Comparison of the Antifibrotic Efficacy of the Pan-Histone Deacetylase-Inhibitor Panobinostat Versus the IPF-Drug Pirfenidone in Fibroblasts from Patients with Idiopathic Pulmonary Fibrosis. C72 PULMONARY FIBROSIS: MECHANISMS AND MODELS: American Thoracic Society; 2018. p. A5751-A. [DOI] [PMC free article] [PubMed]