Abstract
Generalized Read-Across (GenRA) is a data driven approach which makes read-across predictions on the basis of a similarity weighted activity of source analogues (nearest neighbors). GenRA has been described in more detail in the literature (Shah et al., 2016; Helman et al., 2018). Here we present its implementation within the EPA’s CompTox Chemicals Dashboard to provide public access to a GenRA module structured as a read-across workflow. GenRA assists researchers in identifying source analogues, evaluating their validity and making predictions of in vivo toxicity effects for a target substance. Predictions are presented as binary outcomes reflecting presence or absence of toxicity together with quantitative measures of uncertainty. The approach allows users to identify analogues in different ways, quickly assess the availability of relevant in vivo data for those analogues and visualize these in a data matrix to evaluate the consistency and concordance of the available experimental data for those analogues before making a GenRA prediction. Predictions can be exported into a tab-separated value (TSV) or Excel file for additional review and analysis (e.g., doses of analogues associated with production of toxic effects). GenRA offers a new capability of making reproducible read-across predictions in an easy-to use-interface.
Keywords: Read-Across, Generalised Read-Across (GenRA), EPA CompTox Dashboard
Introduction
Given the thousands of data-poor or toxicologically uncharacterized chemicals in commerce, read-across has proved to be a convenient and efficient data gap filling technique that can be used within analogue and category approaches for many different regulatory purposes. Read-across represents the application of data from a source chemical(s) for a particular property or effect to predict the same property or effect for the target chemical (the chemical of interest) (OECD, 2014). Read-across is traditionally anchored with conventional in vivo and in vitro data, though concerted efforts are starting to be made to exploit high throughput (HT) and high content (HC) screening data as a means of substantiating biological similarity (Zhu et al., 2016; Shah et al., 2016). Some of these efforts are anchoring such data to key events within adverse outcome pathways (AOPs) (Schultz and Cronin, 2017).
Here we present the web-based implementation of Generalized Read-across (GenRA), a data-driven approach which makes reproducible read-across predictions of toxicity outcomes from in vivo studies (Shah et al., 2016). The read-across prediction is a similarity weighted activity of source analogues (nearest neighbors) based on chemistry and/or bioactivity descriptors. The approach is a generalization of the Chemical Biological Read-Across (CBRA) approach published by Low et al (2013). GenRA has been described in more detail in the literature (Shah et al., 2016; Helman et al., 2018). Here we outline the principles of the approach and its workflow implementation in the EPA CompTox Chemicals Dashboard (Williams et al., 2017; https://comptox.epa.gov/dashboard).
Materials and Methods
The GenRA framework has been implemented using a classical three tier architecture, which is seamlessly embedded in the EPA CompTox Chemicals Dashboard, and includes: 1) a web-based presentation tier; 2) an application tier based on representational state transfer (REST) web services; and 3) a data tier for storing large-scale chemical, bioactivity, and toxicity data for thousands of chemicals. The presentation tier of GenRA is implemented using Vue (http://vuejs.org) and each step in the workflow is designed as a self-contained component. Each component intuitively captures the key tasks that must be performed in the workflow via a combination of inputs (i.e. buttons, input items, etc.) and an interactive graphical output. All graphical outputs of the individual components are implemented as scalable vector graphic (SVG) elements with context sensitive help information and/or interaction capabilities. The presentation layer components in GenRA perform their specific tasks by obtaining information about chemicals, analogues, bioactivity and toxicity from the application tier. The application tier is implemented in Python (https://www.python.org/) using the Flask (http://flask.pocoo.org/) microservices framework, which is deployed using Apache/wsgi (https://www.python.org/dev/peps/pep-3333/). The data tier is implemented using MongoDB (https://www.mongodb.com/), which is a document-oriented NoSQL database. Information about chemicals, bioactivity and toxicity is stored as separate MongoDB collections to facilitate the efficient implementation of GenRA algorithms. Chemical structure data were obtained from the Distributed Structure Searchable Toxicity (DSSTox) database (originally extracted April 2017 but updated continuously) (Richard et al., 2016; https://www.epa.gov/chemical-research/distributed-structure-searchable-toxicity-dsstox-database) whereas chemical descriptors, comprising Morgan fingerprints (Rogers and Hahn, 2010) and topological torsion descriptors (Nilakantan et al., 1987) were generated using RDKit (http://www.rdkit.org/). ToxPrint chemotypes1 were generated using the AM-MN Chemotyper for command line operation (Yang et al., 2015; chemotyper.org).
The bioactivity High Throughput Screening (HTS) data were obtained from the ToxCast (https://www.epa.gov/chemical-research/toxicity-forecasting) and Tox21 (https://www.epa.gov/chemical-research/toxicology-testing-21st-century-tox21) programs. The in vivo toxicity data was obtained from ToxRefDB v.1.0 (ftp://newftp.epa.gov/COMPTOX/High_Throughput_Screening_Data/Animal_Tox_Data/readme_toxrefdb_20141106.pdf).
Bioactivity descriptors (denoted biology or bio) comprised hit calls (Active (1) and Inactive (0)) from 820 ToxCast HTS assays. The 820 bioactivity descriptors were converted into fingerprints that are used singly (chm or bio to denote either chemical or bioactivity descriptors) to predict up to 129 toxicity outcomes from 10 different study types from ToxRefDB v1.0. The study types are namely Acute (ACU), Subacute (Sub), Subchronic (SAC), Neurotoxicity (NEU), Developmental neurotoxicity (DNT), Developmental toxicity (DEV), Reproductive toxicity (REP), and Multigenerational toxicity (MGR). A final category of Other (OTH) is for any study not fitting any of the previously mentioned study types.
Results and Discussion
There are several steps in the development of a category or analogue approach (Patlewicz et al., 2017, 2018). The seven key steps in the workflow are as follows:
Decision context
Data gap analysis
Overarching similarity rationale
Analogue identification
Analogue evaluation
Data gap filling
Uncertainty assessment
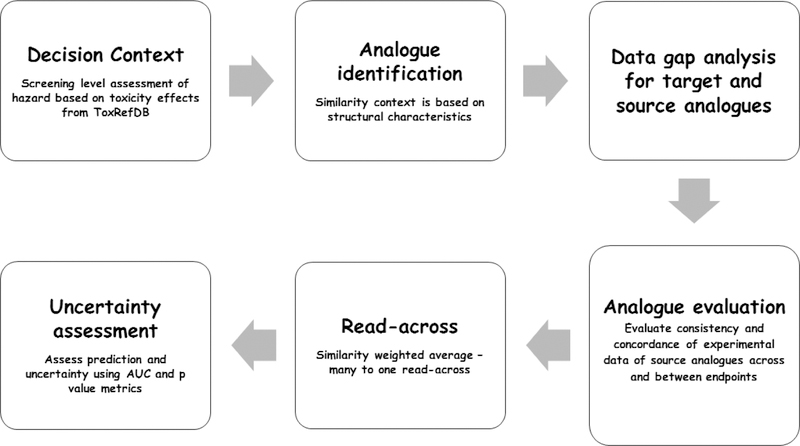
In the GenRA implementation, the steps have been addressed as shown in Figure 1 (Helman et al., 2018).
Figure 1.
Category/Analogue workflow and GenRA
This figure has been reproduced with permission from Helman et al., 2018
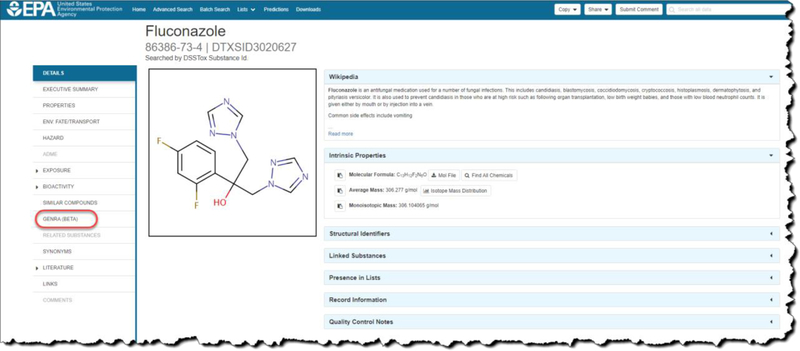
The starting point for GenRA relies on identifying the chemical of interest (target chemical) by performing a ‘basic’ search within the EPA CompTox Dashboard. The outcome of a search gives rise to a ‘chemical details’ landing page with a number of selectable tabs and sub-tabs to the left of the screen (Figure 2). One of the tabs navigates to the GenRA module.
Figure 2.
Chemical Results page for example substance Fluconazole
Once GenRA is selected, a grid like display is presented with an indicator at the top of the page that reflects the relevant step in the read-across workflow. Users can navigate between steps by clicking on the indicator bar.
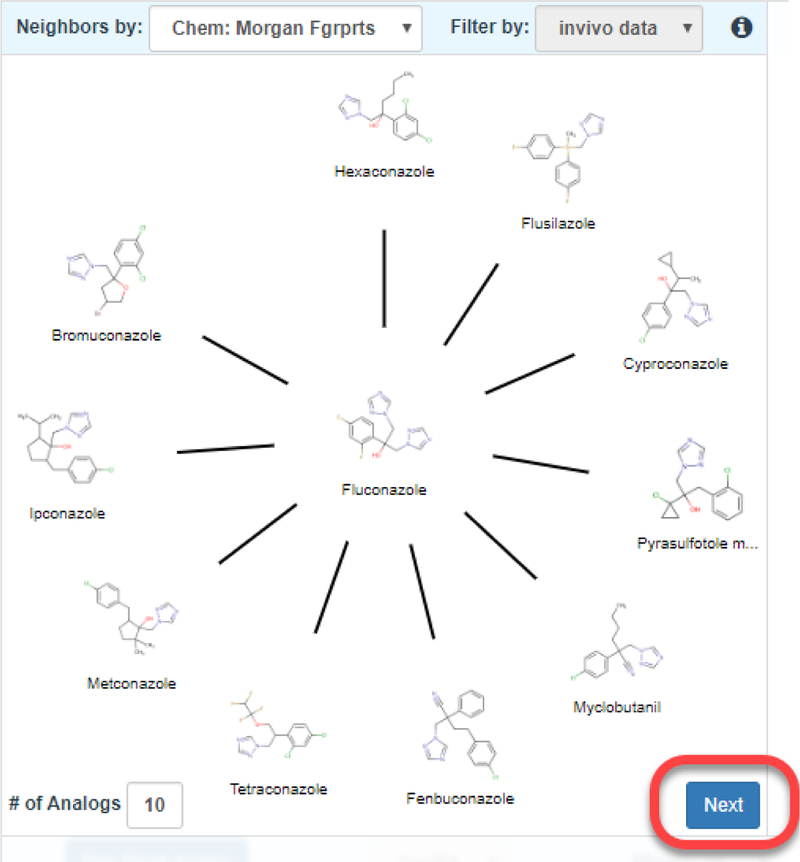
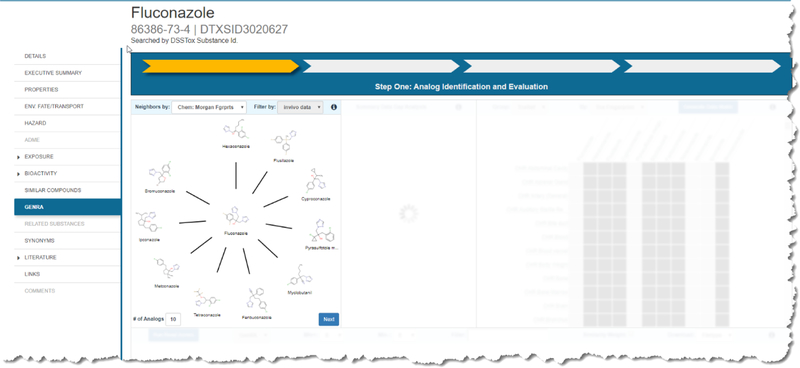
The starting grid display only has the first window unobscured. This grid window shows the neighborhood of source analogues that surround the target substance which appears in the center of a radial plot (Figure 4). Starting from 12-oclock on the plot, analogues are ordered in decreasing order of similarity as calculated by the Jaccard index (https://en.wikipedia.org/wiki/Jaccard_index) (which ranges from 0 and 1 where 0 denotes dissimilar and 1 denotes identical). This radial plot represents the analogue identification and evaluation steps of the workflow. By default, 10 analogues are shown which are based on Morgan chemical fingerprints. The view can be updated by choosing a different fingerprint type and by changing the number of analogues. A minimum of 5 analogues and maximum of 10 analogues can be selected. Analogues are automatically filtered by the availability of in vivo toxicity data as taken from ToxRefDB v1.0. This is to ensure that analogues identified are helpful in a read-across prediction. Hovering over any of the source analogue depictions in the radial plot reveals the numerical pairwise similarity between the target and that of the analogue. If the user wishes to conduct a GenRA analysis for a different source analogue, or wishes to view the Chemical Results page, clicking on the structure depiction in the radial plot will open a new browser tab with the respective chemical details page of that analogue in the Dashboard. Once a user is satisfied with the analogues identified, the Next button needs to be clicked to proceed to the next step of the workflow – Data gap analysis (denoted as Step Two: Data Gap Analysis and Generate Data Matrix in the interface).
Figure 4.
Analogue identification view in GenRA
At this point, the next 2 grid views become unobscured and the workflow indicator changes to ‘Data Gap Analysis & Generate Data Matrix’. The first of these grid views is denoted as ‘Summary Data Gap Analysis’ (Figure 5). This view is intended to provide a landscape of the quantity of data records for the target substance and its source analogues with respect to different data streams listed earlier – ToxCast, Tox21, Chemotypes and ToxRefDB. The number of records are marked in the colored boxes and reflected in the color itself – black box indicates the greatest number of records whereas a yellow box indicates fewer records. Colors are automatically assigned by the underlying number of records. The summary is to provide a rapid perspective of how feasible a read-across might be based on the quantity of data for the source analogues.
Figure 5.
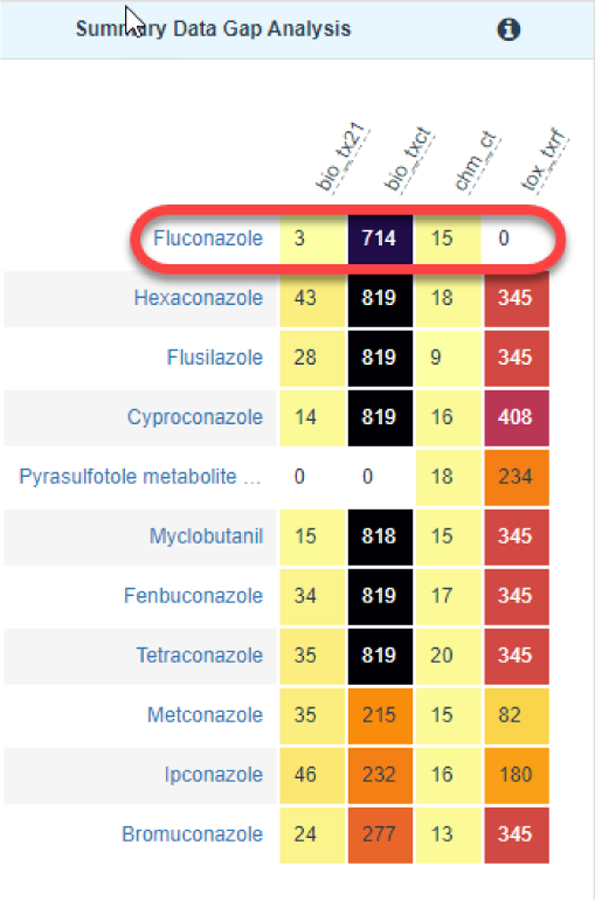
Summary data gap analysis view
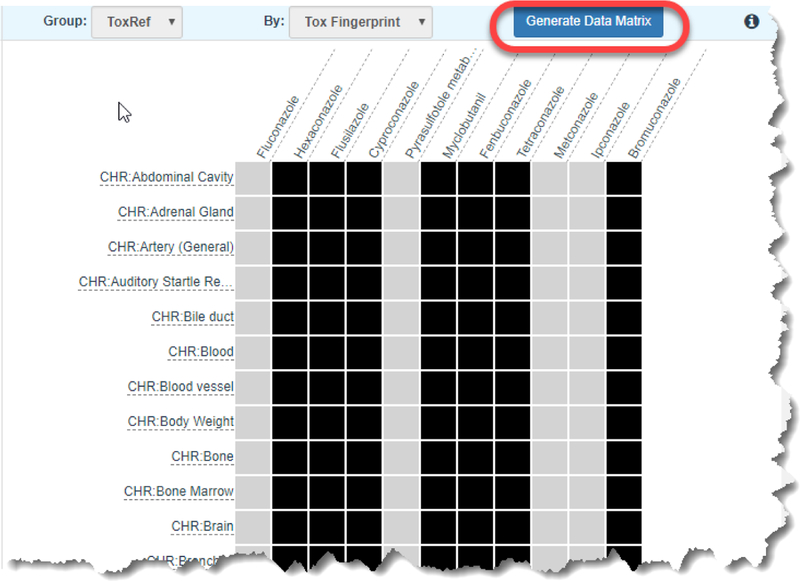
The second grid view (Figure 6) reflects ToxRef as a group by Tox Fingerprint. In this case, the data view shows the in vivo toxicity effect records as represented by this toxicity fingerprint. A black colored box in the grid view denotes the presence of a record for a particular toxicological effect. The utility of the grid view is to help a user gain a perspective of what data gaps exist for the source analogues relative to the target substance, and which effects might be reasonably predicted by those analogues. The entire matrix can be browsed using the scroll bar. A user might choose to focus on a subset of effects with the knowledge that the identified analogues will be helpful in that regard as data are available or alternatively that the analogue set is missing the data for the toxicity effects of most interest.
Figure 6.
Summary data gap matrix view
Whilst the summary views are helpful to gain a brief perspective of how much data are available for the target and source analogues, they do not provide any information on their potency (e.g. Lowest Effect Limit (LEL) in mg/kg-day etc.) or hazard profile. To evaluate this type of information, the ‘Generate Data Matrix’ button is clicked to move to the next step of the workflow ‘Run GenRA Prediction’. At this point the final grid becomes unobscured to reveal a matrix view of the target and source analogues. The initial part of the assessment here addresses the “Analogue Evaluation” step since the user can evaluate the consistency and concordance of the analogues, relative to their experimental data, in terms of the presence or absence of toxicity effects. Presence and absence is reflected by the colors of the boxes in the data matrix: red for the presence of toxicity effects, blue for the absence of toxicity effects, and grey for no data. Hovering over any box reveals a tool tip indicating no data, or no effects for grey and blue colors, respectively, whereas the doses at which toxicity effects were reported are shown for red boxes. The data matrix view, using the same color codes, (Figure 7) provides the user with an informative perspective of the consistency and concordance of the available data across the analogues and between the endpoints. Users can filter the effects of interest using the filter window, select the threshold for the number of positives and negatives within the analogue set, and alter the view so that the similarity index is used to shape the size of the data matrix boxes (Figure 8). The data matrix is ordered by the target substance in the first column, followed by the source analogues in order of decreasing similarity.
Figure 7.
Data matrix view
Figure 8.
Filtering options in the GenRA Data matrix view
The full extent of toxicity effects can be browsed by using the scroll bar to the right of the screen. Users can also elect to deselect a source analogue from further consideration by clicking on the tick symbol by the similarity index value at the top of the column. Once the user has selected the desired source analogues, the ‘Run Read-across” button is clicked to derive the GenRA predictions. There is a short time lag whilst the calculations are performed. Although the actual predictions are computed rapidly (given the simplicity of the similarity-weighted activity algorithm), the calculation of the associated performance metrics, which provide the uncertainty assessment characteristics, takes a little longer to process. After the GenRA predictions are generated, the first column in the data matrix view (the column for the target substance) is updated with colors of differing opacity (Figure 9). The colors are still red or blue, but the degree of opacity denotes the confidence associated with any prediction. The darker the color, the less confident the prediction (since opacity is scaled by the lower p-value). The confidence is measured by 2 characteristics, the Area under the curve (AUC) of a ROC (Receiver Operating Characteristic) and the p-value (see Shah et al., 2016 for further details). The higher the AUC and the lower the p-value then the more confident the prediction. The current GenRA implementation is focused on structural or bioactivity predictions, other contexts of similarity (such as metabolism) that are pertinent in traditional read-across, will be the subject of future work.
Figure 9.
GenRA predictions
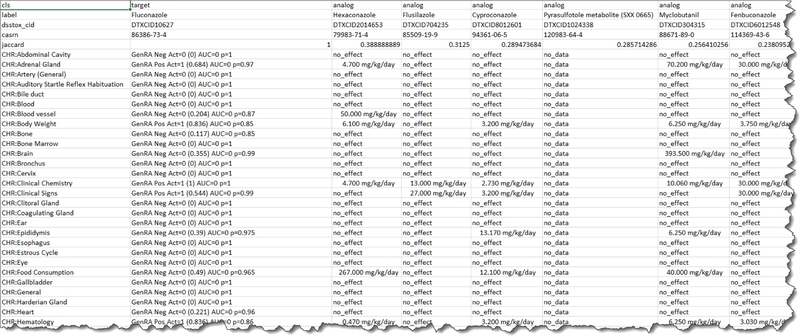
The final step of the workflow involves exporting the predictions generated using the Download options. File types include TSV and Excel files which can be exported and mirror the view presented in the application data matrix (Figure 10). Currently, any subsequent analysis requires the end user to exploit other data analysis tools. In future releases, options to sort and rank order predictions and aggregate by toxicity type will be available, as well as other possibilities to identify and evaluate analogues.
Figure 10.
Partial view of export file of predictions
GenRA provides the user with a standardized workflow interface to enable reproducible data driven read-across predictions of in vivo toxicity effects based on chemical/or bioactivity fingerprints. The predictions are binary outcomes of presence or absence of toxicity with quantitative measures of uncertainty as expressed by the AUC and p-values. In addition, exported results include potency values of analogues that can be further analyzed. The inclusion of the GenRA module into the CompTox Chemicals Dashboard has provided community access to generate read-across predictions in a highly intuitive manner. The GenRA workflow and user documentation are available on the EPA CompTox Chemicals Dashboard website.
Figure 3.
Working interface of GenRA
Acknowledgements
The authors wish to thank the NCCT software development team for their dedication and commitment to the delivery of the GenRA module and ongoing development of the CompTox Dashboard.
Footnotes
Software availability
The GenRA workflow and user documentation are available on the EPA CompTox Chemicals Dashboard website at https://comptox.epa.gov/dashboard.
Publisher's Disclaimer: Disclaimer
Publisher's Disclaimer: The views expressed in this article are those of the authors and do not necessarily reflect the views or policies of the U.S. Environmental Protection Agency. Mention of trade names or commercial products does not constitute endorsement or recommendation for use.
The ChemoTyper application was developed by Molecular Networks GmbH, Erlangen, Germany under a contract from the U.S. FDA, Center for Food Safety and Applied Nutrition (CFSAN), Office of Food Additive Safety. The XML-based substructure (or chemotype) definition language CSRML was co-developed in collaboration with Altamira LLC, olumbus, OH, USA. See https://www.mn-am.com/
References
- Helman G, Shah I, Patlewicz G. 2018. Extending the Generalised Read-Across approach (GenRA): A systematic analysis of the impact of physicochemical property information on read-across performance. Comp Toxicol In press [DOI] [PMC free article] [PubMed]
- Low Y, Sedykh A, Fourches D, Golbraikh A, Whelan M, Rusyn I, Tropsha A. 2013. Integrative chemical-biological read-across approach for chemical hazard classification. Chem. Res. Toxicol 26(8): 1199–1208. [DOI] [PMC free article] [PubMed] [Google Scholar]
- Nilakantan R, Bauman N, Dixon JS, Venkataraghavan R. 1987. Topological torsion - a new molecular descriptor for SAR applications - comparison with other descriptors. J. Chem. Infor. Comput. Sci 27(2): 82–85. [Google Scholar]
- OECD. 2014. Guidance on grouping of chemicals. OECD Series on Testing and Assessment No. 194 Organisation for Economic Co-operation and Development, Paris, France. [Google Scholar]; Shah I, Liu J, Judson RS, Thomas RS, Patlewicz G. 2016. Systematically evaluating read-across prediction and performance using a local validity approach characterized by chemical structure and bioactivity information. Regul. Toxicol. Pharmacol 79: 12–24. doi: 10.1016/j.yrtph.2016.05.008. [DOI] [PubMed] [Google Scholar]
- Patlewicz G, Helman G, Pradeep P, Shah I. 2017. Navigating through the minefield of read-across tools: A review of in silico tools for grouping. Comp. Toxicol 3: 1–18 [DOI] [PMC free article] [PubMed] [Google Scholar]
- Patlewicz G, Cronin MTD, Helman G, Lambert J, Lizarraga LE, Shah I. 2018. Navigating through the minefield of read-across frameworks: A commentary perspective. Comp. Toxicol 6: 39–54. [Google Scholar]
- Python Software Foundation. Python Language Reference, version 2.7. Available at http://www.python.org.
- RDKit Open-Source Cheminformatics. http://www.rdkit.org.
- Richard A, Judson R, Houck K, Grulke C, Volarath P, Thillainadarajah I, Yang C, Rathman J, Martin M, Wambaugh J, Knudsen T, Kancherla J, Mansouri K, Patlewicz G, Williams A, Little S, Crofton K, Thomas R. 2016. The ToxCast Chemical Landscape: Paving the Road to 21st Century Toxicology. Chem. Res. Toxicol 29(8): 1225–1251. doi: 10.1021/acs.chemrestox.6b00135. [DOI] [PubMed] [Google Scholar]
- Rogers D, Hahn M. 2010. Extended-connectivity fingerprints. J. Chem. Infor. Model 50: 742–754. [DOI] [PubMed] [Google Scholar]
- Shah I, Liu J, Judson RS, Thomas RS, Patlewicz G. 2016. Systematically evaluating read-across prediction and performance using a local validity approach characterized by chemical structure and bioactivity information. Regul Toxicol Pharmacol 79: 12–24. [DOI] [PubMed] [Google Scholar]
- Williams A, Grulke C, Edwards J, McEachran A, Mansouri K, Baker N, Patlewicz G, Shah I, Wambaugh J, Judson R. 2017. The CompTox Chemistry Dashboard – A Community Data Resource for Environmental Chemistry. J. Cheminformatics 9: 61. doi: 10.1186/s13321-017-0247-6 [DOI] [PMC free article] [PubMed] [Google Scholar]
- Yang C, Tarkhov A, Marusczyk J, Bienfait B, Gasteiger J, Kleinoeder T, Magdziarz T, Sacher O, Schwab CH, Schwoebel J, Terfloth L, Arvidson K, Richard A, Worth A, Rathman J. 2015. New Publicly Available Chemical Query Language, CSRML, To Support Chemotype Representations for Application to Data Mining and Modeling. J. Chem. Inf. Model 55(3): 510–528. [DOI] [PubMed] [Google Scholar]


