

Abstract
Addressing the opioid epidemic is a national priority. We analyzed national trends in inpatient and emergency department (ED) discharges for opioid abuse, dependence, and poisoning using Healthcare Cost and Utilization Project data. Inpatient and ED discharge rates increased overall across the study period, but a decline was observed for prescription opioid-related discharges beginning in 2010, while a sharp increase in heroin-related discharges began in 2008.
The US opioid epidemic has been termed the “worst drug crisis in American history,”1 and opioid deaths now surpass those due to automobile accidents.2 In the past two decades, opioid-related death rates have nearly tripled, opioid-related hospital visits have dramatically increased, and misuse of prescription opioids has reached alarming levels.3,4
Postulated causes of this crisis include liberal opioid prescribing that started in the mid-1990s to address the perceived undertreatment of pain, coupled with the increased availability of illicit drugs.5–9 Reports have highlighted a significant increase in opioid-related deaths, and starting in 2010, federal initiatives urged more judicious opioid prescribing to reduce associated harms.3,10–12
We analyzed national trends in inpatient and emergency department (ED) discharges for opioid dependence, abuse, and poisoning using publicly available data (Exhibit 1), as defined by International Classification of Diseases, Ninth Revision, Clinical Modification (ICD-9-CM), diagnosis codes. We found significant increases in opioid-related discharges overall. However, in 2010 a significant decline in poisoning by prescription opioids began, accompanied by an increase in poisoning by heroin that began in 2008. Decreases in prescription opioid discharges correspond to national, state, and local initiatives that targeted opioid prescribing.3,10 In contrast, our findings for trends in heroin-related discharges are alarming for public health stakeholders. Further research on prescribing patterns and the indirect costs of the shift to heroin for the legal system—as well as on the implementation of safety strategies, such as law enforcement overdose response programs—could guide policies directed at curbing and managing the epidemic.
EXHIBIT 1. Population-based inpatient (1997–2014) and emergency department (ED) (2006–14) discharges for prescription opioid and heroin poisoning in the United States, by diagnostic group.
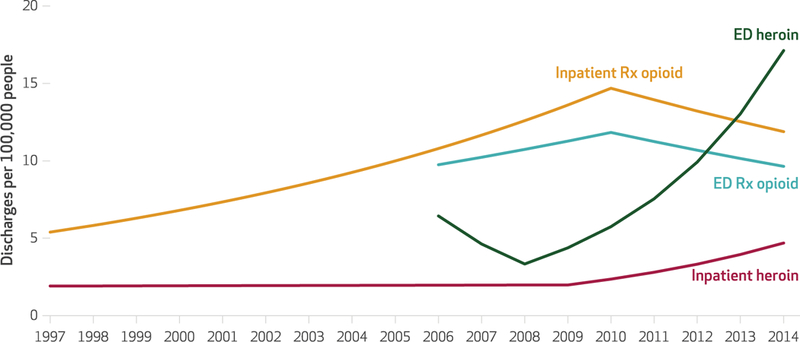
SOURCE Authors’ analysis of data for 1997–2014 from the Healthcare Cost and Utilization Project. NOTES Discharge rates were calculated per 1 00,000 population. Annual percentage changes (APCs) over time for the different diagnostic groups were estimated using a full-forward Joinpoint regression. Inpatient prescription opioid APCs showed a significant increase (p < 0.001) between 1997 and 2010 and a significant decrease (p < 0.05) between 2010 and 2014. ED prescription opioid APCs showed a significant increase (p < 0.05) between 2006 and 2010 and a significant decrease (p < 0.05) between 2010 and 2014. Inpatient heroin APCs showed a significant increase (p < 0.001) between 2008 and 2014. ED heroin APCs showed a significant increase (p < 0.001) between 2009 and 2014.
Study Data And Methods
We obtained publicly available data from the Healthcare Cost and Utilization Project for inpatient and ED discharges in the periods 1997–2014 and 2006–14, respectively.13 These data are a sample of hospital discharges and are used to provide estimates about discharges for the entire US population. We used census data for 1997–2014 to derive rates for the entire US pop-ulation.14
Patients discharged with ICD-9-CM diagnostic codes for opioid-related clinical conditions were categorized according to type of opioid use (for a full list of codes, see online Appendix Exhibit A1):15 dependence (recurrent use that interferes with daily activities and is characterized by tolerance and withdrawal symptoms), nondependent abuse (recurrent use that interferes with daily activities without tolerance or with-drawal symptoms), unspecified opioid poisoning, poisoning by heroin, poisoning by methadone, and poisoning by prescription opioids.16 All-listed diagnoses (that is, both principal and secondary diagnoses) were used to capture any mention of opioid use. The results of sensitivity analyses that compared trends in all-listed diagnoses and trends in only principal diagnoses are provided in Appendix Exhibit A2.15 Differences in distribution of discharges by age group, sex, and region between 1997 and 2014 for inpatient visits, and between 2006 and 2014 for ED visits, were compared using chi-square tests.
Trends were calculated using population-based rates of inpatient and ED discharges based on census demographic characteristics. Temporal changes of rates within each diagnostic group17 were evaluated using regression analysis. We determined the best-fitting regression line through the points (rates) across time, identifying where significant changes in trends took place. For each slope, the annual percentage change (APC) was calculated.We used Joinpoint software, version 4.4.0.0, to calculate APCs and analyze these trends for significance18 (for a detailed description of the methods, see Appendix Exhibit A3).15 Significant means statistically significant at the 0.05 level.
This study had several limitations. First, we used administrative data, which are affected by coding practices and differences in clinician awareness. However, using both principal and secondary diagnosis codes we found consistent rates of opioid-related discharges at the national level. Second, the Healthcare Cost and Utilization Project data lacked information on social determinants of health, so we could not adjust for important variables such as race and socioeconomic status. Nonetheless, we stratified our analysis by age groups, sex, and region, and we used census data to calculate population-based rates. Third, we did not have medication-level information, particularly on short-acting narcotic antagonist medications (such as naloxone) and new illicit drugs (for example, nonpharma-ceutical fentanyl). Finally, while most fatal over-doses occur outside of the hospital (and there-fore were not included in our data set), hospital records provide a way to understand the more widespread phenomenon of nonfatal overdoses. However, we divided our population into diagnostic subcategories to distinguish between dependence, abuse, and different types of poisonings.
Study Results
We found that while ED and inpatient discharge rates for prescription opioid poisonings began to decline around 2010, discharge rates for heroin poisonings in the same settings began to increase around 2008 (Exhibit 1). Discharge rates for prescription opioid poisoning increased significantly by 8.0 percent annually from 1997 to 2010 in the inpatient setting and 5.0 percent annually from 2006 to 2010 in the ED (Exhibit 2). In both settings, rates decreased significantly from 2010 to 2014—declining annually by 5.1 percent and 5.0 percent, respectively.
EXHIBIT 2.
Annual percentage changes (APCs) in US inpatient and emergency department (ED) discharge rates for opioid dependence and abuse and for types of poisoning, by time period
| No joinpoints or before joinpoint |
After joinpoint |
|||
|---|---|---|---|---|
| Diagnostic group | Time period | APCa | Time period | APCb |
| INPATIENT | ||||
| All inpatient discharges | 1997–2014 | 4.9**** | —c | —c |
| Opioid dependence | 1997–2014 | 4.1**** | —c | —c |
| Nondependent opioid abuse | 1997–2014 | 6.6**** | —c | —c |
| Unspecified opioid poisoning | 1997–2011 | 12.3**** | 2011–14 | 4.6 |
| Heroin poisoning | 1997–2009 | 0.3 | 2009–14 | 18.8**** |
| Methadone poisoning | 1997–2007 | 22.3**** | 2007–14 | −4.7*** |
| Prescription opioid poisoning | 1997–2010 | 8.0**** | 2010–14 | −5.1** |
| EMERGENCY DEPARTMENT | ||||
| All ED discharges | 2006–14 | 10.5**** | —c | —c |
| Opioid dependence | 2006–12 | 11.7**** | 2012–14 | 3.2 |
| Nondependent opioid abuse | 2006–08 | −4.4 | 2008–14 | 16.6**** |
| Unspecified opioid poisoning | 2006–14 | 10.6**** | —c | —c |
| Heroin poisoning | 2006–08 | −28.1 | 2008–14 | 31.4**** |
| Methadone poisoning | 2006–14 | −3.1*** | —c | —c |
| Prescription opioid poisoning | 2006–10 | 5.0** | 2010–14 | −5.0** |
SOURCE Authors’ analysis of data for 1997–2014 from the Healthcare Cost and Utilization Project. NOTES APCs per 100,000 people over time for the different diagnostic groups were estimated using a full-forward Joinpoint regression. Joinpoint software determines the best-fitting regression line through the points (rates) across time and identifies where significant changes in trends (joinpoints) take place.
Trends with 0 joinpoints (1997–2014 for inpatient discharges or 2006–14 for ED discharges) or before the joinpoint.
Trends after the joinpoint (when applicable).
Groups with no joinpoint detected.
p < 0.05
p 0.01
p 0.001
ED discharge rates for heroin poisoning significantly increased after 2008, at an annual rate of 31.4 percent (Exhibit 2). Overall, opioid-related discharge rates increased significantly by 10.5 percent annually in 2006–14 in the ED and 4.9 percent annually in 1997–2014 in the inpatient setting (Exhibit 2). Exhibit 3 displays these changes graphically. In both settings, opioid dependence and nondependent abuse had similar trends: Discharge rates from EDs increased significantly by 11.7 percent per year in 2006–12 for dependence and 16.6 percent per year in 2008–14 for abuse. And discharge rates from the inpatient setting increased significantly by 4.1 percent per year in 1997–2014 for dependence and 6.6 percent per year in the same period for abuse (Exhibits 2 and 3).
EXHIBIT 3. Population-based inpatient (1997–2014) and emergency department (ED) (2006–14) discharges for opioid dependence, abuse, and poisonings in the United States.
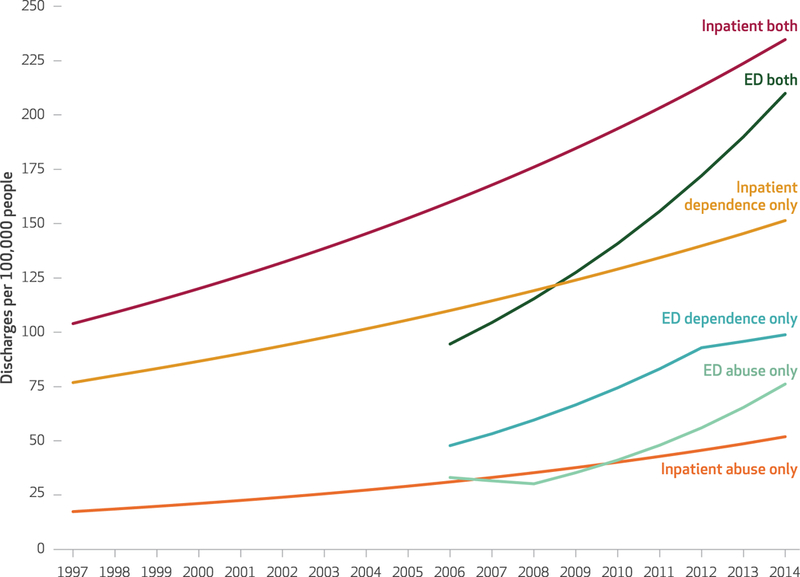
SOURCE Authors’ analysis of data for 1997–2014 from the Healthcare Cost and Utilization Project. NOTE Although the exhibit shows discharges per 100,000 people, annual percentage changes (APCs) over time for the different diagnostic groups were estimated using a full-forward Joinpoint regression. Inpatient both, ED both, inpatient dependence only, and inpatient abuse only APCs showed a significant increase (p < 0.001) over the study period. ED dependence APCs showed a significant increase (p < 0.001) between 2006 and 2012. ED abuse APCs showed a significant increase (p < 0.001) between 2008 and 2014.
Discharge rates for poisoning by unspecified opioids increased significantly, rising 12.3 percent annually in 1997–2011 in the inpatient setting and 10.6 percent annually in 2006–14 in the ED (Exhibit 2 and Appendix Exhibit A4).15 Inpatient discharge rates for poisoning by methadone increased significantly in 1997–2007, followed by a significant decline in 2007–14. ED discharge rates decreased significantly in 2006–14.
Exhibit 4 shows differences in patient demographic characteristics in inpatient (from 1997 to 2014) and ED (from 2006 to 2014) discharges. Differences between the years were significant in both settings, and inpatients accounted for the major differences. In 1997, people ages 18–44 made up 74 percent of the inpatient discharges, a share that dropped to 50 percent in 2014. Older age groups increased simultaneously. The proportion of female inpatient discharges also increased, from 42 percent in 1997 to 49 percent in 2014. Opioid-related inpatient discharges differed regionally, with percentage decreases over time in the Northeast and Midwest, and percentage increases in the South and West.
Exhibit 4.
Characteristics of US hospital discharges from inpatient care in 1997 and 2014 and from the emergency department (ED) in 2006 and 2014, for opioid dependence, abuse, or poisoning
| Inpatient discharges |
ED discharges |
|||||||
|---|---|---|---|---|---|---|---|---|
| 1997 |
2014 |
2006 |
2014 |
|||||
| Number | Percent | Number | Percent | Number | Percent | Number | Percent | |
| Total | 292,738 | 100.00 | 745,610 | 100.00 | 311,895 | 100.00 | 659,537 | 100.00 |
| AGE GROUP (YEARS) | ||||||||
| Younger than 18 | 3,680 | 1.26 | 6,370 | 0.85 | 7,940 | 2.55 | 9,865 | 1.50 |
| 18–44 | 216,276 | 73.88 | 373,245 | 50.06 | 213,355 | 68.41 | 435,507 | 66.03 |
| 45–64 | 63,613 | 21.73 | 292,025 | 39.17 | 82,882 | 26.57 | 187,432 | 28.42 |
| 65–84 | 8,329 | 2.84 | 68,595 | 9.20 | 6,905 | 2.21 | 24,951 | 3.78 |
| Older than 84 | 840 | 0.29 | 5,375 | 0.72 | 813 | 0.26 | 1,782 | 0.27 |
| SEX | ||||||||
| Male | 169,620 | 57.94 | 38,023 | 51.00 | 176,521 | 56.60 | 375,531 | 56.94 |
| Female | 123,118 | 42.06 | 36,538 | 49.00 | 135,374 | 43.40 | 284,006 | 43.06 |
| REGION | ||||||||
| Northeast | 98,834 | 33.76 | 192,350 | 25.80 | 108,286 | 34.72 | 166,418 | 25.23 |
| Midwest | 66,739 | 22.80 | 156,785 | 21.03 | 50,752 | 16.27 | 161,724 | 24.52 |
| South | 80,105 | 27.36 | 240,925 | 32.31 | 91,593 | 29.37 | 198,768 | 30.14 |
| West | 47,060 | 16.08 | 155,550 | 20.86 | 61,264 | 19.64 | 132,627 | 20.11 |
SOURCE Authors’ analysis of data for 1997–2014 from the Healthcare Cost and Utilization Project. NOTE According to chi-square tests, all differences between 1997 and 2014 for inpatient discharges, and between 2006 and 2014 for ED discharges were significant (p < 0:01).
Sensitivity analyses examined trends for opioid use based only on primary diagnosis codes. The trends were similar to those in our main analysis except for opioid dependence and nondependent abuse: In the sensitivity analyses, the trends for principal diagnoses decreased and were stable, respectively. In both cases, the principal diagnosis accounted for a small fraction of the overall trend (see Appendix Exhibits A5–A10).15
Discussion
We found that overall inpatient and ED discharge rates for opioid dependence, abuse, and poisoning in the US population increased significantly during the study period.While rates continually increased for nonprescription opioids such as heroin and nonpharmaceutical fentanyl, rates for prescription opioids declined significantly in more recent years, a decrease that coincided with national, state, and local initiatives aiming to reduce the prescribing of opioids.10,12,19 Concomitantly, heroin poisoning has overtaken prescription opioid poisoning in the ED setting.
These data highlight the severity of the opioid epidemic in terms of inpatient and ED discharge rates, with the former increasing 4.9 percent annually and the latter increasing 10.5 percent annually. After 2008, ED discharge rates for heroin poisoning increased more sharply than the rates for any opioid poisoning—signaling that the scope of heroin harm is worse than previously suggested11,20—while discharges for prescription opioid poisoning recently began to decline in both the ED and inpatient settings. While these changes could be the result of national and local policies aimed at reducing the prescribing of opioids, the expanded availability of heroin and new lethal illicit drugs, such as nonphar-maceutical fentanyl, could mean that they are being used instead of prescription opioids.21 Although this hypothesis has been contested,22 recent studies have found that approximately three-quarters of patients with heroin addiction reported previous use of prescription opioids.4,23 The trends in ED and inpatient discharges likely underestimate the severity of the epidemic because the use of naloxone, which may prevent ED or inpatient admissions, has become more readily accessible. In addition, lethal illicit opioids may lead to death before hospitalization, and the common dosage of naloxone might not be effective in rescuing people from fentanyl over-dose.24–26
Opioid-related discharges were found to occur equally in men and women. In the inpatient setting, the age distribution of discharged patients shifted over time, with patients ages sixty-five and older accounting for 3 percent of all opioid-related discharges in 1997 and 10 percent in 2014. Understanding these demographic shifts could increase awareness of and improve responses to these critical episodes. In addition, public education efforts regarding opioid misuse should address all age groups.
Our findings for trends in heroinrelated discharges are alarming for public health stakeholders.
Conclusion
The decrease in prescription opioid-related discharges gives hope that health care providers, nonmedical first responders, and families are appropriately responding to safety initiatives. Yet hospitals need to be appropriately staffed and their personnel adequately trained to recognize and respond to overdoses and deal with the evolving patterns of the opioid epidemic, including the management of other associated harms (such as infectious diseases, injuries, and psychiatric distress). In addition, specific treatment programs need to be implemented for patients discharged with opioid misuse. ■
Supplementary Material
Acknowledgments
This study was presented at AcademyHealth Annual Research Meeting, New Orleans, Louisiana, June 26, 2017. This project was supported by the Agency for Healthcare Research and Quality (Grant No. R01 HS024096). The content of the article is solely the responsibility of the authors and does not necessarily represent the official views of the Agency for Healthcare Research and Quality.
Contributor Information
Dario Tedesco, postdoctoral scholar in the Department of Medicine, Stanford University, in California..
Steven M. Asch, director of the Center for Innovation to Implementation at the Veterans Affairs Palo Alto Health Care System and vice chief of the Division of Primary Care and Population Health at Stanford University.
Catherine Curtin, associate professor of surgery at Palo Alto Veterans Affairs Hospital and at Stanford University School of Medicine..
Jennifer Hah, instructor of anesthesiology at Stanford University School of Medicine..
Kathryn M. McDonald, executive director of the Center for Health Policy and the Center for Primary Care Outcomes Research at Stanford University.
Maria P. Fantini, professor of hygiene and public health in the Department of Biomedical and Neuromotor Sciences at the University of Bologna, in Italy.
Tina Hernandez-Boussard, associate professor of medicine, biomedical data sciences, and surgery at Stanford University School of Medicine..
NOTES
- 1.Bosman J Inside a killer drug epidemic: a look at America’s opioid crisis. New York Times. 2017. January 6. [Google Scholar]
- 2.Williams AR, Bisaga A. From AIDS to opioids—how to combat an epidemic. N Engl J Med. 2016;375(9):813–5. [DOI] [PMC free article] [PubMed] [Google Scholar]
- 3.Murthy VH. Ending the opioid epidemic—a call to action. N Engl J Med. 2016;375(25):2413–5. [DOI] [PubMed] [Google Scholar]
- 4.Cicero TJ, Ellis MS, Surratt HL, Kurtz SP. The changing face of heroin use in the United States: a retrospective analysis of the past 50 years. JAMA Psychiatry. 2014;71(7): 821–6. [DOI] [PubMed] [Google Scholar]
- 5.Phillips DM. JCAHO pain management standards are unveiled. Joint Commission on Accreditation of Healthcare Organizations. JAMA. 2000;284(4):428–9. [DOI] [PubMed] [Google Scholar]
- 6.Quality improvement guidelines for the treatment of acute pain and cancer pain. American Pain Society Quality of Care Committee. JAMA. 1995;274(23):1874–80. [DOI] [PubMed] [Google Scholar]
- 7.Department of Veterans Affairs. Pain as the 5th vital sign toolkit [Internet]. Washington (DC): Veterans Health Administration; 2000. October [cited 2017 Jul 19]. Available from: https://www.va.gov/PAINMANAGEMENT/docs/Pain_As_the_5th_Vital_Sign_Toolkit.pdf [Google Scholar]
- 8.Baker DW. History of the Joint Commission’s pain standards: lessons for today’s prescription opioid epidemic. JAMA. 2017;317(11): 1117–8. [DOI] [PubMed] [Google Scholar]
- 9.Centers for Disease Control and Prevention. Increases in fentanyl drug confiscations and fentanyl-related overdose fatalities [Internet]. Atlanta (GA): CDC; 2015. October 26 [cited 2017 Jul 19]. Available from: https://emergency.cdc.gov/han/han00384.asp [Google Scholar]
- 10.Office of the Press Secretary [Internet]. Washington (DC): White House. Press release, Fact sheet: President Obama proposes $1.1 billion in new funding to address the prescription opioid abuse and heroin use epidemic; 2016. Feb 2 [cited 2017 Jul 19]. Available from: https://obamawhitehouse.archives.gov/the-press-office/2016/02/02/president-obama-proposes-11-billion-new-funding-address-prescription [DOI] [PubMed]
- 11.Compton WM, Jones CM, Baldwin GT. Relationship between nonmedical prescription-opioid use and heroin use. N Engl J Med. 2016;374(2): 154–63. [DOI] [PMC free article] [PubMed] [Google Scholar]
- 12.Dowell D, Haegerich TM, Chou R. CDC guideline for prescribing opioids for chronic pain—United States, 2016. MMWR Recomm Rep. 2016;65(1):1–49. [DOI] [PubMed] [Google Scholar]
- 13.Agency for Healthcare Research and Quality. Healthcare Cost and Utilization Project [Internet]. Rockville (MD): AHRQ; [cited 2017 Jul 19]. Available from: https://hcupnet.ahrq.gov/#setup [Google Scholar]
- 14.Bureau Census. Population and housing unit estimates [Internet]. Washington (DC): Census Bureau; [cited 2017 Jul 19]. Available from: https://www.census.gov/programs-surveys/popest.html [Google Scholar]
- 15.To access the Appendix, click on the Details tab of the article online.
- 16.American Psychiatric Association; Diagnostic and statistical manual of mental disorders. 4th edition Washington (DC): APA; 1994 [Google Scholar]
- 17.ICD-9-CM codes are divided according to diagnostic groups defining different opioid-related clinical conditions: dependence, abuse, unspecified poisoning, poisoning by heroin and methadone, and poisoning by prescription opioids.
- 18.Kim HJ, Fay MP, Feuer EJ, Midthune DN. Permutation tests for Joinpoint regression with applications to cancer rates. Stat Med. 2000;19(3): 335–51. [DOI] [PubMed] [Google Scholar]
- 19.American Medical Association. Reversing the opioid epidemic [Internet]. Chicago (IL): AMA; [cited 2017 Jul 19]. Available from: https://www.amaassn.org/delivering-care/reversing-opioid-epidemic [Google Scholar]
- 20.Rudd RA, Seth P, David F, Scholl L. Increases in drug and opioid-involved overdose deaths—United States, 2010–2015. MMWR Morb Mortal Wkly Rep. 2016;65(5051): 1445–52. [DOI] [PubMed] [Google Scholar]
- 21.Dart RC, Surratt HL, Cicero TJ, Parrino MW, Severtson SG, Bucher-Bartelson B, et al. Trends in opioid analgesic abuse and mortality in the United States. N Engl J Med. 2015; 372(3):241–8. [DOI] [PubMed] [Google Scholar]
- 22.Dowell D, Zhang K, Noonan RK, Hockenberry JM. Mandatory provider review and pain clinic laws reduce the amounts of opioids prescribed and overdose death rates. Health Aff (Millwood). 2016;35(10): 1876–83. [DOI] [PMC free article] [PubMed] [Google Scholar]
- 23.Jones CM. Heroin use and heroin use risk behaviors among nonmedical users of prescription opioid pain relievers—United States, 2002–2004 and 2008–2010. Drug Alcohol Depend. 2013;132(1–2):95–100. [DOI] [PubMed] [Google Scholar]
- 24.Humphreys K An overdose antidote goes mainstream. Health Aff (Millwood). 2015;34(10):1624–7. [DOI] [PubMed] [Google Scholar]
- 25.Walley AY, Xuan Z, Hackman HH, Quinn E, Doe-Simkins M, Sorensen-Alawad A, et al. Opioid overdose rates and implementation of over-dose education and nasal naloxone distribution in Massachusetts: interrupted time series analysis. BMJ. 2013;346:f174. [DOI] [PMC free article] [PubMed] [Google Scholar]
- 26.Sutter ME, Gerona RR, Davis MT, Roche BM, Colby DK, Chenoweth JA, et al. Fatal fentanyl: one pill can kill. Acad Emerg Med. 2017;24(1): 106–13. [DOI] [PubMed] [Google Scholar]
Associated Data
This section collects any data citations, data availability statements, or supplementary materials included in this article.