

SUMMARY
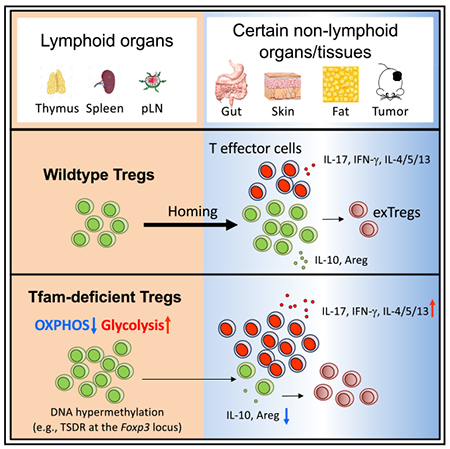
Regulatory T cells (Tregs) are pivotal for immune suppression. Cellular metabolism is important for Treg homeostasis and function. However, the exact role of mitochondrial respiration in Tregs remains elusive. Mitochondrial transcription factor A (Tfam) is essential for mitochondrial respiration and controls mitochondrial DNA replication, transcription, and packaging. Here, we show that genetic ablation of Tfam in Tregs impairs Treg maintenance in non-lymphoid tissues in the steady state and in tumors. Tfam-deficient Tregs have reduced proliferation and Foxp3 expression upon glucose deprivation in vitro. Tfam deficiency preferentially affects gene activation in Tregs through regulation of DNA methylation, with enhanced methylation in the TSDR of the Foxp3 locus. Deletion of Tfam in Tregs affects Treg homing and stability, resulting in tissue inflammation in colitis, but enhances tumor rejection. Thus, our work reveals a critical role of Tfam-mediated mitochondrial respiration in Tregs to regulate inflammation and anti-tumor immunity.
Graphical Abstract
In Brief
Cellular metabolism is important for regulatory T cell (Treg) homeostasis and function. Fu et al. show that mitochondrial transcription factor A (Tfam)-mediated mitochondrial respiration is critical for Treg maintenance in non-lymphoid organs and tissues in the steady state and in tumors.
INTRODUCTION
A fine balance between immune activation and suppression is vital for an organism to control pathogen infection and tumor formation while preventing autoimmune diseases. Regulatory T cells (Tregs), a subset of Foxp3-expressing CD4+ T cells, play a crucial role in immune suppression. In vivo, Tregs are either developed in the thymus (tTregs) with expression of Nrp1 and Helios or differentiated from naive CD4+ T cells in the peripheral organs (pTregs). In vitro, Tregs can also be differentiated from naive CD4+ T cells by stimulation of cytokines such as transforming growth factor β (TGF-β) and retinoic acid (RA) (in vitro differentiated regulatory T cells [iTregs]). Under certain conditions (e.g., inflammation and/or homeostatic proliferation), Tregs can lose Foxp3 expression and become exTregs (Rubtsov et al., 2010). Maintenance of Treg stability is critical for their suppressive function. Tregs expressing the transcriptional factor Blimp-1 have an activated phenotype and are considered effector Tregs (eTregs) (Cretney et al., 2013). eTregs also express ST2 and KLRG1 and are abundantly present in peripheral tissues, such as the gut, skin, and fat (Cipolletta et al., 2012; Delacher et al., 2017; Schiering et al., 2014; Vasanthakumar et al., 2015). In contrast, Blimp-1-negative Tregs have been termed central Tregs (cTregs) (Liston and Gray, 2014). Current knowledge regarding eTreg generation and function remains limited.
Emerging evidence suggests that precise metabolic regulation is important for Treg homeostasis and function. mTORC1 signaling positively regulates Treg function in mice by promoting cholesterol and lipid metabolism and upregulation of the suppressive molecules cytotoxic T-lymphocyte-associated protein 4 (CTLA4) and inducible T cell costimulatory (ICOS) (Zeng et al.,2013). Deletion of the metabolic sensor Stk11 in Tregs disrupts mitochondrial fitness and metabolism (Yang et al., 2017). The Toll-like receptors (TLRs) TLR1 and TLR2 promote Treg proliferation by increasing glycolysis but also impair Treg-suppressive capacity in mice (Gerriets et al., 2016), whereas TLR8 signaling selectively inhibits glucose uptake and glycolysis in human Tregs and inhibits their suppressive function (Li et al., 2018a). Foxp3 can suppress glycolysis through inhibition of phosphatidylinositol 3-kinase (PI3K)-Akt-mTORC1 signaling (Gerriets et al., 2016) and induces oxidative phosphorylation (OXPHOS) through suppression of Myc expression (Angelin et al., 2017; Gerriets et al., 2016). High OXPHOS activity facilitates Treg function in low-glucose and high-lactate environments in peripheral organs, such as the large intestine (Angelin et al., 2017).
Human and mouse mitochondrial genomes contain 13 protein-coding genes that are essential for the mitochondrial respiratory chain (Kazachkova et al., 2013; Schon et al., 2012). Tfam is a nuclear gene encoding transcriptional factors crucial for mitochondrial respiration by regulating mitochondrial DNA replication, transcription, and packaging (Picca and Lezza, 2015). Tfam germline knockout in mice leads to embryonic lethality (Larsson et al., 1998), indicating a vital role of Tfam-mediated mitochondrial respiration in embryo development. Conditional deletion of Tfam in hematopoietic stem cells (HSCs) in mice is also lethal because of a severe decrease in embryo-derived red blood cells (Ansó et al., 2017). Cell-type-specific deletion of Tfam in T cells by the CD4-Cre transgene causes severe mitochondrial respiration defects, lysosomal storage disorders, and enhanced proinflammatory interferon γ (IFN-γ) production by CD4+ T cells (Baixauli et al., 2015) but has no obvious effect on Treg maintenance in the thymus and spleen. A recent report showed that Tfam deletion in Tregs decreases gut Tregs, but the precise mechanism is unclear (Chapman et al., 2018).
Here we generated mice with specific deletion of Tfam in Tregs to study the role of Tfam-mediated mitochondrial respiration in Treg development and function. Our data revealed a selective requirement for Tfam to regulate tissue-resident Treg maintenance (homing and stability) and function in the gut, skin, and fat in the steady state and in the tumor microenvironment. Mechanistically, Tfam promotes gene activation in Tregs through DNA de-methylation and is essential for Treg proliferation and Foxp3 expression, especially in low-glucose environments. Our work suggests that the metabolic environment can affect Treg homeostasis and function via Tfam-dependent mitochondrial respiration.
RESULTS
Treg-Specific Deletion of Tfam Results in Severe Inflammation in Mice
To define the cell-intrinsic role of Tfam in Tregs, we crossed mice carrying loxP-flanked Tfam alleles (Tfamfl/fl) with Foxp3Yfp-cre mice to generate Tfamfl/flFoxp3Yfp-Cre/Yfp-Cre homozygous female or Tfamfl/flFoxp3Yfp-Cre/Y hemizygous male mice (hereafter referred to as Tfamfl/flFoxp3Yfp-Cre mice). The deletion of Tfam in Tregs was efficient (Figure S1A). Consistent with previous reports that Tfam controls mitochondrial DNA replication and transcription, we detected a significant decrease of mitochondrial DNA content (Figure S1B) and mitochondrial gene-encoded mRNAs (Figure S1C) in Tfam-deficient Tregs compared with control Tregs, suggesting defective mitochondrial respiration in Tfam-deficient Tregs. Compared with littermate controls, Tfamfl/flFoxp3Yfp-Cre mice manifested reduced body size, severe loss of hair and body adipose tissue, and skin ulceration (Figure 1A). Tfamfl/flFoxp3Yfp-Cre mice were able to survive beyond 6 weeks of age (data not shown) but gradually lost body weight after 4 weeks of age (Figure 1B). The mutant mice had lymphadenopathy of peripheral lymph nodes, whereas the spleen and mesenteric lymph nodes (mLNs) appeared similar compared with control mice (Figure S1D). Histological analysis showed severe leukocyte infiltration in Tfamfl/flFoxp3Yfp-Cre mice in multiple organs, such as the skin, lung, and liver (Figure 1C). The morphology and length of the small and large intestine were similar, except that mild leukocyte infiltration was apparent in the cecum of Tfamfl/flFoxp3Yfp-Cre mice (Figure 1C; Figure S1E). Compared with those in littermate control mice, both CD4+ T and CD8+ T cells in Tfamfl/flFoxp3Yfp-Cre mice showed a significant increase in the memory and effector population (CD44hiCD62Llo) in various lymphoid and non-lymphoid tissues (Figure 1D; Figure S1F). Cytokine production by CD4+ T cells, such as interleukin-17A (IL-17A), IFN-γ, tumor necrosis factor (TNF), IL-4, IL-5, and IL-13, was significantly increased in multiple organs of Tfamfl/flFoxp3Yfp-Cre mice (Figures 1E and 1F; Figures S1G and S1H). Overall, the development of severe systemic inflammation in multiple organs and tissues in Tfamfl/flFoxp3Yfp-Cre mice revealed that Tfam in Tregs has a crucial role in maintenance of immune homeostasis.
Figure 1. Treg-Specific Deletion of Tfam Results in Severe Systemic Inflammation in Mice.
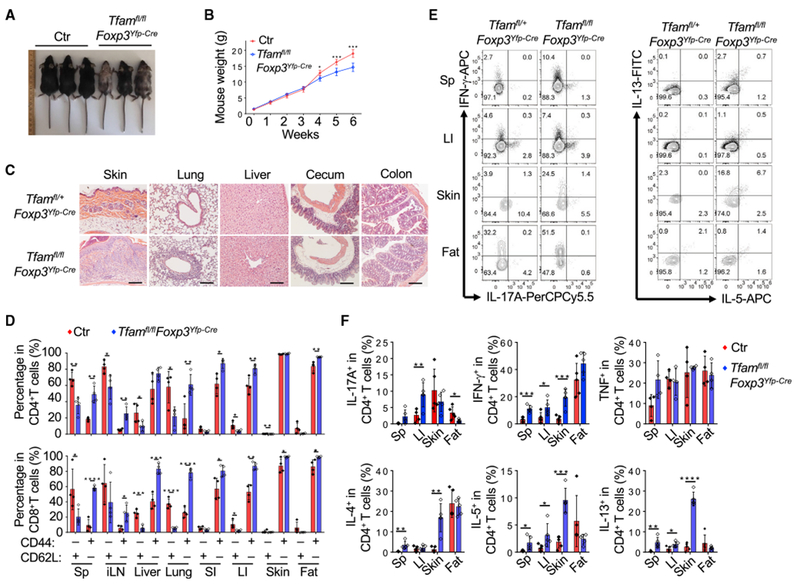
Genotypes of the control (Ctr) group include Tfam+/+Foxp3Yfp-Cre and Tfamfl/+Foxp3Yfp-Cre unless otherwise noted.
(A) Representative figure of 6-week-old mice of the indicated genotypes.
(B) Tfam conditional knockout by Foxp3Yfp-Cre resulted in lower body weight from 4 weeks of age. Ctr, n = 6; Tfamfl/flFoxp3Yfp-Cre, n = 5.
(C) H&E staining of multiple organ and tissue sections from 6-week-old mice of the indicated genotypes. Data are representative of Ctr (n = 3) and Tfamfl/flFoxp3Yfp-Cre (n = 2) mice.
(D) Percentages of CD44 and CD62L expression in CD4+ (top) and CD8+ (bottom) T cells in different organs of 6-week-old Ctr (n = 4) and Tfamfl/flFoxp3Yfp-Cre (n = 4) mice.
(E) Flow cytometry analysis of IL-17A, IFN-γ, IL-5, and IL-13 expression in CD4+ T cells in the spleen (Sp), large intestine (LI), skin, and fat of 6-week-old mice of the indicated genotypes. Data are representative of three independent experiments.
(F) Percentages of IL-17A, IFN-γ, TNF, IL-4, IL-5, and IL-13 expression in CD4+ T cells in 6-week-old Ctr (n = 5) and Tfamfl/flFoxp3Yfp-Cre (n = 5) mice. Data are shown as mean ± SD in (B), (D), and (F).
Cell-Intrinsic Control of Tissue-Resident Tregs by Tfam
Compared with littermate controls, the percentage of Tregs among CD4+ T cells in Tfamfl/flFoxp3Yfp-Cre mice was greatly reduced in non-lymphoid organs such as the gut, fat, and skin but not significantly changed in the spleen or even slightly increased in other lymphoid organs, including the thymus, inguinal lymph nodes (iLNs), and mLNs (Figures 2A and 2B), suggesting a special requirement for Tfam to regulate the Treg compartment in certain peripheral organs. Of note, Tregs also showed a significant decrease in the large intestine but not in the spleen of Tfamfl/flFoxp3Yfp-Cre mice compared with control mice at 1 week and 3 weeks of age, when the Tfamfl/flFoxp3Yfp-Cre mice did not display obvious inflammatory disease (Figures S2A–S2D). Fluorescence-activated cell sorting (FACS) analysis of Annexin V and cleaved caspase-3 and real-time RT-PCR analysis of expression of the apoptotic and anti-apoptotic genes Bax and Bcl-xl showed no significant difference between control and Tfam-deficient Tregs (Figures S2E–S2G), consistent with a previous report showing that Tfam deficiency has no significant effect on CD4+ T cell survival (Baixauli et al., 2015). In addition, similar Ki67 staining was observed in control and Tfam-deficient intestinal Tregs (Figure S2H). Together, these data suggested that Tfam deficiency in Tregs did not affect Treg survival or proliferation in vivo.
Figure 2.
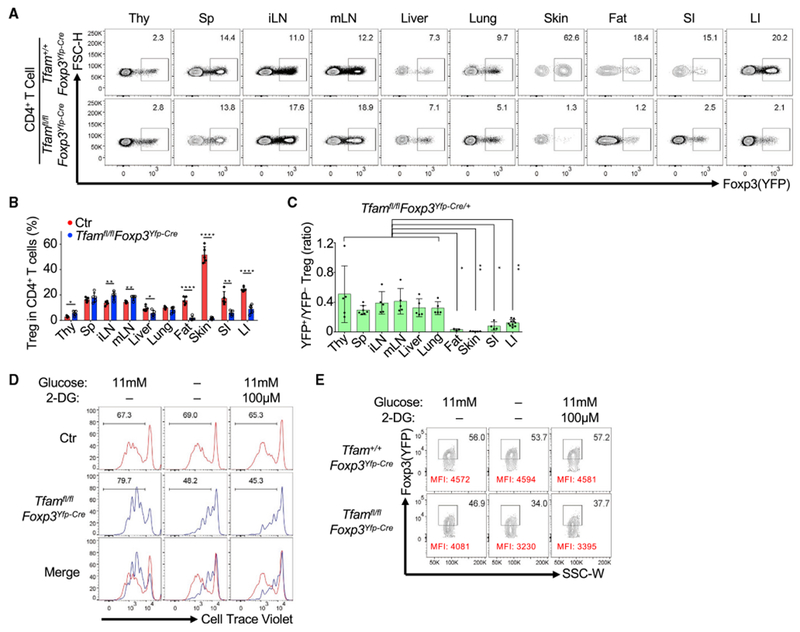
Tfam Deficiency in Tregs Affects Treg Maintenance
Genotypes of the Ctr group include Tfam+/+Foxp3Yfp-Cre and Tfamfl/+Foxp3Yfp-Cre unless otherwise noted.
(A) Foxp3 (YFP) expression in CD4+ T cells in multiple organs in 6-week-old mice of the indicated genotypes by flow cytometry. Thy, thymus; Sp, spleen; iLN, inguinal lymph node; mLN, mesenteric lymph node; SI, small intestine; LI, large intestine. Data are representative of three independent experiments.
(B) Treg percentages in CD4+ T cells in the indicated organs in 6-week-old Ctr (n = 5) and Tfamfl/flFoxp3Yfp-Cre (n = 5) mice (mean ± SD). Data were compiled from three independent experiments.
(C) Ratio of YFP+ Tregs/YFP−Tregs in the indicated organs in 6-week-old Tfamfl/flFoxp3Yfp-Cre/+ female mice (SI, n = 4; other organs, n = 5) (mean ± SD). Data were compiled from three independent experiments. ANOVA tests were performed for statistical significance.
(D) Histogram of cell traceviolet (CTV) dilution for Treg proliferation by flow cytometry. Splenic Tregs were cultured with IL-2 and anti-CD3/CD28-coated beads for 3 days in normal RPMI medium (11 mM glucose) with or without 2-DG (100 μM) or glucose-free RPMI medium. Data are representative of three independent experiments.
(E) FACS analysis of Foxp3 (YFP) expression (percentages and mean fluorescence intensity [MFI]) in in vitro-cultured Ctr or Tfam-deficient Tregs for 3 days under different culture conditions as described in (D). Data are representative of three independent experiments.
CD25, an IL-2 receptor highly expressed on splenic Tregs, did not show any notable change in Tregs between control and Tfamfl/flFoxp3Yfp-Cre mice (Figure S2I). Expression of canonical markers of tTregs, Nrp1 and Helios, was not obviously changed in Tregs of Tfamfl/flFoxp3Yfp-Cre mice (Figure S2I), suggesting that Tfam deletion in Tregs did not affect thymus-derived Treg development. In addition, iTreg differentiation from naive CD4+ T cells upon TGF-β stimulation was not affected by Tfam deficiency (Figure S2J).
To further rule out an indirect effect of systemic inflammation on Tregs, we generated Tfamfl/flFoxp3Yfp-Cre/+ female mice in which Tfam was deleted in yellow fluorescent protein (YFP)+ Tregs (cre-expressing Tregs) but not in YFP− Tregs. No obvious body abnormalities were observed between Tfamfl/flFoxp3Yfp-Cre/+ mice and littermate control mice Tfam+/+Foxp3Yfp-Cre/+ or Tfamfl/+Foxp3Yfp-Cre/+) (data not shown). We found a marked decrease in YFP+ Tregs in the gut, fat, and skin compared with other organs (thymus, spleen, iLNs, mLNs, liver, and lungs) (Figure 2C; Figure S3A), indicating cell-intrinsic regulation of Tregs by Tfam in certain peripheral organs. Given the low-glucose environment in the gut, fat, and skin (Angelin et al., 2017; Schaupp et al., 1999; Sternberg et al., 1995), we reasoned that Tfam might affect Tregs under low-glucose conditions. To this end, we cultured Tregs under various in vitro conditions. Although Tfam-sufficient Tregs proliferated equally well in glucose-free medium or with 2-DG (a glycolysis inhibitor) treatment compared with glucose-sufficient medium, Tfam-deficient Tregs had greatly reduced proliferation (Figure 2D; Figure S3B). Furthermore, Tfam-deficient Tregs lost more Foxp3 expression in glucose-free medium or with 2-DG treatment compared with control Tregs (Figure 2E; Figure S3C). These data suggest that Tfam-deficient Tregs are more sensitive to glucose deprivation in vitro.
Tfam Deficiency Affects Treg-Suppressive Function
We next asked whether Tfam regulates Treg-suppressive function. Compared with littermate control Tregs, intestinal Tfam-deficient Tregs produced less of the immunoregulatory molecules IL-10 and amphiregulin (Areg) but similar amounts of IL-17A and IFN-γ (Figures 3A–3D). To further determine whether Tfam deficiency affected Treg function, we conducted in vitro and in vivo Treg suppression assays. Tfam-deficient Tregs had a similar ability to suppress CD4+ T cell or CD8+ T cell proliferation in vitro compared with control Tregs (Figure S3D). However, in vivo, Tfam-deficient Tregs had impaired suppressive activity in the CD45RBhi T cell transfer model of colitis (Figures 3E–3G). Specifically, increased accumulation of CD4+ T cells, neutrophil infiltration, and production of the proinflammatory cytokines IFN-γ and IL-17A by effector CD4+ T cells were observed in the large intestine of recipient mice that received co-transferred naive CD4+ T cells and Tfam-deficient Tregs compared with those that received co-transferred control Tregs (Figure 3G; Figure S3E). A trend of reduction in transferred Tregs (CD45.2+)that were deficient in Tfam was also observed in the recipient mice (Figure S3E). Together, these results indicate that Tfam in Tregs is important for Treg-suppressive function.
Figure 3.
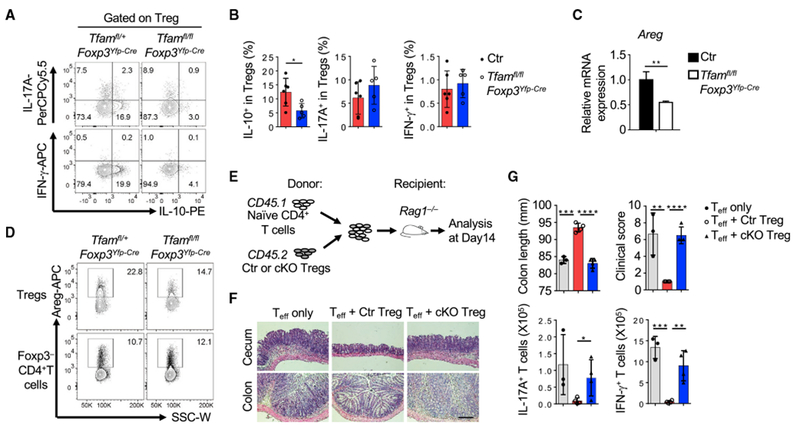
Tfam Deficiency in Tregs Affects Treg Function
Genotypes of the Ctr group include Tfam+/+Foxp3Yfp-Cre and Tfamfl/+Foxp3Yfp-Cre; conditional knockout (cKO) indicates Tfamfl/flFoxp3Yfp-Cre.
(A) Intracellular staining of IL-10, IL-17A, and IFN-γ expression in LI Tregs of the indicated genotypes by flow cytometry. Data are representative of two independent experiments.
(B) Percentages of IL-10+, IL-17A+, and IFN-γ+ Tregs from Ctr (n = 6) and Tfamfl/flFoxp3Yfp-Cre mice (n = 5).
(C) qRT-PCR of Areg (compared with Actb) expression in splenic Tregs of the indicated genotypes (n = 3). Data are representative of two independent experiments.
(D) Flow cytometry staining of Areg in LI Tregs or Foxp3− CD4+ T cells of the indicated genotypes. Data are representative of two independent experiments.
(E) Experimental design of the CD45RBhi T cell-induced colitis model.
(F) H&E staining of cecum and colon sections in the T cell-induced colitis model. Data are representative of two independent experiments.
(G) Colon length, colon clinical score, and IL-17A and IFN-γ production by CD4+ T cells in the T cell-induced colitis model (effector T cell [Teff] only, n = 3; Teff + Ctr Tregs, n = 4; Teff + cKO Tregs, n = 4 for F and G).
The data in (B), (C), and (G) are shown as mean ± SD.
Targeted Transcriptomic and Chromatin Regulation by Tfam in Tregs
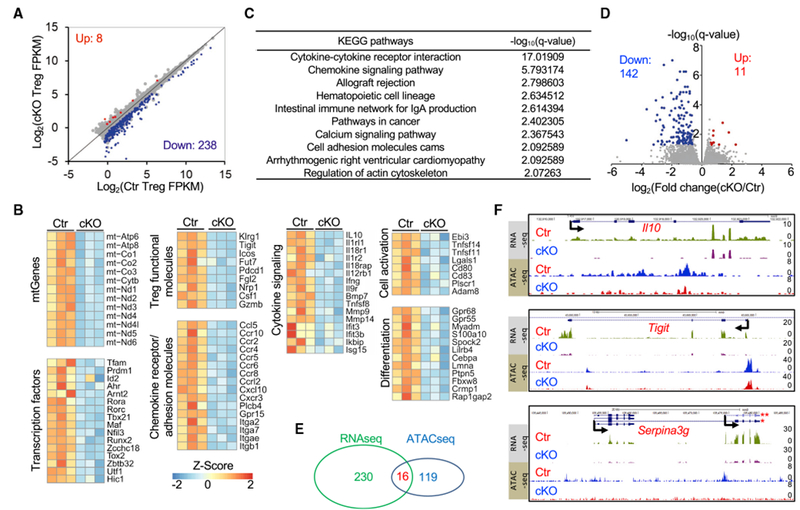
To gain more insight into how Tfam regulates the Treg transcriptional program, we performed high-throughput RNA sequencing (RNA-seq) analysis of YFP+ Tregs from the spleens and pLNs of Tfamfl/+Foxp3Yfp-Cre/+ and Tfamfl/flFoxp3Yfp-Cre/+ female mice. A total of 246 genes of 11,022 expressed genes (fragments per kilobase of transcript per million mapped reads [FPKM] ≥ 1 in either the control or Tfam-deficient group) were identified as significantly differentially expressed genes (DEGs) between control and Tfam-deficient Tregs (fold change ≥ 1.5, q ≤ 0.05) (Figure 4A). We further compared the list of reported Foxp3 directly bound and regulated genes in spleen and lymph node Tregs (333 DEGs) (Samstein et al., 2012; Zheng et al., 2007) and the differentially expressed gene list identified in control and Tfam-deficient spleen and lymph node Tregs in our current study (246 DEGs). Only 8 genes overlapped (Abcbla, Cobll1, Icos, Nrp1, Prdm1, Rnf125, Snx9, and Tnfsf11) (Figure S4A). These data suggest that differential regulation of these genes observed in Tfam-deficient Tregs was less likely to be directly regulated by Foxp3 but, instead, due to defects of Tfam expression and mitochondrial respiration. Among the 246 DEGs, 238 genes (96.7%) were decreased, whereas only 8 genes (Afap1, Zfp661, Slc25a27, Cfap74, Als2cl, Fbxo17, Npb, and Marco) (3.3%) were increased in Tfam-deficient Tregs (Figure 4A), suggesting that Tfam predominantly functions as a transcription activator in Tregs. Consistent with the crucial role of Tfam in regulation of mitochondrial gene transcription (Picca and Lezza, 2015), all mtDNA protein-coding genes (a total of 13) involved in the respiratory chain were significantly reduced in Tfam-deficient Tregs (Figure 4B). In addition, genes related to Treg function (e.g., Pdcd1, Icos, Tigit, Il10, Klrg1, and Il1rl1) were downregulated in Tfam-deficient Tregs (Figure 4B), consistent with impaired Treg-suppressive activity. Kyoto Encyclopedia of Genes and Genomes (KEGG) and Gene Ontology (GO) analyses of 246 differentially expressed genes revealed significant enrichment of the cytokine-cytokine receptor interaction and chemokine signaling pathways (Figures 4B and 4C; Figure S4B) between control and Tfam-deficient Tregs.
Figure 4.
Regulation of the Transcriptome and Chromatin Landscape by Tfam
A genotype of Ctr indicates Tfamfl/+Foxp3Yfp-Cre/+, whereas cKO indicates Tfamfl/flFoxp3Yfp-Cre/+ female mice.
(A) Differential gene expression pattern in RNA-seq analysis of YFP+ Tregs of Ctr and cKO mice (q ≤ 0.05, fold change ≥ 1.5). Sample size: Ctr, n = 3; cKO, n = 3. Each sample contained Tregs sorted from pooled Sp and peripheral LNs of 3–5 mice.
(B) Heatmap of gene clusters of differentially expressed genes (DEGs) between Ctr and cKO Tregs. mtGenes, mitochondrial genes.
(C) KEGG analysis of 246 DEGs between Cr and cKO Tregs.
(D) ATAC-seq peak FPKM distribution (volcano plot) of Ctr and cKO Tregs. 142 peaks were decreased, whereas 11 peaks were increased in cKO Tregs (q ≤ 0.05, fold change ≥ 1.5). Sample size: Ctr, n = 2; cKO, n = 2. Each sample contained Tregs sorted from pooled Sp and peripheral LNs of 2 mice.
(E) Venn diagram comparing DEGs identified by RNA-seq (246 genes) and 135 genes associated with 153 differentially regulated peaks identified by ATAC-seq.
(F) RNA-seq (top) and ATAC-seq (bottom) tracks at the Il10, Tigit, and Serpina3g lociin Tregs. *, Serpina3g transcript variant 1; **, Serpina3g transcript variant 2.
A recent study showed that genetic ablation of the mitochondrial complex III components Rieske iron-sulfur protein (RISP, encoded by Uqcrfs1) and ubiquinone-binding protein (QPC, encoded by Uqcrq) in Tregs affects mitochondrial respiration, leading to defective Treg function (Weinberg et al., 2019). Because Tfam is important for mitochondrial respiration (Baixauli et al., 2015), we compared the DEGs between control and Tfam-deficient spleen and lymph node Tregs in our study (246 DEGs) with the DEGs between control and RISP-deficient spleen and lymph node Tregs (fold change ≥ 1.5, q ≤ 0.05, a total of 185 DEGs). Despite regulation of genes that encode for mitochondrial complex I, III, IV, and V by Tfam Figure 4B), RNA-seq analysis showed different expression patterns regulated by Tfam and RISP (Figure S4C). Strikingly, a small cohort of 49 genes overlapped (Figure S4C; Table S1), among which four chemokine receptors or adhesion molecules (Ccr2, Ccr4, Itgae, and Gpr15) shared the differential expression pattern (Figure S4D), suggesting a critical role of mitochondrial respiration in regulating Treg homing.
Next, we used the assay for transposase-accessible chromatin sequencing (ATAC-seq) to determine whether Tfam deficiency affected general chromatin accessibility in Tregs. Among 91,731 identified DNA peaks, only 153 peaks associated with 135 genes showed a significant change between control and Tfam-deficient Tregs (Figures 4D and 4E; Figures S4E–S4G). Of note, 16 of the 135 genes showed differential expression, revealed by RNA-seq analysis (Figure 4E; Figure S4E). Among the 16 genes, Il10, Tigit, and Serpina3g, reported to be important for Treg function and/or regulated by Foxp3 (Dominguez-Villar and Hafler, 2018; Grinberg-Bleyer et al., 2010), were decreased at the transcriptional level, accompanied by lower chromatin accessibility in Tfam-deficient Tregs compared with control Tregs (Figure 4F). Together, our results suggest that Tfam positively regulates the expression of a select group of genes in Tregs through a mechanism primarily independent of changing chromatin accessibility.
Tfam Is Critical for Maintenance of ST2+KLRG1+ Tregs
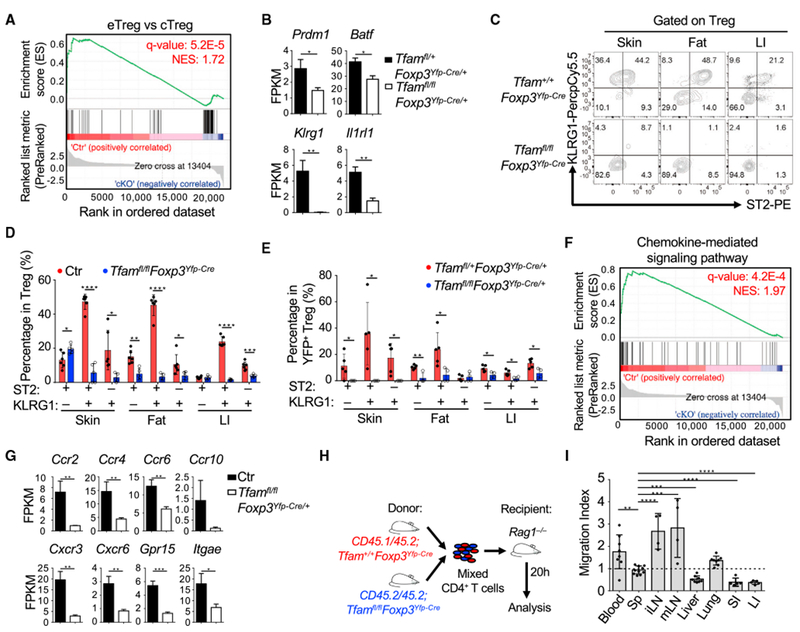
Gene set enrichment analysis (GSEA) of RNA-seq data indicated enrichment of an eTreg gene signature in control Tregs compared with a cTreg gene signature in Tfam-deficient Tregs (Figure 5A), suggesting that Tfam deficiency specifically affected the eTreg compartment. However, CD44 and CD62L expression between control and Tfam-deficient Tregs was not significantly changed either at the mRNA level, as shown by our RNA-seq results (data not shown), or at the protein level (Figures S5A and S5B). Prdm1 (encoding Blimp1) and Batf, important for eTreg maintenance and function (Cretney et al., 2011; Vasanthakumar et al., 2015), were significantly decreased in Tfam-deficient Tregs (Figure 5B).
Figure 5.
Tfam Is Essential for ST2+KLRG1+ Treg Generation and Controls Treg Homing
(A) GSEA analysis of all expressed genes (RNA-seq FPKM ≥ 1) in YFP+ Tregs from pooled Sp and peripheral LNs of Tfamfl/+Foxp3Yfp-Cre/+ (Ctr) and Tfamfl/flFoxp3Yfp-Cre/+ (cKO) female mice.
(B) FPKM values of the indicated genes of Tregs from Tfamfl/+Foxp3Yfp-Cre/+ (n = 3) and Tfamfl/flFoxp3Yfp-Cre/+ mice (n = 3).
(C) Flow cytometry staining of ST2 and KLRG1 in Tregs from 6-week-old mice of the indicated genotypes. Data are representative of three independent experiments.
(D) Percentages of ST2+KLRG1+ Tregs, ST2−KLRG1+ Tregs, and ST2+KLRGT Tregs (Ctr group includes Tfam+/+Foxp3Yfp-Cre and Tfamfl/+Foxp3Yfp-Cre, n = 6; Tfamfl/flFoxp3Yfp-Cre, n = 5). Data were compiled from two independent experiments.
(E) Percentages of ST2+KLRG1+ Tregs, ST2+KLRG1+ Tregs, and ST2+KLRG1− Tregs in Tfamfl/+Foxp3Yfp-Cre/+ (n = 5) and Tfamfl/fl Foxp3Yfp-Cre/+ (n = 4) female mice. Data were compiled from two independent experiments.
(F) GSEA analysis of all expressed genes (RNA-seq FPKM ≥ 1) between Ctr and cKO Tregs as described in (A).
(G) FPKM values of several differentially expressed chemokine receptors of Tregs from Ctr (Tfamfl/+Foxp3Yfp-Cre/+) (n = 3) and Tfamfl/flFoxp3Yfp-Cre/+ (n = 3) mice.
(H) Experimental design of the in vivo Treg homing or retention experiment.
(I) In vivo Treg homing or retention (migration index) as described in Figure S5E. Treg migration indices were normalized to the original ratio of CD45.1+CD45.2+ Ctr (Tfam+/+Foxp3YfpCre) Tregs/CD45.1−CD45.2+ Tfam-deficient (Tfamfl/flFoxp3Yfp-Cre) Tregs. Data were compiled from four independent experiments (n = 8 for blood, liver, and lungs; n = 11 for Sp; n = 4 for iLNs and mLNs; n = 5 for SI and LI).
The data in (B), (D), (E), (G), and (I) are shown as mean ± SD.
Klrg1 (encoding KLRG1) and Il1rl1 (encoding ST2), both highly expressed by eTregs, were also downregulated in Tfam-deficient Tregs (Figures 4B and 5B). ST2+KLRG1+ Tregs are abundantly present in peripheral tissues, such as the gut, skin, and fat, but less present in lymphoid organs (Cipolletta et al., 2012; Delacher et al., 2017; Schiering et al., 2014; Vasanthakumar et al., 2015). Consistent with mRNA data, ST2+KLRG1+ Tregs were greatly reduced in Tfamfl/flFoxp3Yfp-Cre mice compared with littermate control mice in peripheral organs such as the gut, skin, and fat (Figures 5C and 5D; Figure S5C). ST2+KLRG1+ Tregs were also greatly reduced in YFP+ Tregs from Tfamfl/flFoxp3Yfp-Cre/+ mice compared with YFP+ Tregs from Tfamfl/+Foxp3Yfp-Cre/+ mice (Figure 5E; Figure S5D). Our data suggest that Tfam plays a cell-intrinsic role in ST2+KLRG1+ Treg maintenance.
Tfam Deficiency Affects Treg Homing and Retention in Peripheral Non-lymphoid Tissues
GSEA of RNA-seq data revealed a significant difference in the chemokine-mediated signaling pathway between control and Tfam-deficient Tregs (Figure 5F). Specifically, chemokine receptors involved in lymphocytes homing to the skin (Ccr8 and Itage; Braun et al., 2015; Schaerli et al., 2004), liver (Ccr4 and Cxcr3; Oo et al., 2010), and small and large intestine (Ccr5, Ccr6, Ccr10, Gpr15, and Itgae; Fischer et al., 2016; Habtezion et al., 2016) were significantly reduced in Tfam-deficient Tregs (Figures 4B and 5G). We also performed an in vivo homing assay for Tregs by transferring mixed Treg-containing splenic CD4+ T cells from CD45.1/CD45.2-Tfam+/+Foxp3Yfp-Cre and CD45.2/CD45.2-Tfamfl/flFoxp3Yfp-Cre mice to Ragl−/− recipients to check Treg homing 20 h after adoptive cell transfer (Figure 5H). We failed to recover any Tregs from the skin at the time point after cell transfer (data not shown). In contrast to lymphoid tissue, spleen, and lymph nodes, we found that Tfam-deficient Tregs were less homed to the liver and small and large intestine (Figure 5I; Figure S5E), indicating that Tfam deficiency in Tregs impaired Treg homing and/or retention in selective non-lymphoid organs at the periphery.
Tfam Deficiency in Tregs Switches Oxidative Phosphorylation toward Glycolysis
Because Tfam controls the expression of mitochondrial gene-encoded proteins essential for respiration, we first measured mitochondrial mass by Mitotracker DeepRed staining. Paradoxically, the results showed an increase in mitochondrial mass in Tfam-deficient Tregs compared with control Tregs (Figures S6A and S6B). Similarly, mitochondrial membrane potential (MMP) staining by tetramethylrhodamine ethyl ester (TMRE), a cell-permeant fluorescent dye for active mitochondria, showed that MMP was also increased in Tfam-deficient Tregs (Figures S6A and S6B). In addition, by MitoSox staining, mitochondrial reactive oxygen species (ROS) showed an increase in Tfam-deficient Tregs compared with control Tregs (Figures S6A and S6B). Using a high-resolution confocal microscope, we found an increase in mitochondrial size in Tfam-deficient Tregs compared with control Tregs (Figure S6C), consistent with reported observations that mitochondrial size is compensatorily increased in Tfam-deficient cells compared with control cells (Baixauli et al., 2015; Larsson et al., 1998).
To further monitor the metabolic changes in Tregs, we measured the oxygen consumption rate (OCR), an indicator of mitochondrial respiration activity, and the extracellular acidification rate (ECAR), an indicator of glycolytic activity (Divakaruni et al., 2014). The data showed that basal, maximal, and coupled OCRs were significantly decreased in Tfam-deficient Tregs compared with control Tregs (Figures S6D and S6E). Tfam-deficient Tregs did not completely lose mitochondrial respiration activity (Figures S6D and S6E), consistent with residual but significantly reduced mitochondrial gene transcription (Figure S1C). In contrast, both basal and maximal ECARs were significantly increased in Tfam-deficient Tregs (Figures S6F and S6G). Uptake of 2-(N-(7-nitrobenz-2-oxa-1,3-diazol-4-yl) amino)-2-de-oxyglucose (2-NBDG), a fluorescent glucose analog for monitoring glucose uptake in live cells, was increased in Tfam-deficient Tregs compared with control Tregs (Figure S6H). Together, these data suggest that Tfam-deficient Tregs switch oxidative phosphorylation toward glycolysis.
Tfam Is Critical for Foxp3 Stability in Tregs
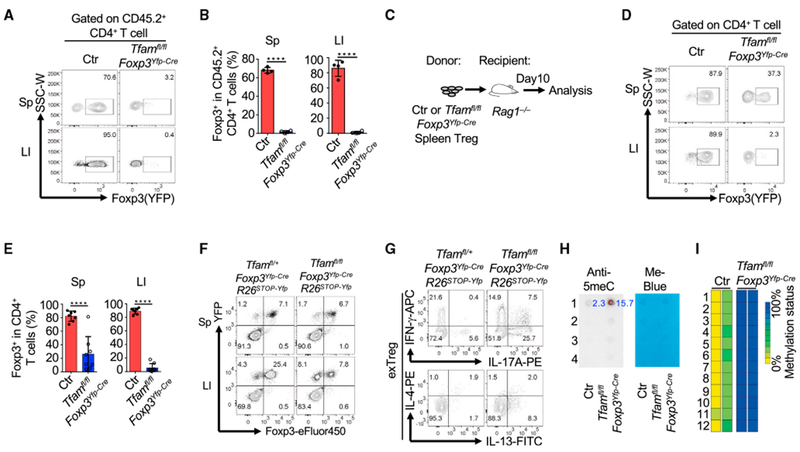
Maintenance of Foxp3 expression is critical for Treg-suppressive function (Rubtsov et al., 2010; Sakaguchi et al., 2013). In the CD45RBhi T cell transfer model of colitis (Figure 3E), although the majority of transferred control Tregs still maintained Foxp3 expression, almost all transferred Tfam-deficient Tregs lost Foxp3 expression (Figures 6A and 6B). Because the inflammatory environment present in the T cell transfer model of colitis may cause a decrease in Foxp3 expression (Zhou et al., 2009), we next transferred control or Tfam-deficient Tregs alone to Ragl−/− recipient mice and assessed Foxp3 expression (Figure 6C). Consistently, Tfam-deficient Tregs had greatly reduced Foxp3 expression, whereas control Tregs maintained Foxp3 expression (Figures 6D and 6E). A Foxp3 genetic fate mapping experiment further showed an increase in exTregs in Tfamfl/flFoxp3Yfp-CreRosa26STOP-Yfp mice compared with Tfamfl/+Foxp3Yfp-CreRosa26STOP-Yfp mice (Figure 6F). In addition, exTregs in Tfamfl/flFoxp3Yfp-CreRosa26STOP-Yfp mice produced more inflammatory cytokines, such as IL-17A and IL-13, than exTregs in Tfamfl/+Foxp3Yfp-CreRosa26STOP-Yfp mice (Figure 6G), suggesting an enhanced proinflammatory phenotype of exTregs in Tfamfl/flFoxp3Yfp-CreRosa26STOP-Yfp mice. Collectively, our results demonstrated that Tfam was critical for maintaining Treg stability in a cell-intrinsic manner.
Figure 6.
Tfam Is Critical for Maintaining Treg Stability
Genotypes of the Ctr group include Tfam+/+Foxp3Yfp-Cre and Tfamfl/+Foxp3Yfp-Cre unless otherwise noted.
(A) Maintenance of Foxp3 expression in transferred Tregs(gated on CD45.2+CD4+ T cells) from the T cell-induced colitis model described in Figure 3E. Sp, spleen; LI, large intestine. Data are representative of two independent experiments.
(B) Percentages of Foxp3+ cells in CD45.2+CD4+ T cells. Data are representative of two independent experiments and are shown as mean ± SD (Ctr, n = 4; Tfamfl/flFoxp3Yfp-Cre, n = 4).
(C) Experimental design of transferring Ctr or Tfam-deficient Tregs to Rag1−/− mice. Data were collected on day 10.
(D) Foxp3 (YFP) expression in transferred Tregs from the Sp and LI by flow cytometry. Data are representative of three independent experiments.
(E) Percentages of Foxp3+ cells among transferred Tregs. Data were compiled from three independent experiments and are shown as mean ± SD (Ctr, n = 7; Tfamfl/flFoxp3Yfp-Cre, n = 8).
(F) Foxp3 and YFP staining in CD4+ T cells in Tfamfl/+Foxp3Yfp-CreRosa26Stop-YFP and Tfamfl/lfFoxp3Yfp-CreRosa26Stop-YFP mice by flow cytometry. Data are representative of two independent experiments.
(G) IFN-γ, IL-17A, IL-4, and IL-13expression in exTregs(gated on YFP+Foxp3−) by intracellular staining followed by flow cytometry. Data are representative of two independent experiments.
(H) Anti-5-meC dot blot (left) and methylene blue staining (right) of genome DNA extracted from Tregs from 6-week-old Ctr and Tfamfl/flFoxp3Yfp-Cre mice. 1,2,3, and 4 indicate 4 dots of genome DNA loading titration as 250 ng, 125 ng, 67.5 ng, and 33.75 ng, respectively. Numbers in blue are normalized integrated density (ID) of dot blotting signals (calculation formula: (ID-anti5meCTreg − ID-anti5meCbackground)/(ID-Me-blueTreg − ID-Me-bluebackground)). Data are representative of two independent experiments.
(I) Methylation analysis of the TSDR at the Foxp3 CNS2 region of Ctr and Tfam-deficient Tregs. Tregs were collected from LIs as shown in (C). 1–12 indicate 12 methylation loci at the Foxp3 CNS2 region. Ctr, n = 2; Tfamfl/flFoxp3Yfp-Cre, n = 2.
Dysregulated Mitochondrial Metabolism Results in DNA Hypermethylation
Mitochondrial metabolism metabolites, such as acetyl-coenzyme A(CoA), α-ketoglutarate (α-KG), 2-hydroxyglutarate(2-HG), succinate, and fumarate, are not only intermediates generated during the tricarboxylic acid (TCA) cycle but are also important for modulating gene expression through epigenetic mechanisms (Carey et al., 2015; Mehta et al., 2017).
5-Methylcytosine (5meC) is a methylated cytosine form of genome DNA involved in suppression of gene transcription (Breiling and Lyko, 2015; Shen et al., 2014). We next checked whether Tfam deficiency in Tregs altered the DNA 5meC level. To this end, we purified Tregs from the spleen and pLNs of control and Tfam-deficient mice and subjected them to a DNA dot blot assay using a 5meC antibody. The results showed hyperme-thylation of genomic DNA in Tfam-deficient Tregs compared with control Tregs (Figure 6H), suggesting that Tfam regulates DNA methylation in Tregs.
Because DNA demethylation in the Treg-specific demethylation region (TSDR) of the Foxp3 locus is critical for Foxp3 stability (Li and Zheng, 2015), we determined the effect of Tfam deletion on the TSDR in Tregs. Methylation of the TSDR did not change in gut Tregs isolated from control or Tfamfl/flFoxp3YFP-Cre mice, presumably because of the fact that the analyzed cells were YFP+ and may represent Treg escapers that are independent of Tfam (data not shown). Thus, we transferred purified splenic control and Tfam-deficient Tregs to Rag1−/− mice and determined methylation of the TSDR in donor cells recovered from the gut 7 days after cell transfer (Figure 6C). Our data showed that the TSDR at the Foxp3 locus was largely methylated in Tfam-deficient Tregs compared with control Tregs (Figure 6I), consistent with destabilized Foxp3 expression in the absence of Tfam.
Tfam Deficiency Affects Treg Maintenance in the Tumor Microenvironment and Anti-tumor Immunity
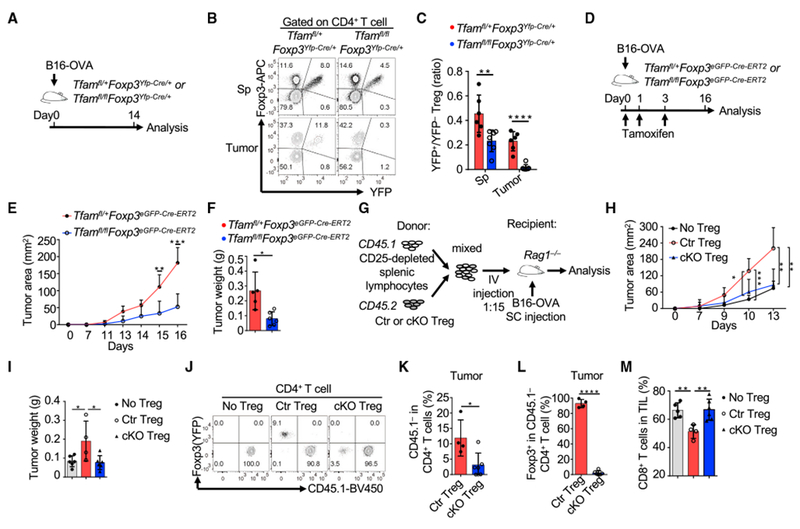
Tumors have been reported to be a low-glucose and high-lactate environment and to provide a highly glucose-competitive niche for immune cells (Gullino et al., 1964; Ho et al., 2015). Because Tfam-deficient Tregs were more dependent on glucose for proliferation and maintenance of Foxp3, we next asked whether Tfam deficiency in Tregs also impairs Treg maintenance in tumors. A recent report showed that B16 melanoma has a comparatively elevated glycolytic environment (Cascone et al., 2018). To this end, B16-ovalbumin (OVA) tumor cells were injected into Tfamfl/+Foxp3Yfp-Cre/+ and Tfamfl/flFoxp3Yfp-Cre/+ female littermate mice (Figure 7A), which do not have the inflammatory diseases observed in adult Tfamfl/flFoxp3Yfp-Cre mice. Our data showed that YFP+ Tregs were markedly reduced, especially in tumor tissues of Tfamfl/flFoxp3Yfp-Cre/+ mice (Figure 7B, C), suggesting that Tfam-mediated mitochondrial respiration is critical for Treg maintenance in tumors.
Figure 7.
Tfam Deficiency in Tregs Affects Treg Maintenance in Tumors
Genotypes of the Ctr group include Tfam+/+Foxp3Yfp-Cre and Tfamfl/+Foxp3Yfp-Cre, whereas cKO indicates Tfamfl/flFoxp3Yfp-Cre in (G)–(M).
(A) Experimental design of the B16-OVA model.
(B) Flow cytometry staining of Foxp3 and YFP in CD4+ T cells of mice with the indicated genotypes. Data are representative of two independent experiments.
(C) Ratio of YFP+ Tregs/YFP− Tregs in Sps and tumors in Tfamfl/+Foxp3YFP-Cre/+ (n = 6) and Tfamfl/flFoxp3Yfp-Cre/+ mice (n = 7). Data were compiled from two independent experiments.
(D) Experimental design of the B16-OVA model.
(E) Tumor growth in Tfamfl/+Foxp3eGFP-Cre-ERT2 (n = 6) or Tfamfl/flFoxp3eGFP-Cre-ERT2 mice (n = 6). Data were compiled from two independent experiments.
(F) Weight of tumors collected on day 16 (n = 6 for each genotype) from (E). Data were compiled from two independent experiments.
(G) Experimental design of the B16-OVA challenge in the T cell co-transfer model.
(H) Tumor growth in Rag1−/− mice receiving transferred CD45.1+ CD25-depleted total splenic lymphocytes alone (n = 6) or together with Ctr (n = 6) or cKO Tregs (n = 7). Data were compiled from three independent experiments.
(I) Weight of tumors collected on day 13 in (H). Data were compiled from three independent experiments.
(J) CD45.1 and Foxp3 (YFP) staining in tumor CD4+ T cells by flow cytometry. Data are representative of two independent experiments.
(K) Percentages of CD45.1−CD4+ T cells among total CD4+ T cells. Ctr Treg group, n = 4; cKO Treg group, n = 6. Data were compiled from two independent experiments.
(L) Percentages of Foxp3+ cells among CD45.1−CD4+ T cells. Ctr Treg group, n = 4; cKO Treg group, n = 6. Data were compiled from two independent experiments.
(M) Percentages of CD8+ T cells in total tumor-infiltrating lymphocytes (TILs). No Treg group, n = 5; Ctr Treg group, n = 4; cKO Treg group, n = 6. Data were compiled from two independent experiments.
The data in (C), (E), (F), (H), (I), and (K)–(M) are shown as mean ± SD.
Impairment of Tregs and their suppressive function has been reported to promote tumor rejection (Klages et al., 2010; Kline et al., 2012; Pedros et al., 2017; Yu et al., 2018). To determine the role of Tfam in Tregs in tumor immunity, we crossed Tfamfl/fl mice with Foxp3eGFP-Cre-ERT2 mice (whose Cre nuclear localization and subsequent gene deletion were induced by tamoxifen) to specifically and inducibly delete Tfam in Tregs and subsequently challenged the mice with B16-OVA (Figure 7D). Our data showed that Tregs were significantly decreased in tumor tissues but not in the spleen upon tamoxifen treatment (Figure S7A). A marked reduction in the Treg to Foxp3−CD4+ T cell ratio and Treg to CD8+ T cell ratio in tumors (Figures S7B and S7C), consistent with tumor growth retardation, was observed in Tfamfl/flFoxp3eGFP-Cre-ERT2 mice compared with Tfamfl/+Foxp3eGFP-Cre-ERT2 mice (Figures 7E and 7F; Figure S7D).
To further determine the role of Tfam in Treg-mediated tumor immunity, we co-transferred CD25-depleted total splenic cells (from CD45.1/CD45.1 C57BL/6 mice) with control or Tfam-deficient Tregs (CD45.2/CD45.2) to Rag1−/− recipient mice that were injected with B16-OVA tumor cells (Figure 7G). Consistent with the literature (Pedros et al., 2017), mice receiving co-transferred CD25-depleted splenic cells and control Tregs showed faster tumor growth than mice receiving CD25-depleted splenic cells only. Notably, we found that mice receiving co-transferred CD25-depleted splenic cells and Tfam-deficient Tregs controlled tumors more efficiently compared with those receiving co-transferred Tfam-sufficient Tregs (Figures 7H and 7I; Figure S7E). Fewer tumor-infiltrating CD45.1−CD4+ T cells (i.e., donor Tregs) were recovered from tumors of mice receiving Tfam-deficient Tregs compared with mice receiving control Tregs (Figures 7J and 7K). Furthermore, Tfam-deficient Tregs severely lost Foxp3 expression compared with control Tregs (Figures 7J and 7L). Accordingly, more tumor-infiltrating CD8+ T cells were found in mice receiving Tfam-deficient Tregs compared with those receiving control Tregs (Figure 7M). Together, these data suggested that Tfam-deficient Tregs were less maintained in the tumor microenvironment, resulting in augmented anti-tumor immunity.
DISCUSSION
Despite the impairment of mitochondrial respiration in Tregs, Treg maintenance was not affected by Tfam ablation in the steady state in lymphoid organs but perturbed in certain nonlymphoid organs and tissues, such as the fat, gut, and skin. In tumors, Treg maintenance and Foxp3 stability were also markedly affected by Tfam deficiency. It is known that certain organs, such as the fat, skin, and gut, under physiological conditions, share with the tumor microenvironment a low-glucose tissue milieu. We hypothesized that Tfam in Tregs conveys a different sensitivity to environmental glucose changes so that lack of Tfam will affect Tregs in certain tissues. Consistent with this notion, Tfam deficiency impaired Treg proliferation and Foxp3 expression by inhibition of the glycolysis pathway in vitro. Of note, in vivo proliferation of Tfam-deficient Tregs appeared to be unchanged based on Ki67 staining (data not shown), at least in the gut, suggesting that yet to be defined factors and/or metabolic changes in vivo may compensate for the glucose reduction.
Several metabolites from the mitochondrial TCA cycle (e.g., acetate, α-KG, succinate, and fumarate) have been reported to regulate gene expression through epigenetic modifications, such as DNA methylation or demethylation and histone acetylation, methylation, or demethylation (Carey et al., 2015; Mehta et al., 2017). Given that Illrll and Klrgl were among the most significantly decreased genes identified in RNA-seq data, we analyzed the Illrll and Klrgl loci that contain active H3K4me3 and H3K27ac modifications reported previously (Li et al., 2018b). However, we did not find obvious decreases in H3K4me3 or H3K27ac levels at the Illrll and Klrgl loci in Tfam-deficient Tregs compared with control Tregs (data not shown), suggesting that the decrease in gene expression, at least for Illrll or Klrgl in Tregs, was not due to a defect in these histone modifications at the Illrll or Klrgl locus. Deletion of Uqcrfsl, a gene encoding the mitochondrial complex III subunit RISP, has been reported to increase the fumarate/α-KG and succinate/α-KG ratios (Ansó et al., 2017), which inhibit DNA demethylation and increase the DNA methylation level in RISP-deficient cells (Ansó et al., 2017; Carey et al., 2015). Consistently, we found more DNA methylation in Tfam-deficient Tregs compared with control Tregs. Specifically, we found that DNA was hypermethylated at the TSDR of the Foxp3 locus, which resulted in loss of Foxp3 stability specifically in peripheral tissues (e.g., the gut).
Targeting metabolism for cancer therapy has been investigated for several decades (Luengo et al., 2017). Although cancer cells largely increase glucose consumption and lactate production (called the Warburg effect), mitochondrial respiration inhibitors can block cancer cell proliferation, suggesting that mitochondrial respiration is still required for cancer cell proliferation (Schieber and Chandel, 2013; Weinberg et al., 2010; Wheaton et al., 2014; Zhang et al., 2014). Both metformin and AG311, inhibitors of mitochondrial complex I, have been reported to cooperate with other therapies to resolve cancer regression in some human and mouse tumors (Bastian et al., 2017; Jiralerspong et al., 2009; Wheaton et al., 2014). The mechanism of these chemicals in cancer therapy is thought to work, at least partially, through inhibition of tumor cell growth (Wheaton et al., 2014). However, the current work suggests that the effect of inhibition of mitochondrial respiration in tumor-infiltrating lymphocytes needs to be considered. We found that inhibition of mitochondrial respiration in Tregs compromised Treg maintenance in the tumor environment but not in lymphoid tissues, resulting in promoted tumor rejection. Of note, recent research showed that reprogramming metabolism by enforcing PCG-1α expression, which promotes mitochondria biogenesis, or inhibition of glycolysis in CD8+ T cells inhibits tumor growth, indicating that mitochondrial respiration promotes the anti-tumor activity of CD8+ T cells (Scharping et al., 2016; Sukumar et al., 2013). It is intriguing that certain tumors, such as melanoma, have been reported to have higher glycolytic activity, contributing to immunoevasion (Cascone et al., 2018). Thus, targeted metabolic regulation of Tregs by specific inhibition of mitochondrial respiration in tumor-infiltrating Tregs may break the tolerance and warrants future consideration for certain cancer therapies.
STAR★METHODS
LEAD CONTACT AND MATERIALS AVAILABILITY
Further information and requests for resources and reagents should be directed to and will be fulfilled by the Lead Contact, Liang Zhou (liangzhou497@ufl.edu).
EXPERIMENTAL MODEL AND SUBJECT DETAILS
Mice
All mice used in this study were maintained in SPF or Germ-free facilities at the University of Florida. The mice were littermate controlled and were 6-8 weeks old for experiments unless otherwise noted. Tfamfl/fl mice were kindly provided by Navdeep Chandel (Northwestern University). Foxp3Yfp-Cre, Foxp3eGFP-Cre-ERT2 mice, CD45.1homo, Rag1−/− and ROSA26Stop-YFP mice were purchased from Jackson Laboratory. Cd4-Cre mice were purchased from Taconic Farms and breed in University of Florida. Experiments were performed with both male and female littermate animals of each genotype unless otherwise indicated. All studies with mice were approved by the Animal Care and Use Committees of the University of Florida.
METHOD DETAILS
Lymphocytes isolation and flow cytometry
The isolation of lymphocytes from thymus, spleen, peripheral/mesenchymal lymph nodes and intestinal lamina propria were performed as previously described (Ye et al., 2017). Lung lymphocyte isolation was conducted by digesting minced lung tissues with collagenase IV (Sigma) and DNase I (Sigma) at 37°C for 90 min. Fat lymphocyte isolation was conducted by digesting minced peritoneal adipose tissues with collagenase II (Sigma) with DNase I at 37°C for 90 min. Skin lymphocyte isolation was conducted by digesting minced ear skin tissues with collagenase IA (Sigma) with DNase I at 37°C for 60 min. After digestion, cells were further purified from the interphase of 37.5% and 75% Percoll gradient after 18 minutes spin at 2,500 rpm at room temperature. For flow cytometry analysis, the live and dead cells were stained by Live and Dead violet viability kit (Invitrogen) or Zombie Aqua fixable viability kit (BioLegend). CD16/32 antibody (Thermo Fisher) was used to block the nonspecific binding followed by surface molecule staining at 4°C for 30 min. Cells were fixed and permeabilized with Foxp3 staining buffer Kit (eBioscience) for transcription factor staining. For cytokine staining, cells were stimulated with 50 ng/ml PMA and 500 ng/ml ionomycin for 4 hours and Brefeldin A (2 mg/ml) was added 2 hours before cells were harvested. Sample acquisition was performed on BD FACSCantoII or LSRFortessa flow cytometer and analyzed with FlowJo software (version 10.2). For some experiments, spleen or LN lymphocytes were enriched with CD4+ T cell isolation kit (Stemcell). BD FACSAriaII or Sony sorter SH800 were used for cell sorting.
Adoptive T cell transfers and T cell-mediated transfer model of colitis
Cells with indicated number were transferred to gender- and age-matched recipient mice through intravenous injection unless otherwise noted. Mice were sacrificed for analysis at indicated time after transfer. CD45RBhi T cell transfer model of colitis was conducted as previously described(Ye et al., 2017). Sorted naive 4 × 10⁵ CD4+CD25−CD45RBhigh cells from the pooled spleen and lymph nodes of CD45.1+ congenic mice were intravenously injected into Rag1−/− mice with or without 2 × 10⁵ CD4+YFP+ splenic Tregs sorted from CD45.2+Tfamfl/+Foxp3Yfp-Cre or Tfamfl/flFoxp3Yfp-Cre mice. The mice were sacrificed for analysis 2 weeks after cell transfer.
Tumor model
For tumor model in Tfamfl/flFoxp3eGFP-ERT2-Cre mice, B16-F10-OVA (5 × 10⁵) was s.c. injected at day 0 and tamoxifen (8mg/mouse) was i.p. injected at day 0,1,3 in 8-week-old mice. For tumor model in Tfamfl/flFoxp3Yfp-Cre/+ mice, B16-F10-OVA (5 × 10⁵) was s.c. injected. Cell co-transfer model of tumor was conducted as described (Pedros et al., 2017). Basically, 15 × 106 CD25-depleted total splenic lymphocytes from CD45.1 mouse and 1 × 10⁶ Tregs sorted from CD45.2 control or Tfamfl/flFoxp3Yfp-Cre mice were mixed and co-transferred to 8-week-old Rag1−/− mice. B16-F10-OVA (5 × 10⁵) cells were s.c. injected on the same day. Tumor growth was monitored with digital caliper.
Cell culture
Unless otherwise noted, Tregs were cultured in RPMI-1640 medium (plus β-mercaptoethanol) supplemented with 10% fetal bovine serum, 1% L-glutamine, 1% penicillin-streptomycin, 50 ng/ml IL-2 and anti-CD3/CD28 coated Dynabeads (Thermo Fisher) at 1:1 ratio (cells: beads). For glucose challenge experiments, glucose-free RPMI-1640 medium (Thermo Fisher, 1187020) were used. 2-DG was purchased from Sigma (D8375). For in vitro iTreg differentiation, 24-well plates were pre-coated with 40 μg/ml anti-hamster antibody (MP Biomedical). CD4+CD25−CD44−CD62L+ naive T cells were sorted and cultured for 3 days in IMDM (Sigma-Aldrich) supplemented with 0.25 μg/ml anti-CD3 (145-2C11), 1 μg/ml anti-CD28 (37.51), 2 μg/ml anti-IL-4 (11B11), 2 αg/ml anti-IFN-γ (XMG1.2) and 5 ng/ml TGF-β. For in vitro Treg suppression assay, splenocytes from CD45.1+ mice were labeled with Cell Trace Violet (Thermo Fisher) and cultured with or without various ratio of sorted splenic Tregs from control or Tfamfl/flFoxp3Yfp-Cre mice. Cells were cultured for 3d with soluble 1 μg/ml anti-CD3/CD28. The division of CD45.1+CD4+ T cells were assessed by the dilution of Cell Trace Violet.
Quantitative PCR
Total RNA was isolated with Trizol reagent (Invitrogen). cDNA was synthesized by GoScript Reverse Transcription kit (Promega). Real-time PCR was performed using SYBR Green (Biorad) and different primer sets (Table S2). Reactions were run using the CFX connect Real-Time PCR Detection System (Biorad). Each specific gene expression was normalized to β-actin expression. For mitochondrial DNA quantification, total DNA was isolated with QIAGEN DNeasy Blood &Tissue Kit (69504). Mitochondrial DNA abundancy (ND-1) was normalized to β-globin. Primer sequences for PCR were listed in Table S2.
Mitochondria staining
Treg mitochondria, mitochondrial membrane potential or mitochondrial ROS staining were performed in RPMI-1640 medium or PBS supplemented with MitoTracker Deep Red FM (Sigma, M22426) or MitoTracker Orange CMTMRos (Sigma, M7510) or MitoTracker Red CMXRos (Sigma, M7512) or MitoSOX Red (Sigma, M36008) orTMRM (Thermo Fisher, T668) orTMRE (Thermo Fisher, T669) at 37°C for 30 min. Cells were analyzed by flow cytometry (BDCantoII) or confocal microscope (Zeiss 710 confocal microscope).
OCR and ECAR measurements
OCR and ECAR in Tregs were measured in an XF96 extracellular flux analyzer (Seahorse Bioscience) as previous described (Anso et al., 2013,2017). Tregs were purified from pooled spleens and pLNs from 3 to 5 control or Tfamfl/flFoxp3Yfp-Cre mice for each sample. Cells were cultured in Seahorse medium during measurement. Cells were recovered in 37°C in RPMI-1640 medium-complete for 1h after sorting. Basal OCR was calculated by subtracting the OCR values after treatment with antimycin A and rotenone (Sigma) from the OCR values before oligomycin (Sigma) treatment. Maximal OCR was calculated by subtracting the OCR values after treatment with antimycin A and rotenone from the OCR values after CCCP (Sigma) treatment. Coupled respiration was determined by the subtraction of oligomycin A values from basal respiration values. Glycolytic flux was measured by the sensitivity of the extracellular acidification rate after 2-DG treatment.
RNA-Seq and ATAC-Seq analyses
Total RNA was extracted from about 1 × 10⁶ sorted YFP+ Tregs pooled from spleen and lymph node of 2 to 3 Tfamfl/+Foxp3Yfp-Cre/+ or Tfamfl/flFoxp3Yfp-Cre/+ female littermate mice with RNAeasy Mini Kit (QIAGEN), followed by DNase treatment (TURTBO DNA-freeTM Kit). mRNA was purified with NEBNext Poly(A) mRNA Magnetic Isolation kit (NEB) and RNA-seq libraries were generated using NEBNext Ultra II RNA library Prep Kit (NEB). Barcoded samples were sequenced on an Illumina HiSeq 2500 instrument to produce 50 bp single-end reads. The sequencing reads were mapped with HISAT2 to the Mus musculus genome (mm9 and mm10 assembly) and filtered for uniquely mapped reads. Quantitated mRNA expression levels, FPKM and count aligned reads, were calculated based on exon regions using the cufflinks and HTSeq respectively. Significantly changed genes (FPKM > 1 in either control or Tfam-deficient Treg group, fold change ≥ 1.5, q-value ≤ 0.05) were identified by DESeq2 analysis. Gene Set Enrichment Analysis were performed for GO and KEGG analysis. For ATAC-seq, 5×10⁴ sorted splenic Tregs were lysed in lysis buffer (10 mM Tris-HCl pH 7.4, 10 mM NaCl, 3 mM MgCl2, 0.1% IGEPAL CA-630). Pelleted nuclei were resuspended in transposition reaction mix with Tn5 transposase (Illumina) and incubated at 37°C for 30 min. The DNA was purified with MinElute PCR Purification Kit (QIAGEN) and was used as a template of PCR with 10 cycles of amplification. The library was cleaned up with 1.2x SPRIselect beads (Beckman Coulter) before sequencing with Illumia HiSeq 2500. ATAC-Seq reads were mapped to the mouse genome (mm9) with bowtie2. The mapped reads were filtered using samtools. Peak calling was performed with Homer and qualified with HTSeq and DESeq2. Genome-wide peaks were visualized with NGSplot.
DNA methylation dot blot analysis
DNA methylation dot blot analysis was conducted as previously described(Tran et al., 2017). Genome DNA were isolated with DNeasy Blood &Tissue Kit (QIAGEN) followed by 99°C denaturing for 5 min. Genome DNA were loaded on nylon membrane (Amersham) and air dry for 5 min. 30 s UV light exposure was conducted. DNA-bonded membranes were blocked in 5% milk and stained with anti-5-methylcytosine antibody (Millipore, MABE146) at 4°C overnight. After 3 times wash with 0.1% PBT (0.1% tween 20 in 1x PBS), membranes were blotted with HRP-conjugated goat anti-mouse second antibody for 30 min. The dot blot signal was visualized using BioRad ChemiDoc XRS+ system. DNA-loaded membranes were incubated with 0.02% methylene blue (Sigma, M9140) for 10 min for methylene blue staining.
TSDR methylation analysis
TSDR methylation analyses were performed as previously described (Ye et al., 2017). Briefly, genomic DNA of indicated cells were isolated with DNeasy tissue kit (QIAGEN). Bisulfate conversion was performed with EZ DNA methylation Kit (Zymo Research). The primer sequences to amplify Foxp3 CpG island region are 5′-GGATTTGAATTGGATATGGTTTGTTTAG-3′ and 5′-CAACCTTAAACCCCTCTAACATCCAAA-3′. The PCR product was cloned using pGEM-T easy vector system (Promega) for sanger sequencing using T7 primer.
QUANTIFICATION AND STATISTICAL ANALYSIS
All data are represented as mean ± SD and have at least n = 3 per group (refer to figure legend to detailed information). Unless otherwise noted, statistical analysis was performed with the unpaired Student’s t test. ANOVA tests were performed for statistical significance for Figure 2C. Statistical analysis were run using GraphPad Prism 7.04 software package. P values were indicated with asterisks (*p ≤ 0.05; **p ≤ 0.01; ***p ≤ 0.001; ****p ≤ 0.0001).
DATA AND CODE AVAILABILITY
The accession number of the RNA-sequencing and ATAC-sequencing data from control and Tfam-deficient Tregs files reported in this paper is GEO: GSE131883.
Supplementary Material
KEY RESOURCES TABLE
| REAGENT or RESOURCE | SOURCE | IDENTIFIER |
|---|---|---|
| Antibodies | ||
| Anti-mouse CD3e-FITC (clone 145-2C11) | Tonbo Biosciences | Cat# 35-0031-U500; RRID: AB_2621659 |
| Anti-human/mouse CD45RB-PE (clone C363.16A) | eBioscience | Cat# 12-0455-83; RRID: AB_465681 |
| Anti-mouse CD16/CD32-FITC (clone 2.4G2) | Tonbo Biosciences | Cat# 35-0161-U100; RRID: AB_2621681 |
| Anti-mouse CD45.1-APC-Cy7 (clone A20) | Tonbo Biosciences | Cat# 25-0453-U100; RRID: AB_2621629 |
| Anti-human/Mouse-RORgt-PE (clone AFKJS-9) | eBioscience | Cat# 12-6988-82; RRID: AB_1834470 |
| Anti-mouse KLRG1-PerCP-eFluor 710 (Clone 2F1) | eBioscience | Cat# 46-5893-82; RRID: AB_10670282 |
| Anti-mouse IL-13-Alexa Fluor 488 (clone eBio13A) | eBioscience | Cat# 53-7133-82; RRID: AB_2016708 |
| Anti-human/mouse IL-22-APC (clone IL22JOP) | eBioscience | Cat# 17-7222-82; RRID: AB_10597583 |
| Anti-mouse CD45.1-PerCP-Cy5.5 (cloneA20) | eBioscience | Cat# 45-0453-82; RRID: AB_1107003 |
| Anti-mouse CD45.2-PerCP-Cy5.5 (clone 104) | eBioscience | Cat# 45-0454-82; RRID: AB_953590 |
| Anti-GATA3 (Clone L50-823) | 3D Biosciences | Cat# 558686; RRID: AB_2108590 |
| Anti-mouse T1/ST2(IL-33R)-PE (Clone DJ8) | MD bioscience | Cat# 101001PE; RRID: AB_947550 |
| Anti-mouse/human IL-5-Brilliant Violet 421 (clone TRFK5) | BioLegend | Cat# 504311; RRID: AB_2563161 |
| Anti-mouse CD25-PE-Cy7 (clone PC61) | BioLegend | Cat# 102015; RRID: AB_312864 |
| Anti-mouse Amphiregulin-Biotin (Polyclonal) | R&D | Cat# BAF989; RRID: AB_2060662 |
| Anti-mouse Foxp3-eFluor 450 (Clone FJK-16s) | eBioscience | Cat# 48-5773-82; RRID: AB_1518812 |
| Anti-mouse/rat Nrp1-APC (Polyclonal) | R&D | Cat# FAB566A; RRID: AB_2267476 |
| Anti-Helios-PE-Cy7 (Clone 22F6) | eBioscience | Cat# 25-9883-42; RRID: AB_2637136 |
| Anti-mouse CD4-APC-Cy7 (Clone GK1.5) | Tonbo Biosciences | Cat# 25-0041-U100; RRID: AB_469575 |
| Anti-mouse TCRβ-PerCP Cy5.5 (Clone H57-597) | Tonbo Biosciences | Cat# 65-5961-U100; RRID: AB_2621911 |
| Anti-mouse TCRβ-eFluor 450 (Clone H57-597) | eBioscience | Cat# 48-5961-82; RRID: AB_11039532 |
| Anti-mouse CD8α-APC-Cy7 (Clone 53-6.7) | BioLegend | Cat# 100714; RRID: AB_312753 |
| Anti-human/mouse CD44-APC (Clone IM7) | eBioscience | Cat# 17-0441-83; RRID: AB_469390 |
| Anti-mouse CD62L-PE-Cy7 (Clone MEL-14) | eBioscience | Cat# 25-0621-82; RRID: AB_469633 |
| Anti-mouse IL-17A-PerCP-Cy5.5 (Clone eBio17B7) | Invitrogen | Cat# 45-7177-82; RRID: AB_925753 |
| Anti-mouse IFNγ-APC (Clone XMG1.2) | eBioscience | Cat# 17-7311-82; RRID: AB_469504 |
| Anti-mouse IL-10-PE (Clone JES5-16E3) | Invitrogen | Cat# 12-7101-82; RRID: AB_468435 |
| Anti-mouse TNF-PE-Cy7 (Clone MP6-XT22) | Invitrogen | Cat# 25-7321-82; RRID: AB_11042728 |
| Anti-cleaved Caspase3 (Polyclonal) | Cell Signaling | Cat# 9661S; RRID: AB_2341188 |
| Streptavidin-eFluor 660 | eBioscience | Cat# 50-4317-82; RRID: AB_11218097 |
| Anti-rabbit IgG-Alexa Fluor 488 (Oligoclonal) | Thermal Fisher | Cat# A11008; RRID: AB_143165 |
| Anti-mouse Ki67-PE-cy7 (Clone B56) | BD Biosciences | Cat# 561283; RRID: AB_10716060 |
| Anti-GFP-Alexa Fluor 488 (Polyclonal) | Invitrogen | Cat# A21311; RRID: AB_221477 |
| Chemicals, Peptides, and Recombinant Proteins | ||
| SYBR Green I Nucleic Acid Gel Stain | Invitrogen | Cat# S7563 |
| Recombinant Murine IL-2 | PeproTech | Cat# 212-12 |
| Recombinant Murine IL-7 | PeproTech | Cat# 217-17 |
| Recombinant Human TGF-b | PeproTech | Cat# 100-21 |
| TRIzol Reagent | Invitrogen | Cat# 15596018 |
| Zombie Aqua Fixable Viability Kit | BioLegend | Cat# 423102 |
| Live and Dead Violet Viability Kit | Invitrogen | Cat# L34955 |
| Cell Tracer Violet | Thermal Fisher | Cat# C10094 |
| Foxp3/Transcription Factor Staining Buffer Set | eBioscience | Cat# 00-5523-00 |
| Nextera DNA Library Preparation Kit | Illumina | Cat# FC-121-1030 |
| NEBNext High-Fidelity 2X PCR Master Mix | NEB | Cat# M0541 |
| GoScript Reverse Transcriptase | Promega | Cat# A5003 |
| iQ SYBR Green Supermix | Bio-Rad | Cat# 1708887 |
| MitoTracker DeepRed | Invitrogen | Cat# M22426 |
| MitoSOX Red | Invitrogen | Cat# M36008 |
| MitoTracker Orange | Invitrogen | Cat# M7510 |
| TMRE | Invitrogen | Cat# T669 |
| 2-NBDG | Cayman Chemical | Cat# 11046 |
| 2-DG | Sigma | Cat# D8375-1G |
| Deposited Data | ||
| RNA-Seq and ATAC-seq data | This paper | GEO: GSE131883 |
| Experimental Models: Organisms/Strains | ||
| Mouse: Tfamfl/fl | Ansó et al., 2017 | NA |
| Mouse: Foxp3YFP-Cre | The Jackson Laboratory | Cat# 016959 |
| Mouse: Foxp3eGFP-Cre-ERT2 | The Jackson Laboratory | Cat# 016961 |
| Mouse: CD45.1Homo | The Jackson Laboratory | Cat# 002014 |
| Mouse: Rag1−/− | The Jackson Laboratory | Cat# 002216 |
| Mouse: ROSA26Stop-YFP | The Jackson Laboratory | Cat# 006148 |
| Mouse: Cd4-Cre | Taconic Farms | Cat# 4196 |
| Oligonucleotides | ||
| See Table S2 for list of quantitative RT-PCR primers | This paper | NA |
| Software and Algorithms | ||
| FlowJo version 10.4.2 | FlowJo | https://www.flowjo.com |
| Prism6 | GraphPad Software | https://www.graphpad.com/scientific-software/prism/ |
Highlights.
Cell-intrinsic regulation of Tregs in specific non-lymphoid tissues by Tfam
Tfam promotes Foxp3 stability through regulation of DNA methylation
Tfam ablation switches oxidative phosphorylation toward glycolysis in Tregs
Treg-specific deletion of Tfam causes tissue inflammation but enhances tumor rejection
ACKNOWLEDGMENTS
We thank all L.Z. lab members for help and suggestions. We thank the Genomics Facility (University of Chicago) for sequencing services and assistance. We thank Dr. L. Yang at the University of California, Los Angeles for providing the B16-OVA tumor cell line. We thank Dr. T. Tran and Dr. M. Kong at the University of California, Irvine for technical support for anti-5-meC dot blotting. This work was made possible in part by NIH Instrumentation Grant 1S10 OD021676-01. L.Z. is a Pew Scholar in Biomedical Sciences, supported by the Pew Charitable Trusts, and an Investigator in the Pathogenesis of Infectious Disease, supported by the Burroughs Wellcome Fund. The work was supported by the NIH (AI132391 and DK105562 to L.Z.).
Footnotes
SUPPLEMENTAL INFORMATION
Supplemental Information can be found online at https://doi.org/10.1016/j.celrep.2019.06.024.
DECLARATION OF INTERESTS
The authors declare no competing interests.
REFERENCES
- Angelin A, Gil-de-Gomez L, Dahiya S, Jiao J, Guo L, Levine MH, Wang Z, Quinn WJ 3rd, Kopinski PK, Wang L, et al. (2017). Foxp3 Reprograms T Cell Metabolism to Function in Low-Glucose, High-Lactate Environments. Cell Metab. 25, 1282–1293.e7. [DOI] [PMC free article] [PubMed] [Google Scholar]
- Anso E, Mullen AR, Felsher DW, Mates JM, Deberardinis RJ, and Chandel NS (2013). Metabolic changes in cancer cells upon suppression of MYC. Cancer Metab. 1, 7. [DOI] [PMC free article] [PubMed] [Google Scholar]
- Ansó E, Weinberg SE, Diebold LP, Thompson BJ, Malinge S, Schu-macker PT, Liu X, Zhang Y, Shao Z, Steadman M, et al. (2017). The mitochondrial respiratory chain is essential for haematopoietic stem cell function. Nat. Cell Biol 19, 614–625. [DOI] [PMC free article] [PubMed] [Google Scholar]
- Baixauli F, Acín-Pérez R, Villarroya-Beltri C, Mazzeo C, Nurñez-Andrade N, Gabande-Rodriguez E, Ledesma MD, Blazquez A, Martin MA, Falcón-Pérez JM, et al. (2015). Mitochondrial Respiration Controls Lysosomal Function during Inflammatory T Cell Responses. Cell Metab. 22, 485–498. [DOI] [PMC free article] [PubMed] [Google Scholar]
- Bastian A, Matsuzaki S, Humphries KM, Pharaoh GA, Doshi A, Zaware N, Gangjee A, and Ihnat MA (2017). AG311, a small molecule inhibitor of complex I and hypoxia-induced HIF-1α stabilization. Cancer Lett. 388, 149–157. [DOI] [PMC free article] [PubMed] [Google Scholar]
- Braun A, Dewert N, Brunnert F, Schnabel V, Hardenberg JH, Richter B, Zachmann K, Cording S, ClaBen A, Brans R, et al. (2015). Integrin αE(CD103) Is Involved in RegulatoryT-Cell Function in Allergic Contact Hyper-sensitivity. J. Invest. Dermatol 135, 2982–2991. [DOI] [PubMed] [Google Scholar]
- Breiling A, and Lyko F (2015). Epigenetic regulatory functions of DNA modifications: 5-methylcytosine and beyond. Epigenetics Chromatin 8, 24. [DOI] [PMC free article] [PubMed] [Google Scholar]
- Carey BW, Finley LW, Cross JR, Allis CD, and Thompson CB (2015). Intracellular a-ketoglutarate maintains the pluripotency of embryonic stem cells. Nature 518, 413–416. [DOI] [PMC free article] [PubMed] [Google Scholar]
- Cascone T, McKenzie JA, Mbofung RM, Punt S, Wang Z, Xu C, Williams LJ, Wang Z, Bristow CA, Carugo A, et al. (2018). Increased Tumor Glycolysis Characterizes Immune Resistance to Adoptive T Cell Therapy. Cell Metab. 27, 977–987.e4. [DOI] [PMC free article] [PubMed] [Google Scholar]
- Chapman NM, Zeng H, Nguyen TM, Wang Y, Vogel P, Dhungana Y, Liu X, Neale G, Locasale JW, and Chi H (2018). mTOR coordinatestran-scriptional programs and mitochondrial metabolism of activated Treg subsets to protect tissue homeostasis. Nat. Commun 9, 2095. [DOI] [PMC free article] [PubMed] [Google Scholar]
- Cipolletta D, Feuerer M, Li A, Kamei N, Lee J, Shoelson SE, Benoist C, and Mathis D (2012). PPAR-γ is a major driver of the accumulation and phenotype of adipose tissue Treg cells. Nature 486, 549–553. [DOI] [PMC free article] [PubMed] [Google Scholar]
- Cretney E, Xin A, Shi W, Minnich M, Masson F, Miasari M, Belz GT, Smyth GK, Busslinger M, Nutt SL, and Kallies A (2011). Thetranscription factors Blimp-1 and IRF4 jointly control the differentiation and function of effector regulatory T cells. Nat. Immunol 12, 304–311. [DOI] [PubMed] [Google Scholar]
- Cretney E, Kallies A, and Nutt SL (2013). Differentiation and function of Foxp3(+) effector regulatory T cells. Trends Immunol. 34, 74–80. [DOI] [PubMed] [Google Scholar]
- Delacher M, Imbusch CD, Weichenhan D, Breiling A, Hotz-Wagenblatt A, Trager U, Hofer AC, Kagebein D, Wang Q, Frauhammer F, et al. (2017). Genome-wide DNA-methylation landscape defines specialization of regulatory T cells in tissues. Nat. Immunol 18, 1160–1172. [DOI] [PMC free article] [PubMed] [Google Scholar]
- Divakaruni AS, Paradyse A, Ferrick DA, Murphy AN, and Jastroch M (2014). Analysis and interpretation of microplate-based oxygen consumption and pH data. Methods Enzymol. 547, 309–354. [DOI] [PubMed] [Google Scholar]
- Dominguez-Villar M, and Hafler DA (2018). Regulatory T cells in autoimmune disease. Nat. Immunol 19, 665–673. [DOI] [PMC free article] [PubMed] [Google Scholar]
- Fischer A, Zundler S, Atreya R, Rath T, Voskens C, Hirschmann S, Lopez-Posadas R, Watson A, Becker C, Schuler G, et al. (2016). Differential effects of α4β7 and GPR15 on homing of effector and regulatory T cells from patients with UC to the inflamed gut in vivo. Gut 65, 1642–1664. [DOI] [PMC free article] [PubMed] [Google Scholar]
- Gerriets VA, Kishton RJ, Johnson MO, Cohen S, Siska PJ, Nichols AG, Warmoes MO, de Cubas AA, MacIver NJ, Locasale JW, et al. (2016). Foxp3 and Toll-like receptor signaling balance Treg cell anabolic metabolism for suppression. Nat. Immunol 17, 1459–1466. [DOI] [PMC free article] [PubMed] [Google Scholar]
- Grinberg-Bleyer Y, Baeyens A, You S, Elhage R, Fourcade G, Gregoire S, Cagnard N, Carpentier W, Tang Q, Bluestone J, et al. (2010). IL-2 reverses established type 1 diabetes in NOD mice by a local effect on pancreatic regulatory T cells. J. Exp. Med 207, 1871–1878. [DOI] [PMC free article] [PubMed] [Google Scholar]
- Gullino PM, Clark SH, and Grantham FH (1964). The Interstitial Fluid of Solid Tumors. Cancer Res. 24, 780–794. [PubMed] [Google Scholar]
- Habtezion A, Nguyen LP, Hadeiba H, and Butcher EC (2016). Leukocyte Trafficking to the Small Intestine and Colon. Gastroenterology 150, 340–354. [DOI] [PMC free article] [PubMed] [Google Scholar]
- Ho PC, Bihuniak JD, Macintyre AN, Staron M, Liu X, Amezquita R, Tsui YC, Cui G, Micevic G, Perales JC, et al. (2015). Phosphoenolpyruvate Is a Metabolic Checkpoint of Anti-tumor T Cell Responses. Cell 162, 1217–1228. [DOI] [PMC free article] [PubMed] [Google Scholar]
- Jiralerspong S, Palla SL, Giordano SH, Meric-Bernstam F, Liedtke C, Barnett CM, Hsu L, Hung MC, Hortobagyi GN, and Gonzalez-Angulo AM (2009). Metformin and pathologic complete responses to neoadjuvant chemotherapy in diabetic patients with breast cancer. J. Clin. Oncol 27, 3297–3302. [DOI] [PMC free article] [PubMed] [Google Scholar]
- Kazachkova N, Ramos A, Santos C, and Lima M (2013). Mitochondrial DNA damage patterns and aging: revising the evidences for humans and mice. Aging Dis. 4, 337–350. [DOI] [PMC free article] [PubMed] [Google Scholar]
- Klages K, Mayer CT, Lahl K, Loddenkemper C, Teng MW, Ngiow SF, Smyth MJ, Hamann A, Huehn J, and Sparwasser T (2010). Selective depletion of Foxp3+ regulatory T cells improves effective therapeutic vaccination against established melanoma. Cancer Res. 70, 7788–7799. [DOI] [PubMed] [Google Scholar]
- Kline J, Zhang L, Battaglia L, Cohen KS, and Gajewski TF (2012). Cellular and molecular requirements for rejection of B16 melanoma in the setting of regulatory T cell depletion and homeostatic proliferation. J. Immunol 188, 2630–2642. [DOI] [PMC free article] [PubMed] [Google Scholar]
- Larsson NG, Wang J, Wilhelmsson H, Oldfors A, Rustin P, Lewandoski M, Barsh GS, and Clayton DA (1998). Mitochondrial transcription factor A is necessary for mtDNA maintenance and embryogenesis in mice. Nat. Genet 18, 231–236. [DOI] [PubMed] [Google Scholar]
- Li X, and Zheng Y (2015). Regulatory T cell identity: formation and maintenance. Trends Immunol. 36, 344–353. [DOI] [PMC free article] [PubMed] [Google Scholar]
- Li L, Liu X, Sanders KL, Edwards JL, Ye J, Si F, Gao A, Huang L, Hsueh EC, Ford DA, et al. (2018a). TLR8-Mediated Metabolic Control of Human Treg Function: A Mechanistic Target for Cancer Immunotherapy. Cell Metab. 29, 103–123.e5. [DOI] [PMC free article] [PubMed] [Google Scholar]
- Li Q, Li D, Zhang X, Wan Q, Zhang W, Zheng M, Zou L, Elly C, Lee JH, and Liu YC (2018b). E3 Ligase VHL Promotes Group 2 Innate Lymphoid Cell Maturation and Function via Glycolysis Inhibition and Induction of Interleukin-33 Receptor. Immunity 48, 258–270.e5. [DOI] [PMC free article] [PubMed] [Google Scholar]
- Liston A, and Gray DH (2014). Homeostatic control of regulatory T cell diversity. Nat. Rev. Immunol 14, 154–165. [DOI] [PubMed] [Google Scholar]
- Luengo A, Gui DY, and Vander Heiden MG (2017). Targeting Metabolism for Cancer Therapy. Cell Chem. Biol 24, 1161–1180. [DOI] [PMC free article] [PubMed] [Google Scholar]
- Mehta MM, Weinberg SE, and Chandel NS (2017). Mitochondrial control of immunity: beyond ATP. Nat. Rev. Immunol 17, 608–620. [DOI] [PubMed] [Google Scholar]
- Oo YH, Weston CJ, Lalor PF, Curbishley SM, Withers DR, Reynolds GM, Shetty S, Harki J, Shaw JC, Eksteen B, et al. (2010). Distinct roles for CCR4 and CXCR3 in the recruitment and positioning of regulatory T cells in the inflamed human liver. J. Immunol 184, 2886–2898. [DOI] [PubMed] [Google Scholar]
- Pedros C, Canonigo-Balancio AJ, Kong KF, and Altman A (2017). Requirement of Treg-intrinsic CTLA4/PKCh signaling pathway for suppressing tumor immunity. JCI Insight 2, 95692. [DOI] [PMC free article] [PubMed] [Google Scholar]
- Picca A, and Lezza AM (2015). Regulation of mitochondrial biogenesis through TFAM-mitochondrial DNA interactions: Useful insights from aging and calorie restriction studies. Mitochondrion 25, 67–75. [DOI] [PubMed] [Google Scholar]
- Rubtsov YP, Niec RE, Josefowicz S, Li L, Darce J, Mathis D, Benoist C, and Rudensky AY (2010). Stability of the regulatory T cell lineage in vivo. Science 329, 1667–1671. [DOI] [PMC free article] [PubMed] [Google Scholar]
- Sakaguchi S, Vignali DA, Rudensky AY, Niec RE, and Waldmann H (2013). The plasticity and stability of regulatory T cells. Nat. Rev. Immunol 13, 461–467. [DOI] [PubMed] [Google Scholar]
- Samstein RM, Arvey A, Josefowicz SZ, Peng X, Reynolds A, Sandstrom R, Neph S, Sabo P, Kim JM, Liao W, et al. (2012). Foxp3 exploits a pre-existent enhancer landscape for regulatory T cell lineage specification. Cell 151, 153–166. [DOI] [PMC free article] [PubMed] [Google Scholar]
- Schaerli P, Ebert L, Willimann K, Blaser A, Roos RS, Loetscher P, and Moser B (2004).Askin-selective homing mechanism for human immune surveillance T cells. J. Exp. Med 199, 1265–1275. [DOI] [PMC free article] [PubMed] [Google Scholar]
- Scharping NE, Menk AV, Moreci RS, Whetstone RD, Dadey RE, Watkins SC, Ferris RL, and Delgoffe GM (2016). The Tumor Microenvironment Represses T Cell Mitochondrial Biogenesis to Drive Intratumoral T Cell Metabolic Insufficiency and Dysfunction. Immunity 45, 374–388. [DOI] [PMC free article] [PubMed] [Google Scholar]
- Schaupp L, Ellmerer M, Brunner GA, Wutte A, Sendlhofer G, Trajanoski Z, Skrabal F, Pieber TR, and Wach P (1999). Direct access to interstitial fluid in adipose tissue in humans by use of open-flow microperfusion. Am. J. Physiol 276, E401–E408. [DOI] [PubMed] [Google Scholar]
- Schieber MS, and Chandel NS (2013). ROS links glucose metabolism to breast cancer stem cell and EMT phenotype. Cancer Cell 23, 265–267. [DOI] [PubMed] [Google Scholar]
- Schiering C, Krausgruber T, Chomka A, Frohlich A, Adelmann K, Wohlfert EA, Pott J, Griseri T, Bollrath J, Hegazy AN, et al. (2014). The alarmin IL-33 promotes regulatory T-cell function in the intestine. Nature 513, 564–568. [DOI] [PMC free article] [PubMed] [Google Scholar]
- Schon EA, DiMauro S, and Hirano M (2012). Human mitochondrial DNA: roles of inherited and somatic mutations. Nat. Rev. Genet 13, 878–890. [DOI] [PMC free article] [PubMed] [Google Scholar]
- Shen L, Song CX, He C, and Zhang Y. (2014). Mechanism and function of oxidative reversal of DNA and RNA methylation. Annu. Rev. Biochem 83, 585–614. [DOI] [PMC free article] [PubMed] [Google Scholar]
- Sternberg F, Meyerhoff C, Mennel FJ, Bischof F, and Pfeiffer EF (1995). Subcutaneous glucose concentration in humans. Real estimation and continuous monitoring. Diabetes Care 18, 1266–1269. [DOI] [PubMed] [Google Scholar]
- Sukumar M, Liu J, Ji Y, Subramanian M, Crompton JG, Yu Z, Roychoudhuri R, Palmer DC, Muranski P, Karoly ED, et al. (2013). Inhibiting glycolytic metabolism enhances CD8+ T cell memory and antitumor function. J. Clin. Invest 123, 4479–4488. [DOI] [PMC free article] [PubMed] [Google Scholar]
- Tran TQ, Ishak Gabra MB, Lowman XH, Yang Y, Reid MA, Pan M, O’Connor TR, and Kong M (2017). Glutamine deficiency induces DNA alkylation damage and sensitizes cancer cells to alkylating agents through inhibition of ALKBH enzymes. PLoS Biol. 15, e2002810. [DOI] [PMC free article] [PubMed] [Google Scholar]
- Vasanthakumar A, Moro K, Xin A, Liao Y, Gloury R, Kawamoto S, Fagarasan S, Mielke LA, Afshar-Sterle S, Masters SL, et al. (2015). The transcriptional regulators IRF4, BATF and IL-33 orchestrate development and maintenance of adipose tissue-resident regulatory T cells. Nat. Immunol 16, 276–285. [DOI] [PubMed] [Google Scholar]
- Weinberg F, Hamanaka R, Wheaton WW, Weinberg S, Joseph J, Lopez M, Kalyanaraman B, Mutlu GM, Budinger GR, and Chandel NS (2010). Mitochondrial metabolism and ROS generation are essential for Kras-mediated tumorigenicity. Proc. Natl. Acad. Sci. USA 107, 8788–8793. [DOI] [PMC free article] [PubMed] [Google Scholar]
- Weinberg SE, Singer BD, Steinert EM, Martinez CA, Mehta MM, Martinez-Reyes I, Gao P, Helmin KA, Abdala-Valencia H, Sena LA, et al. (2019). Mitochondrial complex III isessential for suppressive function of regulatory T cells. Nature 565, 495–499. [DOI] [PMC free article] [PubMed] [Google Scholar]
- Wheaton WW, Weinberg SE, Hamanaka RB, Soberanes S, Sullivan LB, Anso E, Glasauer A, Dufour E, Mutlu GM, Budigner GS, and Chandel NS (2014). Metformin inhibits mitochondrial complex I of cancer cells to reduce tumorigenesis. eLife 3, e02242. [DOI] [PMC free article] [PubMed] [Google Scholar]
- Yang K, Blanco DB, Neale G, Vogel P, Avila J, Clish CB, Wu C, Shrestha S, Rankin S, Long L, et al. (2017). Homeostatic control of metabolic and functional fitness of Treg cells by LKB1 signalling. Nature 548, 602–606. [DOI] [PMC free article] [PubMed] [Google Scholar]
- Ye J, Qiu J, Bostick JW, Ueda A, Schjerven H, Li S, Jobin C, Chen ZE, and Zhou L (2017). The Aryl Hydrocarbon Receptor Preferentially Marks and Promotes Gut Regulatory T Cells. Cell Rep. 21, 2277–2290. [DOI] [PMC free article] [PubMed] [Google Scholar]
- Yu X, Teng XL, Wang F, Zheng Y, Qu G, Zhou Y, Hu Z, Wu Z, Chang Y, Chen L, et al. (2018). Metabolic control of regulatory T cell stability and function by TRAF3IP3 at the lysosome. J. Exp. Med 215, 2463–2476. [DOI] [PMC free article] [PubMed] [Google Scholar]
- Zeng H, Yang K, Cloer C, Neale G, Vogel P, and Chi H (2013). mTORC1 couples immune signals and metabolic programming to establish T(reg)-cell function. Nature 499, 485–490. [DOI] [PMC free article] [PubMed] [Google Scholar]
- Zhang X, Fryknas M, Hernlund E, Fayad W, De Milito A, Olofsson MH, Gogvadze V, Dang L, Pahlman S, Schughart LA, et al. (2014). Induction of mitochondrial dysfunction as a strategy for targeting tumour cells in metabolically compromised microenvironments. Nat. Commun 5, 3295. [DOI] [PMC free article] [PubMed] [Google Scholar]
- Zheng Y, Josefowicz SZ, Kas A, Chu TT, Gavin MA, and Rudensky AY (2007). Genome-wide analysis of Foxp3 target genes in developing and mature regulatory T cells. Nature 445, 936–940. [DOI] [PubMed] [Google Scholar]
- Zhou X, Bailey-Bucktrout SL, Jeker LT, Penaranda C, Martinez-Llordella M, Ashby M, Nakayama M, Rosenthal W, and Bluestone JA (2009). Instability of the transcription factor Foxp3 leads to the generation of pathogenic memory T cells in vivo. Nat. Immunol 10, 1000–1007. [DOI] [PMC free article] [PubMed] [Google Scholar]
Associated Data
This section collects any data citations, data availability statements, or supplementary materials included in this article.
Supplementary Materials
Data Availability Statement
The accession number of the RNA-sequencing and ATAC-sequencing data from control and Tfam-deficient Tregs files reported in this paper is GEO: GSE131883.