

Abstract
Background
Chronic kidney disease (CKD) is common in patients after heart transplantation (HTx). We assessed whether in HTx recipients the proteomic urinary classifier CKD273 or sequenced urinary peptides revealing the parental proteins correlated with the estimated glomerular filtration rate (eGFR).
Methods
In 368 HTx patients, we measured the urinary peptidome and analysed CKD273 and 48 urinary peptides with a detectable signal in >95% of participants. After 9.1 months (median), eGFR and the urinary biomarkers were reassessed.
Results
In multivariable Bonferroni-corrected analyses of the baseline data, a 1-SD increase in CKD273 was associated with a 11.4 [95% confidence interval (CI) 7.25–15.5] mL/min/1.73 m2 lower eGFR and an odds ratio of 2.63 (1.56–4.46) for having eGFR <60 mL/min/1.73 m2. While relating eGFR category at follow-up to baseline urinary biomarkers, CKD273 had higher (P = 0.007) area under the curve (0.75; 95% CI 0.70–0.80) than 24-h proteinuria (0.64; 95% CI 0.58–0.69), but additional adjustment for baseline eGFR removed significance of both biomarkers. In partial least squares analysis, the strongest correlates of the multivariable-adjusted baseline eGFR were fragments of collagen I (positive) and the mucin-1 subunit α (inverse). Associations between the changes in eGFR and the urinary markers were inverse for CKD273 and mucin-1 and positive for urinary collagen I.
Conclusions
With the exception of baseline eGFR, CKD273 was more closer associated with imminent renal dysfunction than 24-h proteinuria. Fragments of collagen I and mucin-1—respectively, positively and inversely associated with eGFR and change in eGFR—are single-peptide markers associated with renal dysfunction.
Keywords: collagen, glomerular filtration, heart transplantation, mucin-1, urinary proteomics
INTRODUCTION
A position paper of the American Heart Association supports research into proteomics as applied to cardiovascular health and disease with the goal to discover new and effective strategies for the prevention, diagnosis and treatment of cardiovascular disease [1]. Over the past decade, urinary proteomics developed into a state-of-the-art technology providing molecular fingerprints of individual patients as a gateway to risk stratification, identification of molecular mechanisms and possibly personalized medicine [2]. Capillary electrophoresis coupled with high-resolution mass spectrometry (CE-MS) enables detection of >5000 peptide fragments in urine samples [3]. CKD273 [4–8] is a multidimensional urinary classifier, which in populations [4] and patient cohorts [5–7] is cross-sectionally associated with renal function [4, 5] and predicts decline in estimated glomerular filtration rate (eGFR) [4, 6, 7]. Single sequenced urinary peptides allow identifying the parental proteins, thereby providing information on the molecular mechanisms underlying renal dysfunction [9].
Immunosuppressive drugs, in particular the calcineurin inhibitors [10], administered to recipients of a cardiac allograft are directly nephrotoxic or indirectly impair renal function, because they cause hypertension and hyperglycaemia [11]. The urinary PROteomics in Predicting HEart Transplantation outcomes (uPROPHET; study registration number, NCT03152422) is a proof-of-concept project sponsored by the European Research Council that should lead to the initial validation and clinical application of profiling of the urinary proteome in heart transplanted (HTx) patients with the goal to improve risk stratification and choosing treatment modalities [12]. The objective of the current study was to assess whether the multidimensional urinary peptidomic classifier CKD273 or single sequenced urinary peptides correlated with renal dysfunction in a single-centre cohort of 368 HTx recipients on immunosuppressants, thereby extending observations in populations [4, 9] and patients [5–7].
MATERIALS AND METHODS
Study participants
uPROPHET complies with the Declaration of Helsinki for research in humans [13]. uPROPHET was approved by the local Ethics Committee of the University Hospitals Leuven [numbers B322201421186 (S56384) and B322201421045 (S56472)] and passed review by the European Research Council Executive Agency. HTx recipients provided written informed consents. Recruitment of patients took place at the University Hospital Gasthuisberg in Leuven in collaboration with the heart transplantation (HTx) team. All HTx recipients in regular follow-up at the University Hospitals Leuven were invited to provide a 5-mL mid-morning urine sample for urinary peptidomic analysis. By the end of 2016, 368 HTx patients participated and all were included in the present analysis. All 368 patients underwent a repeat assessment of their renal function, along with the urinary peptidome in 351 (95.4%).
Clinical and biochemical data
A detailed description of the construction and contents of the uPROPHET database is available elsewhere [12]. All potentially relevant clinical information, including anthropometrics, previous medical history, biochemical measurements and use of immunosuppressive, antihypertensive, lipid-lowering and antidiabetic drugs, was retrieved from the computerized information system of the University Hospitals Leuven. At baseline, patients collected a 24-h urine sample for the measurement of proteinuria by the benzethonium chloride turbidimetric method (Cobas c702 module, Roche Diagnostics, Basel, Switzerland) [14]. Hypertension was an office blood pressure of at least 140 mmHg systolic or 90 mmHg diastolic or use of antihypertensive drugs. Venous blood samples were drawn within 1 week of urine sampling after at least 8 h of fasting. We measured the concentration of creatinine in serum, using Jaffe’s method [15] with modifications described elsewhere [16] and isotope-dilution MS for calibration. We eGFR from serum creatinine by the Chronic Kidney Disease Epidemiology Collaboration (CKD-EPI) [17] equation. In categorical analyses, we dichotomized patients according to whether at the repeat assessment their eGFR was <60 mL/min/1.73 m2 or ≥60 mL/min/1.73 m2 [18]. Diabetes mellitus was a hospital diagnosis, a fasting plasma glucose of ≥126 mg/dL, or use of antidiabetic agents [19].
Urinary proteomics
Methods for urine sample preparation, proteome analysis by CE-MS, data processing and sequencing have been published before [20]. Peptide fragments were combined into a single summary variable, using the MosaCluster software, version 1.7.0 [21]. CKD273 consists of 273 fragments and has been validated for the early diagnosis of CKD [4, 7, 8]. This multidimensional classifier is normally distributed, with higher values being associated with worse renal outcomes. CE-MS analysis, sequencing of peptides, MS data evaluation and calibration were performed as described in detail in previous publications [3, 22]. For in-depth analysis, we selected 48 peptides (Supplementary data, Table S3), which had a detectable signal in >95% of participants.
Statistical analysis
For database management and statistical analysis, we used the SAS system, version 9.4 (SAS Institute Inc., Cary, NC, USA). Means were compared using the large-sample z-test and proportions by Fisher’s exact test. The distribution of 24-h proteinuria was normalized by a logarithmical transformation. We rank normalized the distributions of the urinary peptides by sorting measurements from the smallest to the highest and then applying the inverse cumulative normal function [23]. eGFR was analysed as a continuous or categorical outcome, using multivariable-adjusted linear and logistic regression, as appropriate. While accounting for covariables with known relevance [4, 7, 9], antihypertensive drug treatment and the use of immunosuppressants (by drug class), we regressed eGFR on the urinary biomarkers, constructed –log10 probability plots, and applied a Bonferroni-corrected P-value threshold of 0.001 (0.05/48). In the next step of our analyses, we applied partial least squares (PLS) analysis, which is a statistical technique that constructs models for a continuous outcome in relation to correlated high-dimensional explanatory variables [24]. In our study, PLS analysis allowed identification of a set of independent latent factors that were linear combinations of the urinary peptides and that maximized the covariance between eGFR and the urinary peptides. The importance of each urinary peptide in the construction of the PLS factors was assessed from the Variable Importance in Projection (VIP) score of Wold with the threshold set at 1.1.
We compared the proportion of patients with eGFR <60 mL/min/1.73 m2 versus ≥60 mL/min/1.73 m2 at baseline and follow-up, using the McNemar test. Next, we constructed receiver operating characteristic (ROC) curves and calculated the area under the ROC curve (AUC) relating eGFR at follow-up to 24-h proteinuria and CKD273 at baseline. The 95% confidence interval (CI) of the AUC was calculated by the DeLong method. Using the published 0.154 threshold [7], we calculated the sensitivity, specificity and positive and negative predictive value of CKD273. While adjusting for covariables, we assessed the incremental value of CKD273 in discriminating between eGFR <60 versus ≥60 mL/min/1.73 m2 by calculating the integrated discrimination improvement (IDI) and the net reclassification improvement (NRI) [25].
RESULTS
Characteristics of participants
Among the 368 study participants (24.2% women), the causes of end-stage heart failure were ischaemic cardiomyopathy in 141 (38.3%), dilated cardiomyopathy in 149 (40.5%) and other aetiologies in 78 (21.2%). Of the 368 patients, 24 (6.5%) received a combined heart and kidney transplant. Their baseline characteristics were similar to those of patients who only underwent HTx, with the exception of heart rate, which was lower in patients with a combined transplant (74.0 versus 79.9 beats per minute; P = 0.033; Supplementary data, Table S4). The first urine sample for urinary proteomics (baseline) was obtained 7.4 years [interquartile range (IQR) 2.5–14.3] after HTx. Table 1 lists the characteristics of the patients by quartiles of the time interval since HTx. A longer interval was associated (P for trend ≤0.007) with older age, higher body mass index, elevated systolic blood pressure, higher prevalence of hypertension and reduced renal function, and with lower heart rate and eGFR. The multidimensional urinary classifier CKD273 increased with longer interval since HTx (P < 0.0001). The time trends in the sequenced peptides appear in Supplementary data, Table S1. Table 2 lists the treatment modalities by the time interval since HTx. The 21 patients (5.7%) who were taking mammalian target of rapamycin (mTOR) inhibitors had similar baseline characteristics compared to the 347 patients (94.3%) who were not on mTOR inhibitors, with the exception of 24-h proteinuria (Supplementary data, Table S5), which was higher (P = 0.045) in users compared with non-users [geometric mean 0.15 g (IQR 0.11–0.24) versus 0.11 g (0.08–0.16)]. The most notable time trend was the increase in the use of antihypertensive drugs, mainly driven by diuretics, β-blockers and calcium-channel blockers.
Table 1.
Baseline characteristics of participants by time interval since HTx
| Characteristic | <2.5 years | 2.5–7.4 years | 7.5–14.3 years | >14.3 years | P |
|---|---|---|---|---|---|
| Number of participants (%) | 92 | 92 | 92 | 92 | |
| Women | 21 (22.8) | 26 (28.3) | 19 (20.7) | 23 (25.0) | 0.96 |
| Hypertension | 74 (80.4) | 79 (85.9) | 85 (92.4) | 90 (97.8) | 0.0001 |
| Diabetes mellitus | 19 (20.7) | 24 (26.1) | 22 (23.9) | 25 (27.2) | 0.39 |
| eGFR <60 mL/min/1.73 m2 | 29 (31.5) | 43 (46.7) | 59 (64.1) | 75 (81.5) | <0.0001 |
| eGFR 30–59 mL/min/1.73 m2 | 26 (28.3) | 39 (42.4) | 47 (51.1) | 60 (65.9) | <0.0001 |
| eGFR <30 mL/min/1.73 m2 | 3 (3.3) | 4 (4.4) | 12 (13.0) | 15 (16.3) | 0.001 |
| Mean of characteristics | |||||
| Age (years) | 51.5 ± 13.3 | 52.2 ± 12.8 | 59.4 ± 15.5 | 63.8 ± 14.0 | <0.0001 |
| Body mass index (kg/m2) | 24.5 ± 4.1 | 25.5 ± 4.4 | 26.0 ± 4.5 | 25.0 ± 4.1 | 0.32 |
| Systolic pressure (mmHg) | 139.2 ± 18.2 | 140.1 ± 18.2 | 142.7 ± 23.5 | 147.7 ± 23.1 | 0.004 |
| Diastolic pressure (mmHg) | 84.8 ± 11.0 | 85.7 ± 10.8 | 84.6 ± 12.6 | 85.1 ± 11.3 | 0.96 |
| Heart rate (beats per minute) | 84.5 ± 12.1 | 76.1 ± 11.0 | 79.4 ± 14.2 | 77.9 ± 13.0 | 0.007 |
| Serum total cholesterol (mg/dL) | 159.0 ± 42.0 | 157.5 ± 33.4 | 149.1 ± 27.1 | 157.9 ± 34.1 | 0.47 |
| Serum HDL cholesterol (mg/dL) | 58.5 ± 15.6 | 55.8 ± 15.0 | 56.3 ± 19.0 | 58.4 ± 17.8 | 0.98 |
| Plasma glucose (mg/dL) | 97.0 ± 18.1 | 102.9 ± 22.5 | 103.9 ± 31.3 | 99.1 ± 19.3 | 0.50 |
| Serum creatinine (mg/dL) | 1.21 ± 0.39 | 1.32 ± 0.41 | 1.50 ± 0.53 | 1.64 ± 0.56 | <0.0001 |
| eGFR (mL/min/1.73 m2) | 72.2 ± 24.3 | 63.5 ± 23.4 | 55.4 ± 25.0 | 47.0 ± 21.2 | <0.0001 |
| 24-h proteinuria (g) | 0.10 (0.08–0.15) | 0.10 (0.08–0.15) | 0.11 (0.08–0.20) | 0.13 (0.10–0.18) | 0.011 |
| CKD273 (score) | –0.11 ± 0.44 | 0.01 ± 0.42 | 0.21 ± 0.42 | 0.35 ± 0.43 | <0.0001 |
Arithmetic means (±SD) or geometric means (IQR) are given for continuous variables. eGFR was derived from serum creatinine by the CKD-EPI formula. Hypertension was a blood pressure of ≥140 mmHg systolic or ≥90 mmHg diastolic or use of antihypertensive drugs. Diabetes mellitus was a hospital diagnosis, a fasting glucose level of ≥126 mg/dL or use of antidiabetic agents. P-values are for linear trend across quartiles of the time interval since HTx.
Table 2.
Medications by time interval since HTx
| Characteristics | <2.5 years | 2.5–7.4 years | 7.5–14.3 years | >14.3 years | P |
|---|---|---|---|---|---|
| Number of participants (%) | 92 | 92 | 92 | 92 | |
| Immunosuppressive treatment | |||||
| Calcineurin inhibitor | 92 (100) | 91 (98.9) | 84 (91.3) | 91 (98.9) | 0.16 |
| Tacrolimus | 92 (100) | 88 (95.7) | 71 (77.2) | 31 (33.7) | <0.0001 |
| Cyclosporine | 0 (0) | 3 (3.3) | 13 (14.1) | 60 (65.2) | <0.0001 |
| Anti-proliferative agents | 90 (97.8) | 68 (73.9) | 73 (79.4) | 79 (85.9) | 0.075 |
| mTOR inhibitors | 0 (0) | 8 (8.7) | 11 (12.0) | 2 (2.2) | 0.37 |
| Methylprednisolone | 53 (57.6) | 13 (14.1) | 18 (19.6) | 51 (55.4) | 0.96 |
| Antihypertensive drugs | |||||
| Any drug class | 53 (57.6) | 67 (72.8) | 81 (88.0) | 85 (92.4) | <0.0001 |
| Thiazides | 2 (2.2) | 8 (8.7) | 18 (19.6) | 14 (15.2) | 0.001 |
| Loop diuretics | 14 (15.2) | 7 (7.6) | 8 (8.7) | 7 (7.6) | 0.12 |
| Aldosterone antagonists | 7 (7.6) | 6 (6.5) | 4 (4.4) | 4 (4.4) | 0.27 |
| β-blockers | 15 (16.3) | 36 (39.1) | 36 (39.1) | 43 (46.7) | <0.0001 |
| Calcium channel blockers | 15 (16.3) | 23 (25.0) | 32 (34.8) | 41 (44.6) | <0.0001 |
| RAS inhibitors | 19 (20.7) | 43 (46.7) | 55 (59.8) | 52 (56.5) | 0.73 |
| Use of statins | 90 (97.8) | 81 (88.0) | 87 (94.6) | 85 (92.4) | 0.41 |
| Use of antidiabetic drugs | |||||
| Insulin | 8 (8.7) | 5 (5.4) | 13 (14.1) | 12 (13.0) | 0.13 |
| Other agents | 14 (15.2) | 17 (18.5) | 11 (12.0) | 15 (16.3) | 0.85 |
All values are n (%).
RAS, renin–angiotensin system.
Drugs by class: calcineurin inhibitors, tacrolimus and cyclosporine; anti-proliferative agents, azathioprine and mycophenolate mofetil; mTOR inhibitors, everolimus and sirolimus; RAS inhibitors, converting-enzyme inhibitors and angiotensin II type-1 receptor blockers. P-values are for linear trend across quartiles of the time interval since HTx.
Cross-sectional analyses
eGFR as continuous variable
We adjusted the cross-sectional associations between eGFR and the urinary biomarkers in 368 participants for years since HTx, body mass index, mean arterial pressure, past smoking, plasma glucose, total-to-high-density lipoprotein (HDL) cholesterol ratio, use of antihypertensive agents and immunosuppressive drugs (by class). Figure 1 shows the peptides, which with Bonferroni correction of the significance levels applied, were associated with baseline eGFR. Table 3 provides the association sizes expressed per 1-SD increment in the urinary markers. eGFR was 11.4 mL/min/1.73 m2 lower in relation to CKD273. The association sizes amounted to 9.46, 6.17, 4.30, 5.24 and 5.70 mL/min/1.73 m2 (P ≤ 0.026) for the collagen I fragments p35339, p41601, p32171, p72596 and p118163; –5.04 mL/min/1.73 m2 (P = 0.005) for collagen II fragment p41431; 5.30, –4.85 and –4.07 mL/min/1.73 m2 (P ≤ 0.039) for collagen III fragments p57537, p98660 and p105352; and to –5.21 mL/min/1.73 m2 (P = 0.001) for p8342 (mucin-1 subunit α). Excluding the 24 patients who received a combined heart and kidney transplant or 21 patients using a mTOR inhibitor did not materially alter these results.
FIGURE 1.
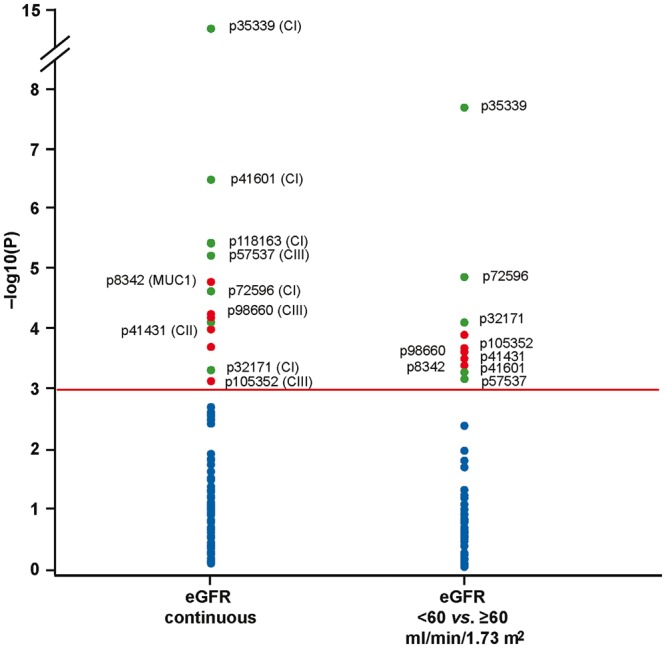
Log10(p) probability plot of the multivariable-adjusted cross-sectional associations of renal function with the single sequenced urinary peptides at baseline. All analyses were adjusted for years since transplantation, body mass index, mean arterial pressure, past smoking, plasma glucose, total-to-HDL cholesterol ratio, and use of antihypertensive agents and immunosuppressive drugs (by class). The horizontal line denotes significance with Bonferroni correction applied. Dots represent peptides, respectively, negatively or positively associated with eGFR. CI, CII and CIII refer to fragments of collagen I, II and III, respectively, and MUC1 to a fragment of the mucin-1 subunit α.
Table 3.
Adjusted associations of baseline eGFR with urinary proteomic biomarkers
| Biomarker | Protein | eGFR continuous (n = 368) | eGFR <60 versus ≥60 (206 versus 162) |
|---|---|---|---|
| Slope (95% CI) | Odds ratio (95% CI) | ||
| CKD273 | … | –11.4 (–15.5, –7.25)**** | 2.63 (1.56, 4.46)**** |
| 24-h proteinuria | … | –1.20 (–2.41, 0.02) | 0.92 (0.85, 1.02) |
| Single peptides | |||
| p32171 | Collagen I | 4.30 (0.25, 8.34)* | 0.59 (0.38, 0.92)** |
| p35339 | Collagen I | 9.46 (5.66, 13.3)**** | 0.43 (0.26, 0.71)**** |
| p41601 | Collagen I | 6.17 (2.25, 10.1)**** | 0.63 (0.41, 0.98)* |
| p72596 | Collagen I | 5.24 (1.20, 9.28)*** | 0.54 (0.34, 0.86)*** |
| p118163 | Collagen I | 5.70 (1.70, 9.70)*** | NS |
| p41431 | Collagen II | –5.04 (–9.25, –0.84)** | 1.65 (1.05, 2.60)* |
| p57537 | Collagen III | 5.30 (1.49, 9.11)*** | 0.64 (0.42, 0.98)* |
| p98660 | Collagen III | –4.85 (–8.82, –0.89)** | 1.59 (1.04, 2.42)* |
| p105352 | Collagen III | –4.07 (–8.03, –0.11)* | 1.64 (1.07, 2.52)** |
| p8342 | Mucin-1 | –5.21 (–9.19, –1.24)*** | 1.61 (1.03, 2.50)* |
eGFR was derived from serum creatinine by the CKD-EPI formula. Estimates express the association size for a 1-SD increase in the urinary biomarkers. The analyses were adjusted for time since transplantation, body mass index, mean arterial pressure, past smoking, plasma glucose, total-to-HDL cholesterol ratio, and use of antihypertensive agents and immunosuppressive drugs (by class). NS indicates not significant. 95% CI and significance levels account for multiple testing: *P ≤ 0.05; **P ≤ 0.01; ***P ≤ 0.001; ****P ≤ 0.0001.
The PLS procedure yielded two latent factors that accounted for 18.2% of the overall variance in the urinary peptides and 32.1% of the variance in eGFR. Figure 2 depicts the PLS-derived Variance Importance in Projection (VIP) scores versus the cantered and rescaled correlation coefficients. The dependent variable in this analysis was baseline eGFR standardized for the aforementioned covariables. The urinary peptides associated with lower eGFR (left side of the V plot) included a fragment of the mucin-1 subunit α (p8342), and fragments of collagen I, collagen II (p41431) and collagen III (p98660 and p105352). The urinary peptides associated with higher eGFR (right side of the V plot) were fragments of collagen I (p32171, p35339, p41601, p72596 and p118163), collagen III (p57537) and fibrinogen (p61573).
FIGURE 2.
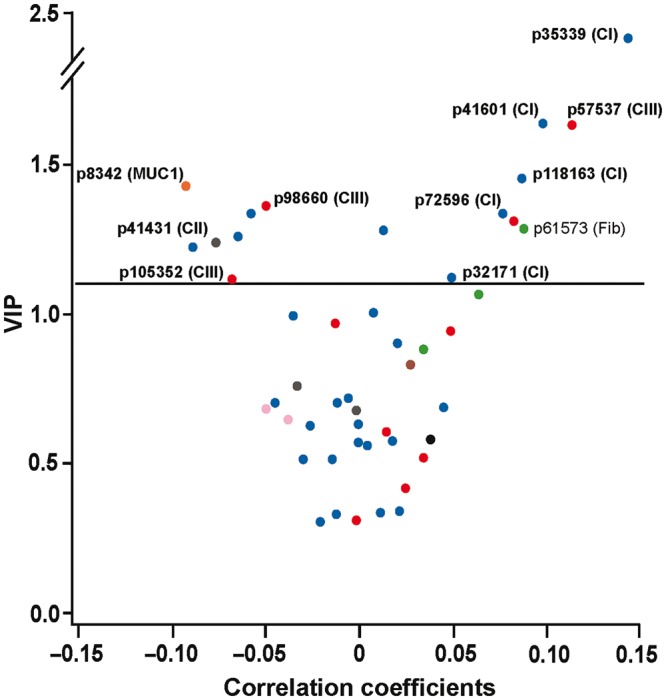
V-plots generated by PLS analysis. VIP scores indicate the importance of each urinary fragment in the construction of the PLS factors and are plotted against the centred and rescaled correlation coefficients. These correlation coefficients reflect the associations of the multivariable-adjusted baseline eGFR with the urinary fragments. The urinary peptides associated with lower eGFR (left side of the V plot) included a fragment of the mucin-1 subunit α (p8342) and fragments of collagen I, collagen II (p41431) and collagen III (p98660 and p105352). The urinary peptides associated with higher eGFR (right side of the V plot) were fragments of collagen I (p32171, p35339, p41601, p72596 and p118163), collagen III (p57537) and fibrinogen (p61573).
eGFR as categorical variable
Figure 1 shows the peptides that significantly discriminated between eGFR categories at baseline (<60 versus ≥60 mL/min/1.73 m2). The odds ratios associated with a 1-SD increment in the urinary biomarkers appear in Table 3. The odds ratio was 2.63 (P < 0.0001) for CKD273. Considering peptides, the odds ratios were 0.43, 0.63, 0.59 and 0.54 (P ≤ 0.025) for collagen I fragments p35339, p41601, p32171 and p72596; 1.65 (P = 0.014) for the collagen II fragment p41431; 0.64, 1.59 and 1.64 (P ≤ 0.030) for the collagen III fragments p57537, p98660 and p105352; and 1.61 (P = 0.019) for p8342 (mucin-1 subunit α). Cross-sectional analyses of the baseline additionally adjusted for sex and age produced confirmatory results (Supplementary data, Table S2).
Longitudinal analyses
eGFR change as continuous variable
Of 368 patients, 351 had both eGFR and urinary proteomics data at baseline and follow-up. From baseline to follow-up, eGFR decreased on average by 1.40 mL/min/1.73 m2 (95% CI 0.37–2.42; P = 0.008). Significant associations between the changes (follow-up minus baseline value) in eGFR and the urinary markers are listed in Table 4. eGFR decreased by 1.80, 1.73 and 1.13 mL/min/1.73 m2 per 1-SD increment in the abundance of the urinary markers CKD273, the collagen II fragment p41431 and the mucin-1 subunit α, respectively. eGFR increased by 1.74, 1.22 and 1.38 mL/min/1.73 m2 per 1-SD increment in the urinary collagen I fragments p32171 and p35339, and the collagen III fragment p57537, respectively.
Table 4.
Associations between changes in eGFR and urinary biomarkers in 351 patients
| Biomarker | Protein | eGFR change (95% CI) | P |
|---|---|---|---|
| ΔCKD273 | … | –1.80 (–2.81, –0.79) | 0.0005 |
| Single peptides | |||
| Δp32171 | Collagen I | 1.74 (0.72, 2.76) | 0.0009 |
| Δp35339 | Collagen I | 1.22 (0.19, 2.24) | 0.020 |
| Δp41431 | Collagen II | –1.73 (–2.75, –0.71) | 0.0009 |
| Δp57537 | Collagen III | 1.38 (0.35, 2.40) | 0.009 |
| Δp8342 | Mucin-1 | –1.13 (–2.16, –0.11) | 0.031 |
eGFR was derived from serum creatinine by the CKD-EPI formula. Estimates given with 95% CI, express the association between changes (Δ; follow-up minus baseline value) in eGFR and in the urinary biomarkers. Changes are expressed in mL/min/1.73 m2 per 1-SD change in the abundance of the urinary markers.
eGFR change as categorical variable
At baseline, 206 patients had an eGFR <60 mL/min/1.73 m2, of whom over a median follow-up of 9.1 months (IQR 6.2–11.6 months) 195 maintained this classification. Of 162 patients with a baseline eGFR of ≥60 mL/min/1.73 m2, 24 experienced a decrease in eGFR to <60 mL/min/1.73 m2. The overall progression rate from baseline to follow-up among the 368 patients was, therefore, 3.5% (from 56.0% to 59.5%; 95% CI 0.4–6.9%; P = 0.012). To investigate to what extent the urinary peptides and proteinuria at baseline predicted renal dysfunction at follow-up defined as an eGFR of <60 mL/min/1.73 m2, an ROC analysis was performed. The AUC for 24-h proteinuria was 0.64 (95% CI 0.58–0.69; P < 0.0001; Figure 3). Compared with 24-h proteinuria, the AUC was significantly (P = 0.007) higher for CKD273 (0.75; 95% CI 0.70–0.80) with a similar trend (P = 0.069) for collagen I fragment p35339 (0.71; 95% CI 0.65–0.76). With an adjustment applied for baseline eGFR both urinary biomarkers lost significance (P ≥ 0.37). However, using the published 0.154 threshold, the sensitivity, specificity, and positive and negative predictive value of CKD273 were 59.8, 72.5, 76.2 and 55.1%, respectively. Adding CKD273 to a basic model including the aforementioned covariables and 24-h proteinuria at baseline increased (P < 0.0001) the IDI and the NRI by 2.9% (95% CI 1.6–4.3%) and by 72.4% (95% CI 53.5–91.3%), respectively.
FIGURE 3.
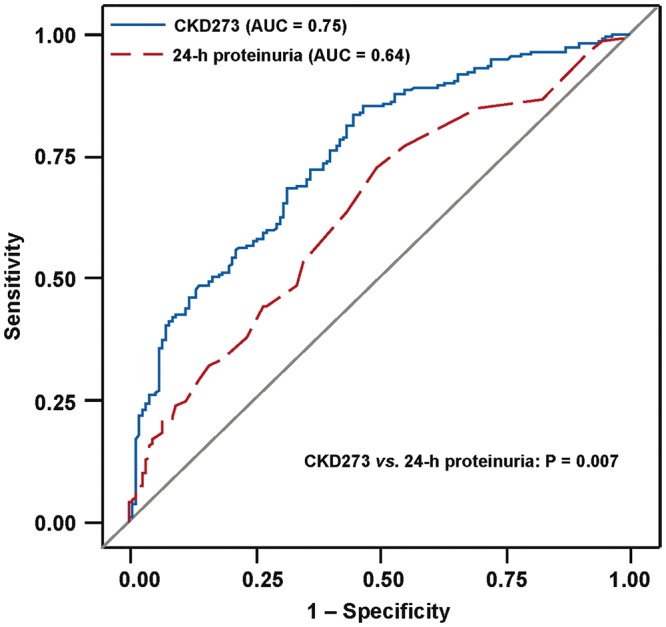
ROC curves for discrimination at follow-up between eGFR <60 versus ≥60 mL/min/1.73 m2 using CKD273 (blue) and 24-h proteinuria (red). The AUC was greater (P = 0.007) for CKD273 (0.75; 95% CI 0.70–0.80) than for 24-h proteinuria (0.64; 95% CI 0.58–0.69).
Among 368 patients, 190 (51.6%) experienced an annual decrease in eGFR of ≥1 mL/min/1.73 m2 (progressors), of whom 124 (65.3%) had an annual decrease of ≥5 mL/min/1.73 m2 (fast progressors). With adjustments as applied in Table 3, the odds ratios for 1-SD increments in CKD273 were 1.01 (95% CI 0.79–1.29; P = 0.94) and 0.95 (95% CI 0.73–1.23; P = 0.70) for progressors and fast progressors, and for 1-SD increments in proteinuria 1.05 (95% CI 0.84–1.30; P = 0.68) and 1.13 (95% CI 0.90–1.43; P = 0.29), respectively.
DISCUSSION
CKD is a matter of concern in HTx patients, in part due to the nephrotoxic effect of immunosuppressive drugs [11]. In the current single-centre study of 368 HTx recipients, we applied urinary proteomics to assess whether renal dysfunction and especially a loss of renal function was associated with the urinary proteome. In cross-sectional analyses, CKD273 and a fragment of the mucin-1 subunit α were associated with lower eGFR and a collagen I fragment with higher eGFR. In analyses relating to eGFR at follow-up to the urinary markers at baseline, the AUC was significantly greater for CKD273 than for 24-h proteinuria and an optimized CKD273 threshold of 0.154 improved discrimination between eGFR categories (<60 versus ≥60 mL/min/1.73 m2) over and beyond baseline 24-h proteinuria and other risk factors for renal dysfunction. Finally, associations between the changes in eGFR and the urinary markers were inverse for CKD273 and the mucin-1 subunit α and positive for urinary collagen I.
In this study, the prevalence of CKD increased with time since HTx. Using eGFR cut-offs of 60/30 mL/min/1.73 m2, the prevalence across quartiles of the time interval since HTx rose from 32/3% over 47/4% and 64/13% to 82/16% (Table 1). A cross-sectional 14-centre study of 1062 HTx patients, yielded slightly different but directionally similar estimates over time intervals comparable to those in this study [26]. The prevalence of renal dysfunction increased from 47/6% over 56/7% and 54/9% to 52/16% [26]. Thus, decline in renal function over time since HTx is commonly observed in all transplant centres, justifying research into biomarkers prognostically or mechanistically associated with renal dysfunction.
Our current findings in HTx recipients on nephrotoxic immunosuppressants extend observations from previous studies in patients with [5, 6] or at high risk [7] of CKD. CKD273 was first developed in a cohort of 230 individuals with CKD of diverse origin and 379 healthy individuals [5]. In the same study, CKD273 was validated in an independent test set of 110 individuals with CKD and 34 healthy individuals and yielded an AUC of 0.96 [5]. The CKD273 classifier consists mainly of peptide fragments of collagen [5]. CKD273 was a sensitive marker of renal dysfunction in multiple studies reviewed in detail elsewhere [27]. In a multicentre cohort of 1990 individuals, including 522 with follow-up data, CKD273 performed significantly better in detecting and predicting progression of CKD than urinary albumin, and improved both IDI (+5.8%) and NRI (+30.3%) [28]. A subsequent study moved away from established CKD and validated CKD273 as a predictor of early Stage 3 renal dysfunction [28]. This subject-level meta-analysis included 2087 individuals from six cohorts [7]. All participants had a baseline eGFR of ≥60 mL/min/1.73 m2, 73.5% had diabetes mellitus and 6.2% had microalbuminuria. Over five follow-up visits, eGFR decreased more with higher baseline CKD273 than with higher urinary albumin excretion rate (1.64 versus 0.82 mL/min/1.73 m2; P < 0.0001) [7]. Over 4.6 years, 390 participants experienced a first renal endpoint (eGFR decrease by 10 mL/min/1.73 m2 to <60 mL/min/1.73 m2) and 172 a sustained renal endpoint persisting over at least 3 months with no increase >60 mL/min/1.73 m2 at any time during the remainder of follow-up [7]. The risk of a first and sustained renal endpoint increased with the albumin excretion rate (P ≤ 0.043) and CKD273 (P ≤ 0.031), but only CKD273 (P = 0.039) improved discrimination between progressors and non-progressors [28]. Most patients in the current study were taking calcineurin inhibitors, which decrease proteinuria [29, 30]. This antiproteinuric effect may have contributed to the superiority of CKD273 over and beyond proteinuria.
Our current observation that lower eGFR was cross-sectionally associated with higher levels of a mucin-1 subunit α fragment and that declining eGFR was associated with increasing mucin-1 subunit α levels extended previous findings in CKD patients [5–7] and in the general population [4, 9]. In the subject-level meta-analysis of patients at high risk of CKD [7], mucin-1 was among the top 20 peptide fragments predictive of eGFR decline <60 mL/min/1.73 m2. In 805 randomly recruited Flemish, baseline eGFR was 4.48 mL/min/1.73 m2 lower (P < 0.0001) with each 1-SD increment in urinary mucin-1 [9]. Relative risk of having or progressing to eGFR <60 mL/min/1.73 m2 was also associated with the fragment of mucin-1 subunit α. PLS analysis confirmed mucin-1 (p8342) as the strongest urinary marker associated with decreased eGFR. Mucin-1 predicted eGFR decline to <60 mL/min/1.73 m2 over and beyond microalbuminuria (P = 0.011) and retained significance, when baseline eGFR was accounted for [9]. Mucin-1 is a high-molecular weight (400 kDa) membrane-tethered glycoprotein [31], which normal kidneys express in the thick segment of Henle’s loop and in the distal tubules and collecting ducts [32–34]. The mucin-1 subunit α protrudes 200–500 nm above the plasma membrane, far above all other membrane-associated proteins within the 10 nm protective glycocalyx [35]. The main function of mucin-1 is to shield cell surfaces by maintenance of a luminal epithelial mucobarrier [36]. Mucin-1 is chemotactic for human fibroblasts [37], inhibits cellular binding to collagen I and IV [31], and stimulates expression of hypoxia-inducible transcription factors, which orchestrate a protective response against acute kidney injury [38]. Further evidence supporting mucin-1 as a marker of renal dysfunction originated from genetic studies. A frameshift mutation in the mucin-1 (MUC1) gene, located on chromosome 1 (1q21) [39], creates a new peptide that accumulates inside the MUC1 expressing renal tubular cells [40, 41] and causes autosomal dominant medullary cystic kidney disease type 1.
In line with observations from a previously reported population study [9], we observed that in HTx patients baseline eGFR and change in eGFR were positively associated with collagen I fragments, inversely with a collagen II fragment and positively or negatively with two collagen III fragments. Several mechanisms might explain the bidirectional associations of eGFR with diverse collagen fragments. Higher levels of tissue inhibitor of matrix metalloproteinase type 1, as observed in patients with renal dysfunction [42], might inhibit the breakdown of collagen. If originating from extrarenal sites, collagen fragments, depending on their size, might either be insufficiently retained by the glomerular sieve or fail to be reabsorbed in the tubules. Finally, reactive overexpression of mucin-1 in the tubular epithelium of patients with early renal impairment, might lead to less retention of collagen fragments [31].
We performed urinary proteomics at baseline and follow-up in a relative large HTx patient cohort. Notwithstanding these strong points, our study must also be interpreted within the context of its potential limitations. First, follow-up time was short with a median follow-up of 9.1 months, which probably explains that accounting for baseline eGFR removed the significance of both CKD273 and 24-h proteinuria in predicting imminent decline of eGFR to <60 mL/min/1.73 m2. Secondly, our study was a single-centre study so that the generalizability of our observations on CKD273 and the sequenced urinary fragments remains to be confirmed in other HTx cohorts. However, decline of renal function with time since HTx is a common phenomenon observed in most if not all HTx centres [26]. Thirdly, because 97.2% of our HTx patients were using directly nephrotoxic calcineurin inhibitors, we could not compare the urinary peptidomic signature among the different classes of immunosuppressive agents. However, we did not observe any differences in the characteristics of patients who received an mTOR inhibitor and those who did not (Supplementary data, Table S5). Finally, a calibration analysis would have strengthened our current findings, but compared with other studies in which this approach was applied [43] our sample size was far too small. Indeed, among the 162 patients with a eGFR at or >60 mL/min/1.73 m2, the number of cases whose eGFR dropped below this threshold was only 24.
CONCLUSIONS
In keeping with a previous individual-level meta-analysis in predominantly diabetic patients [7] and with the exception of the baseline eGFR, CKD273 was also in HTx patients more closely associated with renal dysfunction than 24-h proteinuria. The Food and Drug Administration supports further development of CKD273 in the context of CKD [8]. A recently published report suggested that using CKD273 instead of the urinary albumin excretion might be cost-effective [44]. Consistent with studies in the general population [9] and in patients [7], impairment of renal function in HTx patients was associated with shedding of the mucin-1 subunit α, an extracellular protein expressed in the luminal membrane of renal tubular cells. In line with the concept that renal and extra-renal fibrosis is a hallmark of CKD, fragments of collagen were also associated with eGFR and change in eGFR in HTX patients.
Supplementary Material
ACKNOWLEDGEMENTS
The authors gratefully acknowledge the expert clerical assistance of Vera De Leebeeck and Renilde Wolfs.
FUNDING
The European Union (HEALTH-F7-305507 HOMAGE), the European Research Council (Advanced Researcher Grant 2011-294713-EPLORE and Proof-of-Concept Grant 713601-uPROPHET), the European Research Area Net for Cardiovascular Diseases (JTC2017-046-PROACT) and the Fonds voor Wetenschappelijk Onderzoek Vlaanderen, Ministry of the Flemish Community, Brussels, Belgium (G.0881.13) currently support the Studies Coordinating Centre in Leuven.
AUTHORS’ CONTRIBUTIONS
J.A.S. designed the study; Q.-F.H., J.V.K. and S.T. constructed the database; Q.-F.H., Z.-Y.Z., W.-Y.Y. and L.T. analysed the data; J.V., L.N.L.V.A., J.V.C., S.J. and P.V. coordinated the heart transplant program and collected the clinical data; E.N.-K. and H.M. supervised the proteomics; Q.-F.H. and J.A.S. drafted the manuscript; all authors revised the manuscript and approved the final version.
CONFLICT OF INTEREST STATEMENT
H.M. is cofounder and a shareholder of Mosaiques Diagnostics AG. E.N.-K. is an employee of Mosaiques Diagnostics AG. The other authors declare no conflicts of interest.
REFERENCES
- 1. Lindsey ML, Mayr M, Gomes AV et al. Transformative impact of proteomics on cardiovascular health and disease: a scientific statement from the American Heart Association. Circulation 2015; 132: 852–872 [DOI] [PubMed] [Google Scholar]
- 2. Stalmach A, Albalat A, Mullen W et al. Recent advances in capillary electrophoresis coupled to mass spectrometry for clinical proteomic applications. Electrophoresis 2013; 34: 1452–1464 [DOI] [PubMed] [Google Scholar]
- 3. Klein J, Papadopoulos T, Mischak H et al. Comparison of CE-MS/MS and LC-MS/MS sequencing demonstrates significant complementarity in natural peptide identification in human urine. Electrophoresis 2014; 35: 1060–1064 [DOI] [PubMed] [Google Scholar]
- 4. Gu YM, Thijs L, Liu YP et al. The urinary proteome as correlate and predictor of renal function in a population study. Nephrol Dial Transplant 2014; 29: 2260–2268 [DOI] [PubMed] [Google Scholar]
- 5. Good DM, Zürbig P, Argilés A et al. Naturally occurring human urinary peptides for use in diagnosis of chronic kidney disease. Mol Cell Proteomics 2010; 9: 2424–2437 [DOI] [PMC free article] [PubMed] [Google Scholar]
- 6. Zürbig P, Jerums G, Hovind P et al. Urinary proteomics for early diagnosis in diabetic nephropathy. Diabetes 2012; 61: 3304–3313 [DOI] [PMC free article] [PubMed] [Google Scholar]
- 7. Pontillo C, Zhang ZY, Schanstra JP et al. Prediction of chronic kidney disease stage 3 by CKD273, a urinary proteomic biomarker. Kidney Int Rep 2017; 2: 1066–1075 [DOI] [PMC free article] [PubMed] [Google Scholar]
- 8. Nkuipou-Kenfack E, Zürbig P, Mischak H.. The long path towards implementation of clinical proteomics: exemplified based on CKD273. Prot Clin Appl 2017; 11: 1600104. [DOI] [PubMed] [Google Scholar]
- 9. Zhang ZY, Ravassa S, Pejchinovski M et al. A urinary fragment of mucin-1 subunit a is a novel biomarker associated with renal dysfunction in the general population. Kidney Int Rep 2017; 2: 811–820 [DOI] [PMC free article] [PubMed] [Google Scholar]
- 10. Tutakhel OAZ, Moes AD, Valdez-Flores MA et al. NaCl cotransporter abundance in urinary vesicles is increased by calcineurin inhibitors and predicts thiazide sensitivity. PLoS One 2017; 12: e0176220. [DOI] [PMC free article] [PubMed] [Google Scholar]
- 11. Zdanowicz MM. The pharmacology of immunosuppression. Am J Pharm Educ 2009; 73: 144. [DOI] [PMC free article] [PubMed] [Google Scholar]
- 12. Huang QF, Trenson S, Zhang ZY et al. Urinary Proteomics in Predicting Heart Transplantation Outcomes (uPROPHET) - Rationale and database description. PLoS One 2017; 12: e0184443. [DOI] [PMC free article] [PubMed] [Google Scholar]
- 13.World Medical Association. World Medical Association Declaration of Helsinki. Ethical principles for medical research involving human subjects. JAMA 2013; 310: 2191–2194 [DOI] [PubMed] [Google Scholar]
- 14. McDowell TL. Benzethonium chloride method for proteins adapted to centrifugal analysis. Clin Chem 1985; 31: 864–866 [PubMed] [Google Scholar]
- 15. Jaffe M. Über den Niederschlag, welchen Pikrinsäure in normalen Harn erzeugt und über eine neue Reaction des Kreatinins. Z Physiol Chem 1886; 10: 391–400 [Google Scholar]
- 16. Myers GL, Miller WG, Coresh J et al. Recommendations for improving serum creatinine measurement: a report from the laboratory working group of the National Kidney Disease Education Program. Clin Chem 2006; 52: 5–18 [DOI] [PubMed] [Google Scholar]
- 17. Levey AS, Stevens LA, Schmid CH et al. A new equation to estimate glomerular filtration rate. Ann Intern Med 2009; 150: 604–612 [DOI] [PMC free article] [PubMed] [Google Scholar]
- 18. Stevens PE, Levin A. Kidney Disease: Improving Global Outcomes Chronic Kidney Disease Guideline Development Work Group Members. Evaluation and management of chronic kidney disease: synopsis of the kidney disease: improving global outcomes 2012 clinical practice guideline. Ann Intern Med 2013; 158: 825–830 [DOI] [PubMed] [Google Scholar]
- 19.Expert Committee on the Diagnosis and Classification of Diabetes Mellitus. Report of the expert committee on the diagnosis and classification of diabetes mellitus. Diabet Care 2003; 26: S5–S20 [DOI] [PubMed] [Google Scholar]
- 20. Mischak H, Kolch W, Aivaliotis M et al. Comprehensive human urine standards for comparability and standardization in clinical proteome analysis. Prot Clin Appl 2010; 4: 464–478 [DOI] [PMC free article] [PubMed] [Google Scholar]
- 21. Delles C, Schiffer E, von Zur Muhlen C et al. Urinary proteomic diagnosis of coronary artery disease: identification and clinical validation in 623 individuals. J Hypertens 2010; 28: 2316–2322 [DOI] [PubMed] [Google Scholar]
- 22. Jantos-Siwy J, Schiffer E, Brand K et al. Quantitative urinary proteome analysis for biomarker evaluation in chronic kidney disease. J Proteome Res 2009; 8: 268–281 [DOI] [PubMed] [Google Scholar]
- 23. Blom G. Statistical estimates and transformed beta-variables. Biom J 1961; 3: 285 [Google Scholar]
- 24. Tobias RD. An introduction to partial least squares regression. Cary, NC: SAS Institute Inc, 1997, 1250–1257 [Google Scholar]
- 25. Pencina MJ, D'Agostino RB, D'Agostino RB Jr et al. Evaluating the added predictive ability of a new marker: from area under the ROC curve to reclassification and beyond. Stat Med 2008; 27: 157–172 [DOI] [PubMed] [Google Scholar]
- 26. Crespo-Leiro MG, Delgado JF, Paniagua MJ et al. Prevalence and severity of renal dysfunction among 1062 heart transplant patients according to criteria based on serum creatinine and estimated glomerular filtration rate: results from the CAPRI study. Clin Transplant 2010; 24: E88–E93 [DOI] [PubMed] [Google Scholar]
- 27. Pontillo C, Jacobs L, Staessen JA et al. Urinary proteome-based classifier for the early detection of decline in glomerular filtration. Nephrol Dial Transplant 2017; 32: 1510–1516 [DOI] [PubMed] [Google Scholar]
- 28. Schanstra JP, Zürbig P, Alkhalaf A et al. Diagnosis and prediction of CKD progression by assessment of urinary peptides. J Am Soc Nephrol 2015; 26: 1999–2010 [DOI] [PMC free article] [PubMed] [Google Scholar]
- 29. Yap DYH, Ma MKM, Mok MMY et al. long-term data on tacrolimus treatment in lupus nephritis. Rheumatology (Oxford) 2014; 53: 2232–2237 [DOI] [PubMed] [Google Scholar]
- 30. Shen X, Jiang H, Ying M et al. Calcineurin inhibitors cyclosporin A and tacrolimus protect against podocyte injury induced by puromycin aminonucleoside in rodent models. Sci Rep 2016; 6: 32087. [DOI] [PMC free article] [PubMed] [Google Scholar]
- 31. Apostolopoulos V, Stojanovska L, Gargosky SE.. MUC1 (CD227): a multi-tasked molecule. Cell Mol Life Sci 2015; 72: 4475–4500 [DOI] [PMC free article] [PubMed] [Google Scholar]
- 32. Takahashi T, Takamura K, Sakaue S et al. Elevated serum KL-6 concentrations in patients with diabetes mellitus. J Diabetes Complicat 2002; 16: 352–358 [DOI] [PubMed] [Google Scholar]
- 33. Leroy X, Copin MC, Devisme L et al. Expression of human mucin genes in normal kidney and renal cell carcinoma. Histopathyology 2002; 40: 450–457 [DOI] [PubMed] [Google Scholar]
- 34. Cao Y, Karsten U, Zerban H et al. Expression of MUC1, Thomsen-Friedenreich-related antigens, and cytokeratin 19 in human renal cell carcinomas and tubular clear cell lesions. Virchows Arch 2000; 436: 119–126 [DOI] [PubMed] [Google Scholar]
- 35. Zhang D, Isaka Y, Imamura R et al. Glycocalyx damage estimated using colloidal iron staining. Cell Transplant 2008; 17: 159–163 [DOI] [PubMed] [Google Scholar]
- 36. Eckardt KU, Alper SL, Antignac C et al. Autosomal dominant tubulointerstitial kidney disease: diagnosis, classification, and management–A KDIGO consensus report. Kidney Intern 2015; 88: 676–683 [DOI] [PubMed] [Google Scholar]
- 37. Hirasawa Y, Kohno N, Yokoyama A et al. KL-6, a human MUC1 mucin, is chemotactic for human fibroblasts. Am J Respir Cell Mol Biol 1997; 17: 501–507 [DOI] [PubMed] [Google Scholar]
- 38. Pastor-Soler NM, Sutton TA, Mang HE et al. Muc1 is protective during kidney ischemia-reperfusion injury. Am J Physiol Renal Physiol 2015; 308: F1452–F1462 [DOI] [PMC free article] [PubMed] [Google Scholar]
- 39. Kirby A, Gnirke A, Jaffe DB et al. Mutations causing medullary cystic kidney disease type 1 lie in a large VNTR in MUC1 missed by massively parallel sequencing. Nat Genet 2013; 45: 299–303 [DOI] [PMC free article] [PubMed] [Google Scholar]
- 40. Ekici AB, Hackenbeck T, Morinière V et al. Renal fibrosis is the common feature of autosomal dominant tubulointerstitial kidney diseases caused by mutations in mucin 1 or uromodulin. Kidney Int 2014; 86: 589–599 [DOI] [PubMed] [Google Scholar]
- 41. Bleyer AJ, Kmoch S, Antignac C et al. Variable clinical presentation of an MUC1 mutation causing medullary cystic kidney disease type 1. Clin J Am Soc Nephrol 2014; 9: 527–535 [DOI] [PMC free article] [PubMed] [Google Scholar]
- 42. Hörstrup JH, Gehrmann M, Schneider B et al. Elevation of serum and urine levels of TIMP-1 and tenascin in patients with renal disease. Nephrol Dial Transplant 2002; 17: 1005–1013 [DOI] [PubMed] [Google Scholar]
- 43. Jacobs L, Efremov L, Ferreira JP et al. Risk for incident heart failure: a subject-level meta-analysis from the Heart “OMics” in AGEing (HOMAGE) study. J Am Heart Assoc 2017; 6: e005231. [DOI] [PMC free article] [PubMed] [Google Scholar]
- 44. Bahlmann FH, Critselis E, Pontillo C et al. Comparison of the cost-effectiveness of the urinary based CKD273 biomarker panel and current clinical practices in the management of chronic kidney disease progression. Nephrol Dial Transplant 2015; 30 (Suppl 3): iii303 [Google Scholar]
Associated Data
This section collects any data citations, data availability statements, or supplementary materials included in this article.