

Abstract
Aims
To compare the pharmacodynamic effects of the highest approved doses of the sodium glucose co‐transporter 2 (SGLT2) inhibitors canagliflozin and dapagliflozin on urinary glucose excretion (UGE), renal threshold for glucose excretion (RTG) and postprandial plasma glucose (PPG) excursion in healthy participants in a randomized, double‐blind, two‐period crossover study.
Methods
In each treatment period, participants (n = 54) received canagliflozin 300 mg or dapagliflozin 10 mg for 4 days (20 min before breakfast). A mixed‐meal tolerance test (600 kcal; 75 g glucose) was performed at baseline and on day 4 of each treatment period to assess changes in incremental PPG (PPGΔAUC 0–2 h). We measured 24‐h UGE and plasma glucose on day 4 to determine 24‐h mean RTG.
Results
Canagliflozin 300 mg and dapagliflozin 10 mg had similar effects on UGE and RTG for 4 h after dosing, but canagliflozin was associated with higher UGE and greater RTG reductions for the remainder of the day. Mean 24‐h UGE was ∼25% higher with canagliflozin than with dapagliflozin (51.4 vs. 40.8 g), and 24‐h mean RTG was ∼0.4 mmol/l (7 mg/dl) lower with canagliflozin than with dapagliflozin (3.79 vs. 4.17 mmol/l; p < 0.0001). Dapagliflozin had no effect on PPG excursion; canagliflozin delayed and reduced PPG excursion (between‐treatment difference in PPGΔAUC 0–2 h from baseline expressed as a percentage of baseline mean, −10.2%; p = 0.0122). Canagliflozin and dapagliflozin were generally well tolerated.
Conclusions
In healthy participants, canagliflozin 300 mg provided greater 24‐h UGE, a lower RTG and smaller PPG excursions than dapagliflozin 10 mg.
Keywords: canagliflozin, dapagliflozin, pharmacodynamics, phase I–II study, SGLT2 inhibitor, type 2 diabetes
Introduction
Canagliflozin and dapagliflozin are the first two sodium glucose co‐transporter 2 (SGLT2) inhibitors to be approved in the USA and Europe for use as an adjunct to diet and exercise to improve glycaemic control in adults with type 2 diabetes mellitus (T2DM) 1, 2. These drugs decrease plasma glucose (PG) levels by lowering the renal threshold for glucose excretion (RTG) and reducing renal glucose reabsorption, thereby increasing urinary glucose excretion (UGE) 3, 4, 5, 6, 7. In addition to reducing hyperglycaemia, the increase in UGE observed with SGLT2 inhibition is associated with a mild osmotic diuresis and loss of calories leading to weight loss 1.
It has been estimated that the highest approved therapeutic dose of dapagliflozin (10 mg) increases 24‐h UGE in healthy individuals to ∼70% of the maximum UGE observed at higher dapagliflozin doses of 20–100 mg 8. By contrast, 24‐h UGE values reported in studies of canagliflozin in healthy participants indicate that canagliflozin provides near‐maximal effects on UGE at doses >200 mg 4; however, the lack of direct comparison limits the ability to make definitive conclusions about the possible pharmacodynamic (PD) differences between canagliflozin and dapagliflozin.
In addition to inhibition of renal SGLT2 leading to increased UGE, the 300‐mg dose of canagliflozin has been shown to lower postprandial plasma glucose (PPG) and insulin concentrations by delaying intestinal glucose absorption 9. This effect is thought to be attributable to transient inhibition of intestinal sodium glucose co‐transporter 1 (SGLT1), which occurs shortly after the drug is administered and when intraluminal gut drug concentrations are predicted to be high. The delayed rise in PPG and insulin seen with canagliflozin doses of 300 mg or higher was not observed with doses ≤200 mg 4. Although no data have been published describing the effects of dapagliflozin on intestinal glucose absorption, it has been hypothesized that dapagliflozin 10 mg would have no effect on intestinal SGLT1 because of the greater selectivity of dapagliflozin for SGLT2 compared with SGLT1 (the SGLT2:SGLT1 half‐maximal inhibitory concentration [IC50] ratio is ∼1400 for dapagliflozin 10 compared with ∼160 for canagliflozin 11), and the lower doses of dapagliflozin used compared with canagliflozin.
The aim of the present study was to directly compare the PD effects of canagliflozin and dapagliflozin at their highest approved therapeutic doses (300 and 10 mg, respectively). Key PD measures included 24‐h mean RTG, which is mediated primarily by renal SGLT2 inhibition, and PPG excursion, which is mediated by both renal SGLT2 and intestinal SGLT1 inhibition.
Materials and Methods
Study Population
Eligible participants included men and women aged 18–55 years, who were deemed healthy based on medical history, vital signs, physical examination, 12‐lead electrocardiogram (ECG), and clinical laboratory tests performed during screening. Participants were required to have a body mass index of 20–27 kg/m2, body weight ≥50 kg, systolic blood pressure between 90 and 140 mmHg, and diastolic blood pressure ≤90 mmHg based on an average of three readings at screening. Women were required to be postmenopausal, surgically sterile or practising a highly effective method of birth control. Individuals were excluded if they had a history of current or clinically significant medical illness including, but not limited to, cardiac arrhythmias or other cardiac disease, haematological disease, coagulation disorders, lipid abnormalities, significant pulmonary disease, diabetes mellitus, hepatic or renal insufficiency, thyroid disease, neurological or psychiatric disease, infection, malignancy (except squamous and basal cell carcinomas of the skin or carcinoma in situ of the cervix), or any other illness that the investigator felt should exclude the subject or that could interfere with interpretation of study results. Use of any prescription or non‐prescription medication was prohibited within 21 days before randomization, with the exceptions of acetaminophen, hormonal contraceptives and hormone replacement therapy.
The study was conducted in accordance with the ethical principles that have their origin in the Declaration of Helsinki and are consistent with Good Clinical Practice and applicable regulatory requirements. The study protocol and amendments were approved by an independent ethics committee at the participating centre. All patients provided informed, written consent before participation. The study was registered with ClinicalTrials.gov under the number NCT01877889.
Study Design
This was a randomized, double‐blind, two‐stage group sequential, two‐period crossover study. Each participant underwent a screening phase (up to 3 weeks), a baseline phase (11 days, including a 2‐day domiciled period), a double‐blind treatment phase (4 days, including two 3‐day domiciled periods, with a 12–14‐day washout period between study drug doses in periods 1 and 2), and a follow‐up phase (7–10 days after the last dose of study drug; Figure 1). On the day −12 visit before randomization, participants were counselled to adhere to a specified at‐home diet recommended by a dietician to provide a normal, weight‐maintaining, balanced diet. Participants were admitted to the clinical research centre on the morning of day −11, at which time eligibility, safety and dietary compliance evaluations were completed. Eligible participants remained domiciled and received standardized meals until completion of a mixed‐meal tolerance test (MMTT) on the morning of day −10.
Figure 1.

Study design. DAPA, dapagliflozin; CANA, canagliflozin; MMTT, mixed‐meal tolerance test; RTG, renal threshold for glucose excretion.
Just before this baseline MMTT, participants were randomized (1:1) to one of two treatment sequences, AB or BA. Treatment A was dapagliflozin 10 mg, and treatment B was canagliflozin 300 mg. Canagliflozin 300 mg and dapagliflozin 10 mg tablets were identically over‐encapsulated to ensure treatment blinding. Canagliflozin tablets used in the present study were manufactured and provided by the sponsor (Janssen Pharmaceuticals, Titusville, NJ, USA; batch number 33977.8). Commercially available dapagliflozin 10 mg tablets (Forxiga®; Bristol‐Myers Squibb/AstraZeneca EEIG, Middlesex, UK) were used in the study (batch numbers 13D23/G073 and 13J03/G073).
For the MMTT, participants had an intravenous catheter placed at least 1 h before the start of the test at time 0. At time 0, participants began ingesting a standard meal containing ∼600 calories (∼55% carbohydrate, 30% fat and 15% protein); the liquid component of the meal contained 75 g of glucose. Blood samples for PG measurement were drawn at −15, −10 and −5 min before the MMTT and at 0.25, 0.5, 1, 1.5, 2, 3 and 4 h after receiving the standard meal.
On day 1 of each treatment period, participants returned to the study centre after an overnight fast to receive the first dose of double‐blind study drug, and were instructed to return the next day after an overnight fast. On day 2, participants received the study drug at the study centre and were instructed to adhere to the dietician‐specified, at‐home diet until they returned the next morning after an overnight fast. On the morning of day 3, participants were admitted to the study centre and were domiciled until completing all study procedures. On day 3, participants were assessed for dietary compliance and received the study drug ∼20 min before a standard breakfast. Later in the day, participants received a standard lunch and dinner, and began fasting at ∼19:00 hours. On the morning of day 4, participants received the study drug ∼20 min before starting an MMTT (time = 0; identical to the baseline MMTT). Urine sample collection for the measurement of urinary glucose and creatinine was started at time 0 at intervals of 0–2, 2–4, 4–10, 10–14 and 14–24 h. Blood samples for measurement of PG were collected at −15, −10 and −5 min before the MMTT at t = 0, and at 0.25, 0.5, 0.75, 1, 1.5, 2, 3, 4, 4.5, 5, 6, 7, 8, 10, 10.5, 11, 12, 13, 14 and 24 h. Participants were discharged on the morning of day 5. Participants in period 1 were instructed to return after a 12–14‐day washout period to undergo the same procedures for period 2, and participants in period 2 were instructed to return for a follow‐up visit 7–10 days after the last dose of study medication.
Endpoints and Assessments
Pharmacokinetics
Venous blood samples (∼2 ml) were collected at predose and at 0.25, 1, 2, 4, 8, 12 and 24 h relative to the start of the MMTT (study drug was administered 20 min before the start of the MMTT) for the measurement of plasma canagliflozin and dapagliflozin concentrations using a validated liquid chromatography–tandem mass spectrometry method. Plasma canagliflozin and dapagliflozin concentration‐time data using actual sampling times were used to calculate the maximum observed plasma concentration (Cmax), time to reach Cmax(tmax), and area under the plasma concentration‐time curve during a dosing interval (AUCτ,ss) via a non‐compartmental model analysis using validated Phoenix™WinNonlin® software (Pharsight Corp., Certara, L.P., St. Louis, MO, USA).
Pharmacokinetics/Pharmacodynamics
The exposure‐response relationship for the effects of canagliflozin and dapagliflozin on RTG was assessed using the estimated unbound plasma drug concentrations (estimated to be 9% for dapagliflozin 7 and 1% for canagliflozin 12). To facilitate comparisons, the unbound drug concentrations were normalized by the in vitro IC50 values for each drug (1.1 nmol/l for dapagliflozin 13 and 4.4 nmol/l for canagliflozin 11). Over each of the time intervals where RTG was calculated, the mean unbound drug concentrations were calculated using the following equation:
The resulting pharmacokinetics (PK) and RTG data for each subject and drug were plotted and fit to an Emax model 14:
where Drug is the mean IC50‐normalized unbound concentration over the time interval where RTG was calculated, RTG,min represents the minimum RTG value and EC50 is the half‐maximal effective concentration (expressed relative to the in vitro IC50). The untreated value of 10 mmol/l used in the equation was based on commonly reported values of RTG in healthy subjects 15, 16. When fitting the data for each drug separately, the parameter values were not significantly different between canagliflozin and dapagliflozin and therefore, the best‐fit values of RTG,min and EC50 were obtained using the combined data from both drugs. Analyses were performed using non‐linear regression in matlab version 7.10 (using the nlinfit command).
Pharmacodynamics
Blood and urine glucose concentrations for PD analyses were measured using the hexokinase assay (Roche, Indianapolis, IN, USA) and were performed at MLM Medical Labs GmbH in Germany.
The primary PD endpoint was the between‐treatment difference in 24‐h mean RTG for canagliflozin 300 mg compared with dapagliflozin 10 mg. RTG was chosen as the primary measure of SGLT2 inhibition because the rate of UGE is dependent on both drug concentration and the filtered glucose load (which could be different between treatments if PG is differentially affected), whereas potential differences in PG would be accounted for when calculating the RTG values. The key secondary PD endpoint was the between‐treatment difference in incremental PPG area under the curve (AUC) at 0–2 h (PPGΔAUC0–2 h) expressed as a percentage of the baseline mean. Other secondary endpoints included 24‐h UGE, UGE intervals, RTG intervals, and maximum incremental PPG values. RTG, defined as the PG level at which renal glucose transporters begin to be saturated and above which glucose is excreted in the urine, was calculated as described previously 3, 4, 9. Briefly, the calculation was based on the assumption that UGE can be approximated by a threshold process using measured UGE, PG and 24‐h creatinine clearance (used to estimate glomerular filtration rate). Post‐dose RTG values were calculated for each scheduled urine collection interval, and the daily (24‐h) mean RTG was calculated as the weighted average of values obtained over each of these intervals. Based on individual PG concentration‐time data using actual sampling time, PPGΔAUC0–2 h was determined using the trapezoid rule to calculate the incremental positive area above the mean pre‐MMTT PG concentration over the 0–2‐h interval with validated Phoenix WinNonlin software. The amount of UGE over each urine collection interval was calculated by multiplying the measured urinary volume by the urinary glucose concentration. Cumulative daily (0–24 h) UGE was calculated as the sum of the UGE over the intervals from 0–2, 2–4, 4–10, 10–14 and 14–24 h.
Safety
Safety was evaluated by examining the incidence and type of adverse events (AEs), changes in vital signs (blood pressure and pulse rate), ECGs and clinical laboratory tests (haematology, serum chemistry and urine analysis).
Statistical Analyses
All analyses were performed using the PD analysis set, as predefined in the statistical analysis plan, which consisted of all participants who had PD data available for both treatment periods.
Sample Size Determination
Sample size estimates were performed based on the primary PD endpoint (24‐h mean RTG) and the key secondary endpoint of change from baseline in PPGΔAUC0–2 h. For calculations based on the primary endpoint, a mean difference of 0.56 mmol/l (10 mg/dl) was used based on observations from previous studies in healthy participants showing mean treatment differences in 24‐h mean RTG between canagliflozin 300 and 100 mg from 0.50 to 0.72 mmol/l (9–13 mg/dl) 4, and on the assumption that dapagliflozin would have an effect on RTG similar to that of canagliflozin 100 mg based on published UGE data 4, 8. Assuming an intrasubject standard deviation (s.d.) of 0.33 mmol/l (6 mg/dl) for 24‐h mean RTG and a one‐sided level of significance of 2.5%, a sample size of 10 participants was estimated to be sufficient to detect a between‐treatment difference of 0.56 mmol/l in 24‐h mean RTG between canagliflozin 300 mg and dapagliflozin 10 mg with 80% power.
Sample size calculations based on the change from baseline in PPGΔAUC0–2 h were performed using data from a canagliflozin phase I study in patients with T2DM 17 and a canagliflozin pilot study in six healthy participants. Based on these data and the assumption that dapagliflozin 10 mg would not affect gut glucose absorption, a between‐treatment difference in PPGΔAUC0–2 h of 0.56 mmol·h/l (∼12% of baseline) and an intrasubject s.d. of 1.0 mmol·h/l for PPGΔAUC0–2 hwere chosen. Using a one‐sided level of significance of 2.5%, a sample size of 54 participants was estimated to be sufficient to detect a between‐treatment difference in PPGΔAUC0–2 h of 0.56 mmol·h/l with 80% power. It was decided to use the larger sample size estimate (N = 54) for this study to ensure there was an adequate sample size for between‐treatment comparisons for both the primary and key secondary endpoints.
A two‐stage, group sequential design was applied in the present study to ensure sufficiently powered hypothesis testing and to potentially reduce the number of participants in the trial. It was planned that 34 participants would be enrolled in stage 1, and an additional 20 participants would be enrolled in stage 2.
At the end of stage 1, the 24‐h RTG and PPGΔAUC0–2 h data were evaluated, and a decision was to be made to either terminate the study or proceed to stage 2 based on an unblinded analysis by independent statisticians that used predefined stopping rules.
Pharmacodynamic Analyses
The primary and key secondary PD endpoints were analysed using mixed‐effects modelling. The mixed‐effects models were fitted with one of the PD endpoints as the dependent variable; sequence, period and treatment as fixed effects; and subject as a random effect. Based on the estimated least square (LS) means for treatments and intrasubject s.d. from the model, the difference in means between treatments B and A, and corresponding confidence intervals (CIs) were calculated. For PPGΔAUC0–2 h, the difference in means and limits of the CIs were expressed as a percentage of baseline means by dividing by the arithmetic mean at baseline and multiplying by 100.
The null hypothesis was that the mean PD values (RTG and PPGΔAUC0–2 h) of canagliflozin 300 mg and dapagliflozin 10 mg would be equal. The alternative hypothesis was that treatment with canagliflozin 300 mg would result in lower mean RTG and PPG excursion than treatment with dapagliflozin 10 mg. Because of the two‐stage group sequential design used, the overall α level of 2.5% was split such that the α level of the first stage was 1.5%. The cutoff point for stopping for success (rejection of null hypothesis) at the first stage was determined by the α level in the first stage (1.5%), giving a cutoff value of −2.17 for the test statistic, which was defined as the observed mean difference divided by the standard error of measurement. The null hypothesis would be rejected and the study would be stopped for success if the value of the test statistic from the first stage was less than −2.17.
If the study were to proceed to the second/final stage, the cutoff point for rejecting the null hypothesis, based on the analysis of pooled data from both stages, was established to achieve an overall one‐sided α level of 2.5% and was determined to be −2.14. That is, the null hypothesis would be rejected if the value of the tests statistic based on all 54 subjects was less than −2.14; otherwise, the null hypothesis would be accepted.
For the final study analysis, a 98% confidence level was used for constructing CIs for the combined data from stage 1 and stage 2. The p value for testing the null hypothesis (i.e. that the means for treatment B and A are equal) versus the alternative hypothesis (that the mean for treatment B was less than for treatment A) was reported. No formal hypothesis testing was specified for the secondary endpoints of UGE and maximum incremental PPG increase (ΔPGmax); these results were summarized using descriptive statistics.
Results
Study Population
The results from stage 1 did not achieve the prespecified stopping criteria, so the study continued into stage 2 and enrolled 20 additional subjects. Results based on data pooled from both stages are reported in the present paper.
A total of 54 study participants completed both treatment periods. Twenty‐seven participants were randomized to treatment sequence AB, and 27 were randomized to BA. Demographic and baseline characteristics were generally similar between groups (Table 1).
Table 1.
Demographic and baseline characteristics
| AB (n = 27) | BA (n = 27) | Total (N = 54) | |
|---|---|---|---|
| Gender, n (%) | |||
| Male | 24 (88.9) | 23 (85.2) | 47 (87.0) |
| Female | 3 (11.1) | 4 (14.8) | 7 (13.0) |
| Age, years | 35.1 (8.4) | 37.0 (7.9) | 36.1 (8.1) |
| Race, n (%) | |||
| White | 27 (100.0) | 27 (100.0) | 54 (100.0) |
| Body weight, kg | 80.1 (8.2) | 77.7 (8.8) | 78.9 (8.5) |
| Body mass index, kg/m2 | 24.6 (1.5) | 24.4 (1.7) | 24.5 (1.6) |
| eGFR, ml/min/1.73 m2 | 98.9 (15.9) | 94.8 (13.4) | 96.8 (14.7) |
Data are mean (standard deviation) unless otherwise indicated.
A, dapagliflozin 10 mg; B, canagliflozin 300 mg; eGFR, estimated glomerular filtration rate.
Pharmacokinetics
The mean (s.d.) concentration‐time profiles of canagliflozin 300 mg and dapagliflozin 10 mg are shown in Figure 2. For canagliflozin 300 mg, the mean (s.d.) Cmax was 6.14 (1.83) µmol/l, mean (s.d.) AUCτ,ss was 53.9 (15.6) µmol·h/l and median (range) tmax was 1.33 (1.33–4.33) h. For dapagliflozin 10 mg, the mean (s.d.) Cmax was 0.452 (0.170) µmol/l, mean (s.d.) AUCτ,ss was 1.44 (0.707) µmol·h/l and median (range) tmax was 0.58 (0.58–4.33) h. The PK values observed in the present study were similar to those observed at steady state in previous multiple‐dose studies of canagliflozin 12 and dapagliflozin 7.
Figure 2.

Plasma concentration‐time profiles after four consecutive days of once‐daily administration of (A) canagliflozin 300 mg and (B) dapagliflozin 10 mg. Data shown are mean + standard deviation.
Pharmacodynamics
The effects of multiple doses of canagliflozin 300 mg and dapagliflozin 10 mg on UGE and RTG are shown in Figure 3A and 3B, respectively. For the first 4 h after dosing, canagliflozin 300 mg and dapagliflozin 10 mg had similar effects on UGE and RTG; however, for the remainder of the 24‐h interval, treatment with canagliflozin 300 mg was associated with a larger increase in UGE and a greater reduction in RTG than treatment with dapagliflozin 10 mg. As shown in Table 2, on day 4, mean (s.d.) 24‐h UGE was ∼25% higher with canagliflozin compared with dapagliflozin [51.4 (13.0) vs. 40.8 (10.4) g]. The LS mean for 24‐h mean RTG on day 4 was 3.79 mmol/l with canagliflozin 300 mg and 4.17 mmol/l with dapagliflozin 10 mg (LS mean difference, −0.39 mmol/l; two‐sided p < 0.0001); therefore, the null hypothesis was rejected (Table 3).
Figure 3.

Effects of 4 days of treatment with canagliflozin 300 mg versus dapagliflozin 10 mg on (A) UGE, (B) RTG and (C) PPG. PPG, postprandial glucose; RTG, renal threshold for glucose excretion; UGE, urinary glucose excretion. Data shown are mean ± standard error.
Table 2.
Arithmetic mean (standard deviation) urinary glucose excretion intervals after once‐daily administration of dapagliflozin 10 mg or canagliflozin 300 mg for 4 days
| UGE (g) interval (h) | Dapagliflozin 10 mg (N = 54) | Canagliflozin 300 mg (N = 54) | Difference (95% CI) |
|---|---|---|---|
| 0–2 | 7.35 (2.13) | 7.27 (2.81) | — |
| 2–4 | 4.49 (1.56) | 5.56 (1.78) | — |
| 4–10 | 14.96 (4.34) | 16.33 (4.96) | — |
| 10–14 | 8.56 (2.86) | 10.93 (3.50) | — |
| 14–24 | 5.45 (3.54) | 11.28 (5.00) | — |
| 0–24 | 40.81 (10.45) | 51.37 (13.04) | 10.56 (6.06; 15.07) |
CI, confidence interval; UGE, urinary glucose excretion.
Table 3.
Comparison of pharmacodynamic parameters between canagliflozin and dapagliflozin
| Parameter | Dapagliflozin 10 mg (N = 54) | Canagliflozin 300 mg (N = 54) | Difference (98% CI) (canagliflozin − dapagliflozin) | Difference (98% CI) expressed as % of baseline mean | Two‐sided p value |
|---|---|---|---|---|---|
| LS mean 24‐h mean RTG, mmol/l | |||||
| Day 4 | 4.17 | 3.79 | −0.39 (−0.50; −0.28) | NA | <0.0001 |
| LS mean PPGΔAUC0–2 h, mmol·h/l | |||||
| Baseline | 4.12 | 4.12 | — | — | — |
| Day 4 | 4.08 | 3.66 | −0.42 (−0.81; −0.03) | −10.22 (−19.66; −0.78) | 0.0122 |
CI, confidence interval; LS, least squares; NA, not assessed; PPGΔAUC0–2 h, incremental postprandial plasma glucose area under the curve; RTG, renal threshold for glucose excretion.
As shown in Figure 3C, treatment with canagliflozin 300 mg delayed and reduced the PPG excursion during the MMTT compared with dapagliflozin 10 mg. The PPG excursion observed with dapagliflozin 10 mg was similar to the excursion observed at baseline (pretreatment). Compared with dapagliflozin 10 mg, canagliflozin 300 mg lowered PPGΔAUC0–2 h by ∼10%; the mean (s.d.) PPGΔAUC0–2 h was 3.66 (1.42) mmol·h/l with canagliflozin 300 mg and 4.08 (1.74) mmol·h/l with dapagliflozin 10 mg (LS mean difference=−0.42 mmol·h/l (−7.58 mg·h/dl); two‐sided p = 0.0122), thereby, resulting in rejection of the key secondary endpoint null hypothesis (Table 3). Additionally, ΔPGmax during the MMTT was decreased by ∼18% with canagliflozin 300 mg compared with dapagliflozin 10 mg [mean (s.d.) ΔPGmax = 3.42 (0.90) mmol/l with canagliflozin 300 mg versus 4.16 (1.24) mmol/l with dapagliflozin 10 mg].
Pharmacokinetics/Pharmacodynamics
The PK/PD relationship for the effects of canagliflozin and dapagliflozin on RTG is shown in Figure 4. Note that although the total plasma canagliflozin concentrations were considerably higher than the corresponding dapagliflozin concentrations (Figure 2), the IC50‐normalized unbound plasma concentrations of the two drugs were fairly similar, with the most notable difference being lower normalized concentrations of dapagliflozin during the overnight period compared with canagliflozin (Figure 4; median normalized drug concentrations in the overnight period were ∼85% higher for canagliflozin than dapagliflozin). When using the normalized drug concentrations, the PK/PD relationship appears virtually identical for both drugs and the greater effect of canagliflozin on RTG during the later portions of the day appears to be explained by the higher plasma drug concentrations maintained by canagliflozin compared with dapagliflozin. The model fit (using data from both drugs combined) yielded values (95% CI) for RTG,minof 3.20 mmol/l (3.08–3.32 mmol/l) and EC50 of 0.33 (0.28–0.39; because of the normalization used for plasma drug concentrations, the EC50 value was calculated as a multiple of the in vitro IC50 values).
Figure 4.
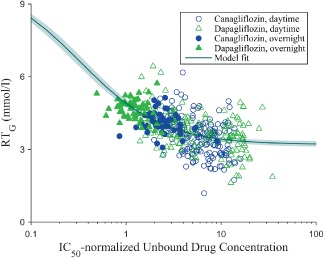
PK/PD relationship for the effect of canagliflozin and dapagliflozin on RTG. IC50, half‐maximal inhibitory concentration; PD, pharmacodynamic; PK, pharmacokinetic; RT G, renal threshold for glucose excretion. Each symbol represents an individual subject during each time interval over which RTG was calculated. Open symbols represented values obtained during the first 14 h after dosing (which occurred during the daytime) and the filled symbols represent values obtained over 14–24 h after dosing (the overnight period). The IC50‐normalized unbound drug concentrations were calculated as described in Materials and Methods. The solid line and shaded region represent the model fit and 95% confidence interval.
There was no clear relationship observed between plasma canagliflozin concentrations and the reductions in PPG seen with canagliflozin 300 mg (data not shown), consistent with the hypothesis that the postprandial effects are attributable to locally high intraluminal drug concentrations inhibiting intestinal SGLT1 rather than to high systemic plasma drug concentrations.
Safety and Tolerability
Canagliflozin 300 mg and dapagliflozin 10 mg were generally well tolerated. No serious AEs, discontinuations as a result of AEs, or deaths were reported during the study. All AEs were assessed by the investigators to be mild or moderate in intensity. The incidences of treatment‐emergent AEs were generally similar with canagliflozin and dapagliflozin (Table 4). There were no clinically meaningful changes in haematology or urine analysis results during the study. During both the canagliflozin and dapagliflozin treatment periods, small transient increases from baseline were observed in total bilirubin levels and small transient decreases from baseline were observed in creatine kinase levels; these changes returned to baseline values at the follow‐up visit. There were no clinically meaningful abnormal blood pressure or pulse rate measurements observed during the study. None of the ECG findings during the study were considered to be clinically significant.
Table 4.
Summary of adverse events reported during both treatment periods
| Participants | Dapagliflozin 10 mg (N = 54) n (%) | Canagliflozin 300 mg (N = 54) n (%) | Total (N = 54) n (%) |
|---|---|---|---|
| Any adverse event | 16 (29.6) | 18 (33.3) | 27 (50.0) |
| Headache | 6 (11.1) | 6 (11.1) | 11 (20.4) |
| Nasopharyngitis | 5 (9.3) | 0 | 5 (9.3) |
| Flatulence | 2 (3.7) | 2 (3.7) | 4 (7.4) |
| Rhinitis | 1 (1.9) | 3 (5.6) | 4 (7.4) |
| Pollakiuria | 1 (1.9) | 2 (3.7) | 3 (5.6) |
| Nausea | 1 (1.9) | 1 (1.9) | 2 (3.7) |
| Postural dizziness | 1 (1.9) | 1 (1.9) | 2 (3.7) |
| Dyspepsia | 0 | 1 (1.9) | 1 (1.9) |
| Fatigue | 0 | 1 (1.9) | 1 (1.9) |
| Glomerular filtration rate decreased | 0 | 1 (1.9) | 1 (1.9) |
| Malaise | 0 | 1 (1.9) | 1 (1.9) |
| Oropharyngeal pain | 0 | 1 (1.9) | 1 (1.9) |
| Pharyngitis | 0 | 1 (1.9) | 1 (1.9) |
| Toothache | 0 | 1 (1.9) | 1 (1.9) |
| Upper abdominal pain | 0 | 1 (1.9) | 1 (1.9) |
Discussion
Canagliflozin and dapagliflozin are the first SGLT2 inhibitors to be approved in the USA and Europe as adjunct therapy to diet and exercise to improve glycaemic control in adults with T2DM 1, 2. While canagliflozin and dapagliflozin are potent inhibitors of SGLT2, both drugs also inhibit SGLT1 in vitro, albeit less potently. Canagliflozin has an IC50 ratio of 160:1 for SGLT1:SGLT2 11, whereas the corresponding ratio for dapagliflozin is ∼1400:1 10. Previous studies have not evaluated whether the difference in SGLT2 versus SGLT1 selectivity results in differences in PD properties or efficacy. The present study is the first to directly compare the PD properties of canagliflozin and dapagliflozin at their highest approved therapeutic doses in healthy subjects. This study evaluated both 24‐h mean RTG (mediated primarily by renal SGLT2 inhibition) and PPG excursion (mediated by both renal SGLT2 and intestinal SGLT1 inhibition).
The PK/PD relationship for the effects of canagliflozin and dapagliflozin on RTG suggested that both drugs act similarly to inhibit renal SGLT2. After adjusting for differences in plasma protein binding and in vitro potency, the exposure‐response relationship for the effect on RTG appeared virtually identical for both drugs, and the greater reduction in 24‐h mean RTG observed with canagliflozin 300 mg (and the associated greater increase in UGE) compared with dapagliflozin 10 mg was explained by plasma drug PK differences. The in vivo EC50 value for RTG‐lowering was estimated to be ∼1/3 of the reported in vitro IC50 values for SGLT2 inhibition, similar to observations made in a previous study with canagliflozin in patients with T2DM 12; however, it should be noted that there are some limitations associated with estimating EC50 from the present study because the doses used provided plasma drug concentrations that were always well above the EC50 value, and many of the data points were in the plateau region of the exposure‐response relationship.
The results of the present study showed that, after 4 days of treatment, canagliflozin 300 mg was associated with a greater reduction in RTG and a greater increase in UGE compared with dapagliflozin 10 mg. The between‐treatment difference in 24‐h mean RTG of ∼0.4 mmol/l (7 mg/dl) translated into roughly 25% greater UGE with canagliflozin 300 mg compared with dapagliflozin 10 mg. Both treatments had similar effects on RTG and UGE during the first 4 h after administration, when plasma exposure to both drugs was highest; however, over the remaining 20 h of the day, canagliflozin 300 mg suppressed RTG and increased UGE more than dapagliflozin 10 mg. The more sustained suppression of RTG observed with canagliflozin versus dapagliflozin was consistent with differences in the PK profiles of these drugs (i.e. the decline in plasma concentration from the peak value was more rapid with dapagliflozin than with canagliflozin; Figure 2).
Canagliflozin 300 mg also lowered PPG excursions to a greater extent than dapagliflozin 10 mg. The between‐treatment difference in percent reduction from baseline in PPGΔAUC0–2 h was ∼10%, and the rate of rise in PPG concentration was slower with canagliflozin compared with dapagliflozin (Figure 3C). Since both treatments provided similar UGE over the 0–2‐h and 0–4‐h intervals, the delay and greater reductions in PPG observed with canagliflozin 300 mg were probably attributable to local, transient inhibition of intestinal SGLT1, which slows the rate of intestinal glucose absorption. This hypothesis is consistent with results of a previously conducted dual‐tracer study, in which canagliflozin 300 mg transiently delayed intestinal glucose absorption in healthy participants 9; this effect is believed to be to the result of high intraluminal gut concentrations of canagliflozin during periods of drug absorption. The absence of an effect of dapagliflozin 10 mg on PPG excursions in the present study is consistent with the expected lack of intestinal SGLT1 inhibition with dapagliflozin 10 mg as dapagliflozin is considerably more selective for SGLT2 than SGLT1 (1400‐fold selectivity) compared with canagliflozin (160‐fold selectivity). In addition, the concentrations of dapagliflozin in the intestinal lumen during drug absorption are likely to be lower than the corresponding canagliflozin concentrations because of the lower dose of dapagliflozin administered compared with canagliflozin (10 vs. 300 mg).
The greater reductions in RTG and greater increases in UGE observed in the present study with canagliflozin 300 mg compared with dapagliflozin 10 mg are quantitatively similar to differences that have been observed between canagliflozin doses >200 mg and canagliflozin 100 mg in previous studies in healthy participants 4. In addition, the reductions in PPG observed with canagliflozin 300 mg have not been observed with canagliflozin doses ≤200 mg previously 4, and were not observed with dapagliflozin 10 mg in the present study. Together, these data suggest that the PD effects of canagliflozin 100 mg on RTG, UGE and PPG are quantitatively similar to the effects of dapagliflozin 10 mg. Although no direct comparisons between canagliflozin 100 mg and dapagliflozin 10 mg were made in this study in healthy participants, and no direct comparisons of clinical efficacy between canagliflozin and dapagliflozin in patients with T2DM have been reported, the available data suggest that the PD differences observed between canagliflozin 300 mg and dapagliflozin 10 mg might translate into differences in HbA1c lowering in patients with T2DM that are similar to the differences observed between canagliflozin 300 mg and canagliflozin 100 mg. In phase III studies, canagliflozin 300 mg lowered HbA1c by ∼0.1–0.3% more than canagliflozin 100 mg 12, 18, 19, 20, 21, 22, 23, 24, 25, 26, 27.
To minimize between‐subject variability in parameters such as glomerular filtration rate and baseline FPG and PPG concentrations, which are known to affect the PD properties of SGLT2 inhibitors, it was decided to perform the present study in healthy normal participants, rather than in patients with T2DM. While using this healthy population could be viewed as a study limitation, it enabled more precise estimates of between‐treatment differences in PD effects. The PK characteristics of both canagliflozin and dapagliflozin are similar in healthy participants and in patients with T2DM 7, 12, 14, therefore, similar PK profiles would be expected in the subjects with T2DM. Furthermore, the dose‐response relationship for the effect of each drug in increasing UGE is similar in healthy subjects and subjects with T2DM 4, 7, 28, with the only notable differences between study populations being higher and more variable UGE in patients with T2DM compared with healthy participants (because of the higher and more variable filtered glucose load). In addition, the magnitude of the PPG reductions observed in the present study in healthy participants treated with canagliflozin 300 mg (∼10% reduction from baseline) compared with dapagliflozin 10 mg were similar to the incremental reductions in PPG with canagliflozin 300 mg that were attributable to a non‐renal mechanism in a previous study in patients with T2DM (∼12% reduction in PPG excursion with canagliflozin 300 mg dosed before a meal compared with other dosing regimens providing similar UGE 17). Although the observed reduction in incremental PPG was somewhat modest with canagliflozin 300 mg, this additional non‐renal component of its mechanism of action is expected to contribute to the overall improvements in glycaemic control observed with canagliflozin 300 mg. In summary, while the use of healthy participants rather than patients with T2DM may be considered a limitation of the study, the similarity of the PK and PD properties of each drug in these two study populations suggests that this is not a major limitation.
Treatment with canagliflozin and dapagliflozin at their highest approved therapeutic doses (300 and 10 mg, respectively) for 4 days was generally well tolerated in healthy participants. The incidence of AEs observed in the present study was generally similar with canagliflozin and dapagliflozin. There was no hypoglycaemia observed in this study, which is consistent with the maximum RTG lowering (RTG,min) of ∼3.3 mmol/l with canagliflozin or dapagliflozin treatment estimated using an Emax model shown in Figure 4. Consistent with a mild osmotic diuresis induced by increased UGE, pollakiuria was reported in two participants (3.7%) treated with canagliflozin and in one participant (1.9%) treated with dapagliflozin. Associated with a small volume contraction attributable to mild osmotic diuresis with canagliflozin 29 and dapagliflozin 30, postural dizziness was observed in one participant during each treatment period (1.9%). In addition, a decrease in estimated glomerular filtration rate was reported in one participant after treatment with canagliflozin. These AEs were transient and assessed by the investigators as mild in intensity and possibly or very probably related to the study drugs. Although the present study was conducted in healthy participants, treated for a short period, the observed AEs reflected the mechanism of action of SGLT2 inhibition and were consistent with those reported in clinical trials in patients with T2DM treated with canagliflozin or dapagliflozin 31, 32.
In conclusion, this direct comparison of the PD of canagliflozin 300 mg and dapagliflozin 10 mg in healthy participants showed that reductions in 24‐h mean RTG, increases in 24‐h UGE, and reductions in PPG excursions were significantly greater with canagliflozin compared with dapagliflozin.
Conflict of Interest
S. S., D. P., K. F., A. G., J. N., N. V., J. P and P. R. are full‐time employees of Janssen Research & Development, LLC. L. P.‐M. is an employee of the clinical research organization Profil, which has received research support from Janssen for conducting the trial.
S. S. led the design, conduct and data collection of the study, as well as the interpretation of study results and preparation of this report. D. P. provided input on study design, data analysis, interpretation of the study results, and preparation of this report. K. F. was involved with developing the study protocol, conducting the study, and collecting data. A. G. performed the final statistical analysis of PD data, provided input on the execution of the study, and was involved with interpreting data and writing study reports. J. N. provided statistical input for the two‐stage group sequential study design and initial sample size, and validated the results from the final statistical analysis of PD data. N. V. and P. R. were involved in study design and data analysis. J. P. provided statistical input on the two‐stage group sequential study design and interpretation of the data. L. P.‐M. was involved in designing and conducting the study (including data collection). All authors participated in writing the manuscript and approved the final version of the manuscript.
Acknowledgements
The present study was supported by Janssen Research & Development, LLC. The authors thank all investigators, study teams and participants for participating in this study. Editorial support was provided by Cherie Koch, PhD, of MedErgy, and was funded by Janssen Global Services, LLC. Bhavna Solanki and Jay Ariyawansa of Janssen Research & Development, LLC were independent statisticians assigned to the study; they performed sample size estimation and analysis of data.
Canagliflozin has been developed by Janssen Research & Development, LLC, in collaboration with Mitsubishi Tanabe Pharma Corporation.
This study was previously presented, in part, in abstract form at the 10th International Diabetes Federation–Western Pacific Region Congress, Suntec, Singapore, 21–24 November 2014.
References
- 1. Davis CS, Fleming JW, Warrington LE. Sodium glucose co‐transporter 2 inhibitors: a novel approach to the management of type 2 diabetes mellitus. J Am Assoc Nurse Pract 2014; 26: 356–363. [DOI] [PubMed] [Google Scholar]
- 2. Kim GW, Chung SH. Clinical implication of SGLT2 inhibitors in type 2 diabetes. Arch Pharm Res 2014; 37: 957–966. [DOI] [PubMed] [Google Scholar]
- 3. Polidori D, Sha S, Ghosh A, Plum‐Mörschel L, Heise T, Rothenberg P. Validation of a novel method for determining the renal threshold for glucose excretion in untreated and canagliflozin‐treated subjects with type 2 diabetes mellitus. J Clin Endocrinol Metab 2013; 98: E867–E871. [DOI] [PMC free article] [PubMed] [Google Scholar]
- 4. Sha S, Devineni D, Ghosh A et al. Canagliflozin, a novel inhibitor of sodium glucose co‐transporter 2, dose dependently reduces calculated renal threshold for glucose excretion and increases urinary glucose excretion in healthy subjects. Diabetes Obes Metab 2011; 13: 669–672. [DOI] [PubMed] [Google Scholar]
- 5. Devineni D, Morrow L, Hompesch M et al. Canagliflozin improves glycemic control over 28 days in subjects with type 2 diabetes not optimally controlled on insulin. Diabetes Obes Metab 2012; 14: 539–545. [DOI] [PubMed] [Google Scholar]
- 6. Defronzo RA, Hompesch M, Kasichayanula S et al. Characterization of renal glucose reabsorption in response to dapagliflozin in healthy subjects and subjects with type 2 diabetes. Diabetes Care 2013; 36: 3169–3176. [DOI] [PMC free article] [PubMed] [Google Scholar]
- 7. Kasichayanula S, Liu X, Lacreta F, Griffen SC, Boulton DW. Clinical pharmacokinetics and pharmacodynamics of dapagliflozin, a selective inhibitor of sodium‐glucose co‐transporter type 2. Clin Pharmacokinet 2014; 53: 17–27. [DOI] [PubMed] [Google Scholar]
- 8. Komoroski B, Vachharajani N, Boulton D et al. Dapagliflozin, a novel SGLT2 inhibitor, induces dose‐dependent glucosuria in healthy subjects. Clin Pharmacol Ther 2009; 85: 520–526. [DOI] [PubMed] [Google Scholar]
- 9. Polidori D, Sha S, Mudaliar S et al. Canagliflozin lowers postprandial glucose and insulin by delaying intestinal glucose absorption in addition to increasing urinary glucose excretion: results of a randomized, placebo‐controlled study. Diabetes Care 2013; 36: 2154–2161. [DOI] [PMC free article] [PubMed] [Google Scholar]
- 10. FORXIGA™ . Summary of Product Characteristics. Forxiga 5 mg and 10 mg Film‐coated Tablets. Middlesex: Bristol‐Myers Squibb/AstraZeneca EEIG, 2014. [Google Scholar]
- 11. Liang Y, Arakawa K, Ueta K et al. Effect of canagliflozin on renal threshold for glucose, glycemia, and body weight in normal and diabetic animal models. PLoS One 2012; 7: e30555. [DOI] [PMC free article] [PubMed] [Google Scholar]
- 12. Devineni D, Curtin CR, Polidori D et al. Pharmacokinetics and pharmacodynamics of canagliflozin, a sodium glucose co‐transporter 2 inhibitor, in subjects with type 2 diabetes mellitus. J Clin Pharmacol 2013; 53: 601–610. [DOI] [PubMed] [Google Scholar]
- 13. Meng W, Ellsworth BA, Nirschl AA et al. Discovery of dapagliflozin: a potent, selective renal sodium‐dependent glucose cotransporter 2 (SGLT2) inhibitor for the treatment of type 2 diabetes. J Med Chem 2008; 51: 1145–1149. [DOI] [PubMed] [Google Scholar]
- 14. Devineni D, Vaccaro N, Polidori D, Stieltjes H, Wajs E. Single‐ and multiple‐dose pharmacokinetics and pharmacodynamics of canagliflozin, a selective inhibitor of sodium glucose co‐transporter 2, in healthy participants. Int J Clin Pharmacol Ther 2014; DOI: 10.5414/CP202218. [DOI] [PubMed] [Google Scholar]
- 15. Nair S, Wilding JP. Sodium glucose cotransporter 2 inhibitors as a new treatment for diabetes mellitus. J Clin Endocrinol Metab 2010; 95: 34–42. [DOI] [PubMed] [Google Scholar]
- 16. Rave K, Nosek L, Posner J, Heise T, Roggen K, van Hoogdalem EJ. Renal glucose excretion as a function of blood glucose concentration in subjects with type 2 diabetes–results of a hyperglycaemic glucose clamp study. Nephrol Dial Transplant 2006; 21: 2166–2171. [DOI] [PubMed] [Google Scholar]
- 17. Stein P, Berg JK, Morrow L et al. Canagliflozin, a sodium glucose co‐transporter 2 inhibitor, reduces post‐meal glucose excursion in patients with type 2 diabetes by a non‐renal mechanism: results of a randomized trial. Metabolism 2014; 63: 1296–1303. [DOI] [PubMed] [Google Scholar]
- 18. Bode B, Stenlöf K, Sullivan D, Fung A, Usiskin K. Efficacy and safety of canagliflozin treatment in older subjects with type 2 diabetes mellitus: a randomized trial. Hosp Pract 2013; 41: 72–84. [DOI] [PubMed] [Google Scholar]
- 19. Cefalu WT, Leiter LA, Yoon K‐H et al. Efficacy and safety of canagliflozin versus glimepiride in patients with type 2 diabetes inadequately controlled with metformin (CANTATA‐SU): 52 week results from a randomised, double‐blind, phase 3 non‐inferiority trial. Lancet 2013; 382: 941–950. [DOI] [PubMed] [Google Scholar]
- 20. Forst T, Guthrie R, Goldenberg R et al. Efficacy and safety of canagliflozin over 52 weeks in patients with type 2 diabetes on background metformin and pioglitazone. Diabetes Obes Metab 2014; 16: 467–477. [DOI] [PMC free article] [PubMed] [Google Scholar]
- 21. Lavalle‐González FJ, Januszewicz A, Davidson J et al. Efficacy and safety of canagliflozin compared with placebo and sitagliptin in patients with type 2 diabetes on background metformin monotherapy: a randomised trial. Diabetologia 2013; 56: 2582–2592. [DOI] [PMC free article] [PubMed] [Google Scholar]
- 22. Stenlöf K, Cefalu WT, Kim K‐A et al. Efficacy and safety of canagliflozin monotherapy in subjects with type 2 diabetes mellitus inadequately controlled with diet and exercise. Diabetes Obes Metab 2013; 15: 372–382. [DOI] [PMC free article] [PubMed] [Google Scholar]
- 23. Stenlöf K, Cefalu WT, Kim KA et al. Long‐term efficacy and safety of canagliflozin monotherapy in patients with type 2 diabetes inadequately controlled with diet and exercise: findings from the 52‐week CANTATA‐M study. Curr Med Res Opin 2014; 30: 163–175. [DOI] [PubMed] [Google Scholar]
- 24. Wilding JP, Charpentier G, Hollander P et al. Efficacy and safety of canagliflozin in patients with type 2 diabetes mellitus inadequately controlled with metformin and sulphonylurea: a randomised trial. Int J Clin Pract 2013; 67: 1267–1282. [DOI] [PMC free article] [PubMed] [Google Scholar]
- 25. Yale JF, Bakris G, Cariou B et al. Efficacy and safety of canagliflozin in subjects with type 2 diabetes and chronic kidney disease. Diabetes Obes Metab 2013; 15: 463–473. [DOI] [PMC free article] [PubMed] [Google Scholar]
- 26. Yale JF, Bakris G, Cariou B et al. Efficacy and safety of canagliflozin over 52 weeks in patients with type 2 diabetes mellitus and chronic kidney disease. Diabetes Obes Metab 2014; 16: 1016–1027. [DOI] [PubMed] [Google Scholar]
- 27. Leiter LA, Yoon K‐H, Arias P et al. Canagliflozin provides durable glycemic improvements and body weight reduction over 104 weeks versus glimepiride in patients with type 2 diabetes on metformin: a randomized, double‐blind, Phase 3 study. Diabetes Care 2014; DOI: 10.2337/dc13-2762. [DOI] [PubMed] [Google Scholar]
- 28. Sha S, Devineni D, Ghosh A, Polidori D, Hompesch M, Arnolds S. Pharmacodynamic effects of canagliflozin, a sodium glucose co‐transporter 2 inhibitor, from a randomized study in patients with type 2 diabetes. PLoS One 2014; 9: e105638. [DOI] [PMC free article] [PubMed] [Google Scholar]
- 29. Sha S, Polidori D, Heise T et al. Effect of the sodium glucose co‐transporter 2 inhibitor, canagliflozin, on plasma volume in patients with type 2 diabetes mellitus. Diabetes Obes Metab 2014; 16: 1087–1095. [DOI] [PubMed] [Google Scholar]
- 30. Lambers Heerspink HJ, de Zeeuw D, Wie L, Leslie B, List J. Dapagliflozin a glucose‐regulating drug with diuretic properties in subjects with type 2 diabetes. Diabetes Obes Metab 2013; 15: 853–862. [DOI] [PMC free article] [PubMed] [Google Scholar]
- 31. INVOKANA® (Canagliflozin) Tablets, for Oral Use [Package Insert]. Titusville: Janssen Pharmaceuticals, 2014. [Google Scholar]
- 32. FARXIGA™ (Dapagliflozin) Tablets, for Oral Use [Package Insert]. Princeton: Bristol‐Myers Squibb Company, 2014. [Google Scholar]