

Abstract
MicroRNA‐9 (miR‐9) presents to exert distinct and even opposite functions in different kinds of tumors through targeting different cellular genes. However, its role in cervical adenocarcinoma remains uncertain. Here, we report that miR‐9 is down‐regulated in cervical adenocarcinoma due to its frequent promoter‐hypermethylation and exerts its tumor suppressor role through inhibiting several novel target genes, including interleukin‐6 (IL‐6). The promoters of miR‐9 precursors (mir‐9‐1, ‐2, and ‐3) were hypermethylated in cervical adenocarcinoma tissues. Demethylation treatment of HeLa dramatically increased the expression of mature miR‐9. Both in vitro and in vivo functional experiments confirmed that miR‐9 can inhibit the proliferation, migration, and malignant transformation abilities of HeLa cells. Bioinformatics methods and array‐based RNA expression profiles were used to screen the downstream target genes of miR‐9. Dual‐luciferase reporting assay, real‐time qPCR, and ELISA or Western blot confirmed four genes (CKAP2, HSPC159, IL‐6, and TC10) to be novel direct target genes of miR‐9. Pathway annotation analysis of the differently expressed genes (DEGs) induced by ectopic miR‐9 expression revealed the enrichment in Jak/STAT3 pathway, which is one of the downstream pathways of IL‐6. Ectopic expression of miR‐9 in HeLa inhibited Jak/STAT3 signaling activity. Moreover, such effect could be partially reversed by the addition of exogenous IL‐6. In conclusion, our results here present a tumor suppressor potential of miR‐9 in cervical adenocarcinoma for the first time and suggest that miR‐9 could repress tumorigenesis through inhibiting the activity of IL‐6/Jak/STAT3 pathway. © 2015 The Authors. Molecular Carcinogenesis, published by Wiley Periodicals, Inc.
Keywords: microRNA‐9‐1, hypermethylation, cervical adenocarcinoma, HeLa, interleukin‐6, Jak/STAT3 signaling pathway
INTRODUCTION
Cervical cancer is one of the most common malignancies and a leading cause of cancer death in women worldwide 1. Histologically, cervical cancer can be divided into different subtypes, including cervical squamous cell carcinomas (CSCCs; about 80% of cases) and cervical adenocarcinomas (CAs; about 5–20% of cases) 2. Although infection of the high‐risk types of human papillomavirus (HPVs) has been considered as the predominant cause of cervical cancers, the accumulation of genetic and epigenetic alterations of host cellular genes also play a crucial role in the cervical malignant transformations 3.
MicroRNAs (miRNAs) are short (20–24 nt) non‐coding RNAs which play a major role in post‐transcriptional regulation of target gene expression 4. Aberrant status of miRNAs may significantly contribute to cancer development 4, 5, 6, including cervical cancer 7, 8, 9. MiR‐9 is a highly conserved miRNA found in insects and primates 10. In the human genome, there are three independent miR‐9 precursors, mir‐9‐1, mir‐9‐2, and mir‐9‐3 encode the same mature miR‐9. Dysregulation of miR‐9 expression has profound effects on cancer development. However, miR‐9 seems to exert opposite functions in different tissues or under different cancer contexts by targeting different genes. MiR‐9 is overexpressed in brain tumors 11, 12, and induced cell metastasis in breast cancer and colorectal cancer via promoting cell motility by targeting E‐cadherin 13, 14, which indicated an oncogenic potential of miR‐9. Contrarily, miR‐9 is capable to inhibit cell growth and metastasis in gastric cancer, ovarian cancer, and malignant melanoma by targeting NF‐kappaB1 15, 16, 17, which revealed its tumor suppressor role. Even in the same type of cancer, such as breast cancer, miR‐9 could exert anti‐proliferation function by targeting MTHFD2 and pro‐metastasizing function by targeting E‐cadherin 13, 18. Therefore, the function of miR‐9 is largely depending on its downstream target genes. In addition, promoter hypermethylation is the main cause of the dysfunction of miR‐9 in various cancers 19, 20, 21. So far, several recent studies carried out in CSCC reported an oncogenic role of miR‐9 22, 23. However, little is known about the status and function of miR‐9 in the process of CAs.
In this study, in order to clarify the exact status and function of miR‐9, and to identify the multiple functional target genes of miR‐9 account for the progression of CAs, we explored the promoter methylation status of miR‐9 in both CAs cell line (HeLa) and primary tumor tissues. The cancer related functions of miR‐9 and several novel target genes were identified by using HeLa cell. Our results indicated that in CAs, miR‐9 functions as a tumor suppressor partially through inhibiting the activity of IL‐6/Jak/STAT3 pathway.
MATERIALS AND METHODS
Patients' Specimens and Cell Lines
Twelve cases of primary CAs tissue specimens and 20 cases of primary CSCC tissue specimens were obtained from patients undergoing surgical resection. The samples were histologically confirmed and paraffin embedded until use. Another eight cases of primary CAs tissue specimens and 15 cases of cervical normal control were histologically confirmed and stored in liquid nitrogen. All the specimens were obtained between 2011 and 2014 in Peking University People's Hospital. All the patients enrolled were Han Chinese with HPV infection. This study was approved by the Ethics Committee of Peking University Health Science Center. An informed consent was obtained from each subject.
HeLa cell was purchased from ATCC (American type culture collection) and maintained in DMEM supplemented with 10% fetal bovine serum (GIBCO, Carlsbad, CA). This cell line has been tested and authenticated by DNA (STR) profiling (see supplementary Table 1 for detailed information).
Methylation‐Specific DNA Enzymes Digestion and Methylated DNA Quantification
The quantificational methylated DNA analysis was performed as previously described 24. The primers used for real‐time qPCR were listed in supplementary Table 2. Methylation intensity (MI) was defined as the percentage of methylated target DNA sequences among all target DNA sequences. MI ≥ 10% was considered to be the criteria of hypermethylation.
Real‐Time Quantitative PCR and Taqman MicroRNA Assay
Real‐time quantitative PCR was performed as previously described 25. The primers used for real‐time PCR were shown in Supplementary Table 3. Each experiment was done in triplicate and CTBP was used as control. The expression of mature miRNAs was detected using the Taqman MicroRNA Assays specific for hsa‐miR‐9, U6 shRNA were used as control following the manufacturer's protocol (Applied Biosystems, Foster City, CA).
5‐aza‐2′‐Deoxycytidine Treatment in Cell Lines
HeLa cells were seeded into the six‐well plate at a concentration of 2∼2.5 × 10⁵cells per well. After 24 h, cells were treated with DMSO (control group) or 2 µmol/L 5‐Aza‐2′‐deoxycytidine (experimental group) every 24 h and last for 3 d.
Construction of Plasmid Recombinants
To construct the miR‐9 expression vector, human mir‐9‐1 gene and its 5′‐ and 3′‐ flanking region (120 bp and 150 bp, respectively) was amplified and cloned into pRNA‐U6.1/Neo‐siFluc to create the U6 driven mir‐9‐1, namely U6‐mir‐9‐1. To construct pGL3‐Luc‐3′UTR‐WT plasmid, wide‐type 3′UTR segments of predicted target genes containing the putative miR‐9 binding site was amplified and cloned into downstream of the luciferase reporter gene in pGL3 vector. To construct pGL3‐Pim‐1‐Luc plasmid, Pim‐1 promoter was amplified and cloned into upstream of the luciferase reporter gene in pGL3 vector. Primers used were listed in supplementary Table 4. pGL3‐APRE‐Luc plasmid was constructed as described before 26.
Generation of Stable Cell Line Overexpressing miR‐9
Stable cell line was generated by transfection with U6‐mir‐9‐1 plasmids into HeLa cell using lipofectamine 2000 reagent (Invitrogen, Carlsbad, CA) according to the manufacturer's protocol, and U6‐siFluc was used as a mock control. G418 (600ug/mL, Calbiochem, Darmstadt, Hesse‐Darmstadt, Germany) was added to select the transfected clones 48 h after transfection. Taqman PCR was performed to confirm the overexpression of miR‐9.
Cell Proliferation Assay
Cell proliferation was monitored using MTT method as described before 25. IL‐6 (PeproTech, NJ) was added to the culture supernatant every 24 h at a final concentration of 25 ng/mL.
Wound Healing Assay
Stably transfected HeLa cells were cultured in six‐well plates until confluent. The cell layers were carefully wounded using a sterile 10 µL tip, washed twice with fresh medium, and cultured for 24–48 h. Images of the wound monolayers were acquired on a phase contrast microscope linked to a charge coupled device camera, and the wound area was measured using CT‐AS software (Nikon, Tokyo, Japan).
Anchorage‐ Independent Colony‐Formation Assay in Soft Agar
Colony‐formation assay was performed using a soft agar kit (GENMED SCIENTIFICS, INC., Shanghai, China) following the company's instructions.
Tumorigenicity Assays in Nude Mice
For each 5‐wk‐old nude mouse, 1 × 10⁷ HeLamiR‐9 and HeLacontrol cells were suspended in 150 ul PBS and then injected subcutaneously into the two different sides of its posterior flanks. Tumor formation in nude mice was monitored over a 3‐wk period. The tumor volume was calculated by the formula V = 0.5 × L × W2 (in millimeters). Where, L is the length of the tumor; W is the width of the tumor.
Array‐Based RNA Expression Profiles
The RNA expression profiles of HeLa cells stably expressing miR‐9 and the control cells was performed using Human U133 Plus2.0 (Affymetrix, Santa Clara, CA). Subsequent data analysis was carried out using Gene Spring Software 11.0 (Agilent technologies, Santa Clara, CA). Genes with more than twofold change were considered to be differently expressed.
Online Prediction of Target Genes
Four bioinformatic softwares were used to predict potential target genes of miR‐9. They are TargetScan (http://www.targetscan.org/vert_60/), PicTar (http://pictar.mdc‐berlin.de/), miRanda (http://www.microrna.org/), and miBridge.
Luciferase Reporter Assay
Cells were planted in a 12‐well plate, and the cells were co‐transfected with 1 500 ng of either U6‐mir‐9‐1 or U6 empty plasmid, and 50 ng of either pGL3‐3′‐UTR‐WT or pGL3‐3′‐UTR‐control plasmid 24 h after seeding, 25 ng of pRL‐TK was also transfected simultaneously as an endogenous control. Luciferase activity in each well was quantified 24 h after transfection using dual luciferase reporter kit (Promega, Madison, WI), following the manufacturer's protocol.
Western Blotting
Western blot was conducted as described before 25. The primary antibodies anti‐STAT3, anti‐p‐STAT3 (1/1000, CST, Boston, MA), and anti‐CKAP2, anti‐HSPC159, anti‐TC10 (1/200, Santa Cruz, Santa Cruz, CA), as well as anti‐α‐tubulin (1/2000, MBL, Aichi, Japan) and the secondary antibodies conjugated with Cy5.5 (1/8000, Amersham Pharmacia Biotech, Buckinghamshire, UK) were used. Band signals were visualized by Odyssey Imager (LI‐COR Biosciences, Lincoln, NE).
ELISA Assay
For the quantitative detection of human interleukin 6 (IL‐6) concentrations in cell culture supernates, Human IL‐6 Quantikine ELISA Kit (R&D Systems, Minneapolis, MN) was used according to the manufacturer's introductions. Cells were seeded in six‐well plate and cultured for 48 h, 200 ul culture supernates were used for detection.
Statistical Analysis
For statistical analyses, the differences between groups were analyzed by 2‐tailed Student t‐test using SAS 9.0. In all cases, a P‐value of less than 0.05 was considered significant.
RESULTS
The Hypermethylation of miR‐9 Precursor Genes Suppresses the Expression of miR‐9 in HeLa Cell and CA Tissues
The aberrant expression of miR‐9 in tumors was usually caused by the hypermethylation of the miR‐9 precursor genes 19, 20, 21. Therefore, we first examined the methylation status of the promoters of all three miR‐9 genes (mir‐9‐1, 2, and 3) in HeLa cells. Mir‐9‐2 and mir‐9‐3 were free from hypermethylation (methylation intensity, MI<10%; data not shown), while mir‐9‐1 was highly methylated (MI = 86.7%). Then the promoter methylation status of the three miR‐9 precursor genes were examined in 20 CA tumor tissues and 15 normal control tissues. As expected, the frequencies of promoter‐hypermethylation of mir‐9‐1, ‐2, and ‐3 in tumor tissues were 35%, 44.4%, and 20%, respectively. As a result, 65% (13/20) of the tumor tissues were hypermethylated for at least one miR‐9 precursor genes. In contrast, a sorely mir‐9‐2 hypermethylation were found only in 1 of 15 (6.67%) normal tissues (Supplementary Table 5). Additionally, the MI of mir‐9‐1,‐2, and ‐3 in tumor tissues was also significantly higher than that in normal control tissues (P = 0.003, 0.022, and 0.006, respectively; Figure 1a–c). Concordantly, Taqman analysis of eight CA tissues and 15 normal control tissues showed significantly lower expression of miR‐9 in tumor tissues than those in normal tissues (P = 0.0102; Figure 1d). Furthermore, the expression of miR‐9 in HeLa could be restored upon 5′‐Aza‐dC treatment (Figure 1e), confirming the expression silencing of miR‐9 in this cell line was mediated by its promoter‐hypermethylation. The above results indicated that miR‐9 was hypermethylated and down‐regulated in both HeLa cell and primary tumor tissues.
Figure 1.
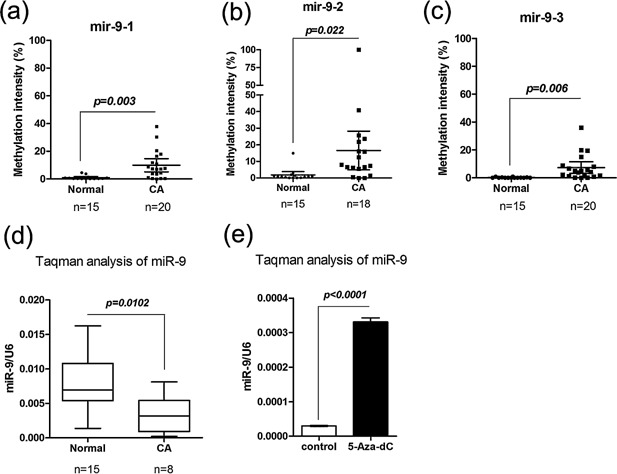
miR‐9 is silenced by the hypermethylation of miR‐9 precursor genes in CAs cell line and tissues. (a–c) Methylation intensities of miR‐9 precursor genes in CA tissues and normal control tissues. (d) Relative expression of mature miR‐9 in CA tissues and normal control tissues. (e) Relative expression levels of mature miR‐9 in HeLa cell treated with 5‐aza‐dC compared to untreated controls (mean ± s.d.; n = 3).
Restoring miR‐9 expression inhibited HeLa cells proliferation, migration and colony formation in vitro, and reduced the tumorigenic potential in vivo
To explore the function of miR‐9 in CAs, HeLa was transfected with U6‐mir‐9‐1 precursor to construct the miR‐9 stably expressed cell line and its empty vector‐transfected counterparts (named HeLamiR‐9 and HeLacontrol).
MTT assay revealed that the growth ability of HeLamiR‐9 was significantly reduced compared to HeLacontrol (Figure 2a). Wound‐healing assay showed that, compared to control cells, HeLamiR‐9 cells spread along the scratched edge much slower (Figure 2b). Next, soft agar colony assay revealed that the counts of colonies formed by HeLamiR‐9 were much less than those of HeLacontrol cells (Figure 2c(i) and c(ii)). Moreover, the results of xerograft tumor formation assay in nude mice using HeLamiR‐9 and HeLacontrol showed significant differences in the average tumors sizes and tumor weights at the end of observation (day 21 after injection; tumor size: 2480 ± 907 mm3 vs. 1219 ± 888 mm3; P = 0.0019; tumor weight: 0.58 ± 0.17 g vs. 0.35 ± 0.22 g; P = 0.022; Figure 2d(i)–(iii)). The results described above suggested that ectopic miR‐9 expression could inhibit HeLa cell proliferation, migration and reduce its malignant transformation capacity in vitro, as well as suppress its tumorigenic potential in vivo. All these pointed out a tumor suppressor role of miR‐9 in CAs.
Figure 2.
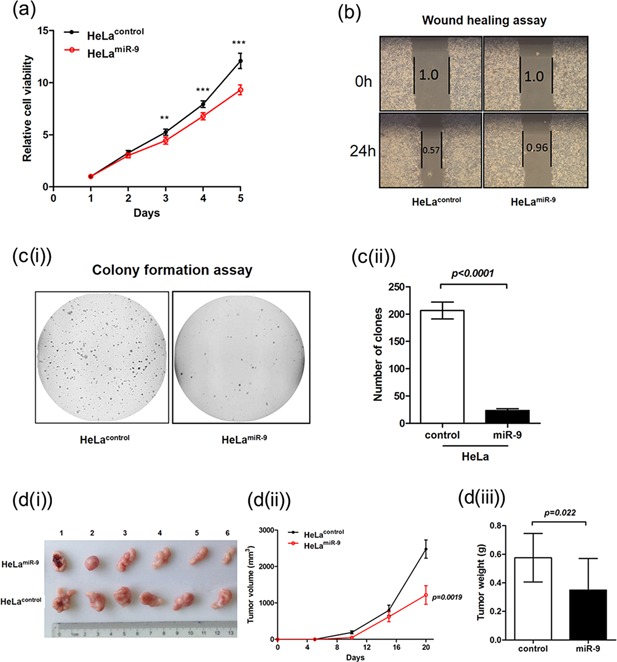
Ectopic expression of miR‐9 can suppress HeLa cells' tumorigenic properties. (a) MTT assay of HeLamiR‐9 and HeLacontrol. ** P < 0.001, *** P < 0.0001 (Student's t‐test at each time point). (b) Wound‐healing assay of HeLamiR‐9 and HeLacontrol. The scratch area at 0 h was arbitrarily assigned as 1.0. (c(i) and c(ii)) Soft agar assay for colony formation of HeLamiR‐9 and HeLacontrol. The statistical results are present in c(ii) (mean ± s.d.; n = 3). (d(i)–(iii)) The tumor xenograft experiment in nude mice. d(i) the images of tumors formatted in the assay. d(ii) presents the volumes of tumors in the two groups. d(iii) presents the weight of the tumors in the two groups (mean ± s.d.; n = 6).
Ectopic Expression of miR‐9 Dramatically Changed the Expression Profiles of Cancer Related Genes in HeLa Cell
To determine the underlying mechanisms regarding to the tumor suppressing activity of miR‐9 in CAs, the change of gene expressing profile between HeLamiR‐9 and HeLacontrol were analyzed via mRNA microarray. A total of 1068 differently expressed genes (DEGs; Fold change ≥2) were identified, including 364 up‐regulated genes and 704 down regulated genes (Supplementary Table 6). GO functional annotation analysis of these 1068 DEGs showed they were dramatically enriched in terms directly or indirectly related to carcinogenesis, including cell motion, cell differentiation, negative regulation of cell adhesion, regulation of angiogenesis, and so on (Figure 3a). Consistently, KEGG pathway analysis revealed DEGs were mostly enriched in cancer related pathways including non‐small cell lung cancer, focal adhesion, ErbB signaling pathway as well as Jak/STAT signaling pathway (Figure 3b). Since the proinflammatory Jak/STAT signaling pathway was frequently activated in HPV related cervical cancer, this result implicated the crucial role of miR‐9 in CAs.
Figure 3.
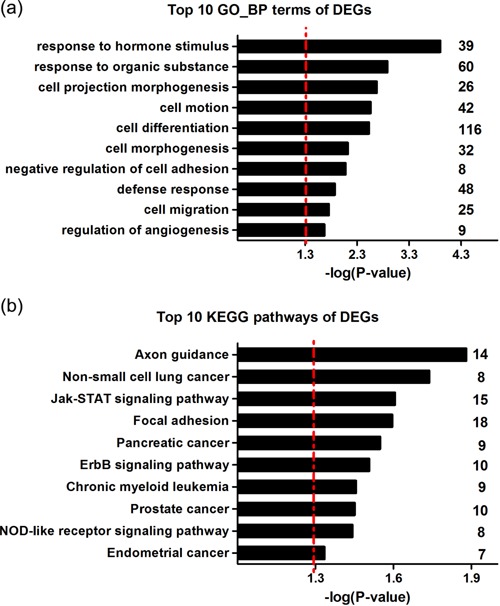
Functional annotation analysis of the differently expressed genes (DEGs) induced by ectopic expression of miR‐9 in HeLa cells. (a) GO functional annotation analysis of 1068 DEGs. (b) KEGG pathway analysis of 1068 DEGs. The red dash line indicates a significant level of P = 0.05. The vertical numbers on the right means the counts of DEGs annotated in the certain GO terms or KEGG pathways.
Screening and Verification of the Target Genes of miR‐9 in HeLa Cell
To identify the functional target gene(s) of miR‐9 in CAs, NF‐kappB1 and E‐cadherin, two ever reported target genes were firstly examined 13, 15, 16, 17. Unexpectedly, these two genes were not affected by ectopic miR‐9 expression (date not shown). To identify the new crucial target genes of miR‐9 relevant to CAs, 2414 in silico predicted target genes were compared against 704 significantly down‐regulated genes found in the mRNA expression profiles of HeLamiR‐9 (HeLacontrol was used as control); the function of the candidate genes was also taken into consideration during the selection. Eventually, overall 21 potential target genes were selected from the 110 overlapped genes (Supplementary Table 7) for further confirmation.
Firstly, pGL3‐Luc‐3′UTR‐wt plasmids of the 21 candidate genes and pGL3‐Luc‐control plasmid containing a 200 bp fragment without miR‐9 potential binding sequence were constructed using dual‐luciferase assays. As shown in Figure 4a, when co‐transfected with the U6‐mir‐9‐1 precursor, 12 of the 21 genes' 3′‐UTR constructs (ANXA2, IL‐6, CKAP2, AP3B1, HSPC159, TC10, FAM13C, SRGAP3, EPHA7, AEBP2, PIK3R3, and SNX25) presented reduced firefly luciferase activities (with inhibition ratio >20%). Real‐time qPCR results showed that the mRNA expression levels of eight out of the 12 genes (including IL‐6, CKAP2, TC10, FAM13C, SRGAP3, EPHA7, PIK3R3, and SNX25) were dramatically reduced after the ectopic expression of miR‐9 (Figure 4b). The suppressive effects of miR‐9 on three of these eight genes were further confirmed by either ELISA (IL‐6) or Western blot (CKAP2 and TC10) (Figure 4c(i) and c(ii)). For HSPC159, although ectopic miR‐9 overexpression caused no change at its mRNA level, the decrease at the protein level ascertained it as a target gene of miR‐9 in HeLa cell (Figure 4c(ii)).
Figure 4.
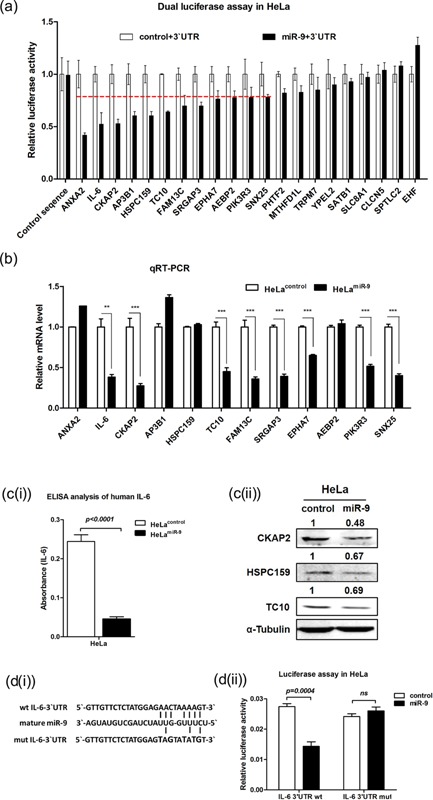
miR‐9 target genes verification in HeLa cells. (a) The results of luciferase activity detection. “miR‐9 + 3′UTR” and “control+3′UTR” means HeLa cells co‐transfected with pGL3‐Luc‐3′‐UTR‐WT and U6‐mir‐9‐1 or U6‐control vector (see “materials and methods” for details). The data represent the mean ± s.d. of three independent experiments done in nine repeats. (b) Relative mRNA expression level of potential target genes, CTBP was used as internal control gene (mean ± s.d.; n = 3). (C(i)) ELISA analysis of IL‐6 in the cultural supernatants of HeLamiR‐9 and HeLacontrol (mean ± s.d. n = 3) (c(ii)) Western blot analysis of three target genes. (d(i)) shows the miR‐9 seed sequences of IL‐6 and the mutational strategy. (d(ii)) shows the relative luciferase activity of report vectors containing wild type IL‐6 3′UTR (IL‐6 3′UTR wt) and the mutant one (IL‐6 3′UTR mut). The data represent the mean ± s.d. of three independent experiments done in nine repeats.
To further confirm IL‐6 as a target gene, we mutated its potential binding sequence in 3′UTR (Figure 4d(i)). The results showed that miR‐9 could significantly suppress the luciferase activity of the report construct containing a wild‐type IL‐6 3′‐UTR, but not of the mutant one in HeLa cells (Fig 4d(ii)).
The Ectopic Expression of miR‐9 Suppresses the Activity of IL‐6/Jak/STAT3 Pathway By Targeting IL‐6
KEGG pathway annotation analysis of the DEGs revealed they were significantly enriched in Jak/STAT signaling pathway (Figure 3b). Therefore, one of our main concerns is whether miR‐9 could block the activation of Jak/STAT pathway by targeting IL‐6. To test for the conflict effect of IL‐6 and miR‐9, we add recombinant human IL‐6 (rhIL‐6) to the cultural supernatants of HeLamiR‐9 and HeLacontrol cells. The results of MTT assays showed that rhIL‐6 could partially reverse the anti‐proliferative function of miR‐9 in HeLamiR‐9 (Figure 5a). Luciferase assay showed that overexpression of miR‐9 could suppress the luciferase activity of APRE (a luciferase vector containing the promoter of the target gene of STAT3) 27 and Pim‐1 (a luciferase vector containing Pim‐1 promoter which was regulated by STAT3) 28 (Figure 5b and c). Western blot showed that the phosphorylation of STAT3 (p‐STAT3, the active form of STAT3) was reduced by the overexpression of miR‐9 in HeLa cells (Figure 5d). Moreover, the mRNA expression levels of four downstream target genes of Jak/STAT3 signaling pathway, Pim‐1, VEGFA, SOCS1, and SOCS3, were decreased in HeLamiR‐9 cells compared to HeLacontrol (Figure 5e). These results indicated that ectopic expression of miR‐9 could restrain the activation of Jak/STAT3 pathway via directly suppressing IL‐6 expression in HeLa cells.
Figure 5.
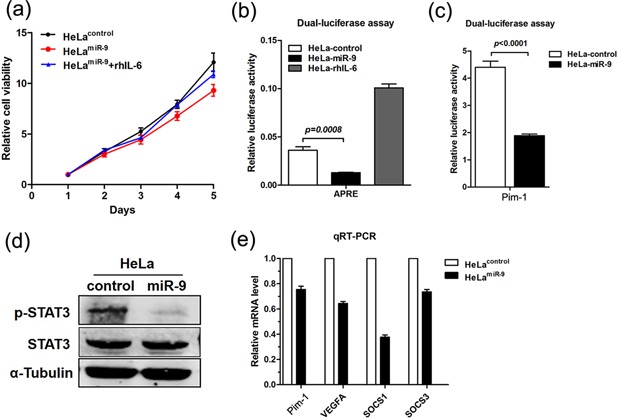
Ectopic expression of miR‐9 suppresses the activity of IL‐6/Jak/STAT3 pathway by targeting IL‐6. (a) The results of MTT assays. (b) The luciferase activities of APRE. (c) The luciferase activities of Pim‐1. (d) Western blot analysis of p‐STAT3 and STAT3. (e) The relative mRNA expression levels of four genes downstream of Jak/STAT3. Relative mRNA levels of each gene in control cells were assigned as 1.0 (mean ± s.d.; n = 3).
DISCUSSION
Although the role of miR‐9 in carcinogenesis has been discussed in several kinds of human malignancies, the biological function of miR‐9 in cancer is still not well understood and the role of miR‐9 in cervical adenocarcinomas (CAs) has never been explored. In this study, we explored the aberrant status, cancer related functions, and potential antineoplastic mechanisms of miR‐9 in HeLa cell. Our results suggest that miR‐9 acts as a tumor suppressive microRNA by targeting multiple functional target genes in CAs, at least included IL‐6, CKAP2, HSPC159, and TC10.
The function of miR‐9 varies with different tumor contexts and different cancer development stages. In certain human malignancies like breast cancer, colon cancer, gastric cancer, miR‐9 was found to be silent by hypermethylation and was as a tumor suppressor by targeting some oncogenes, such as NF‐kappaB1, CDX2, and MTHFD2 15, 19, 20, 21, 29, 30. On the other hand, miR‐9 presents overexpression in metastasizing tumor tissue of breast cancer and liver cancer compared to primary cancer tissues 13, 31. Previous study has shown that due to the amplification of chromosomal band 1q, miR‐9 was high expressed in CSCC. The overexpression of miR‐9 in CSCC cell lines could promote the proliferation, migration, and malignant transformation, and suppress the differentiation of cancer cells 23. However, in HeLa cell, which was derived from CAs, the hypermethylation of miR‐9‐1 promoter was detected in the present study. Furthermore, the expression of miR‐9 was suppressed due to the aberrant hypermethylation of the three miR‐9 precursor genes in CA tissues, suggesting the function of miR‐9 in CAs is different from that in CSCC. Gene expression can be regulated by genetic or epigenetic mechanisms, our results indicated the epigenetic suppression of miR‐9 expression in CAs. However, gene copy number variation 32, 33, 34 (deletion) and histone acetylation status may also contributed to miR‐9 down‐regulation. Therefore, further studies are needed to fully understand the mechanisms of miR‐9 down‐regulation in CAs. It's worth to note that we also detected the elevated methylation of mir‐9‐2 in CSCC tissues compared with normal control (supplementary Figure 1b), but the mature miR‐9 level showed no significant difference (supplementary Figure 1d). Therefore, the status of miR‐9 in CSCC needs to be further explored.
Subsequent functional experiments showed that overexpression of miR‐9 in HeLa cells could dramatically impair the abilities of growth, migration, and malignant transformation of cancer cells. Furthermore, in vivo experiment in nude mice suggested that miR‐9 could repress the tumorigenic abilities of HeLa cells. It is commonly acknowledged that, to a great extent, the functional diversity of miR‐9 is largely depended on its expression level and its downstream target genes, Therefore, we speculated that unlike the oncogenic role in CSCC, miR‐9 may exerts its tumor suppressor function by targeting a different set of cellular genes in CAs, which account for the tumor suppressor function of miR‐9.
In the present study, four new target genes including CKAP2, IL‐6, TC10, and HSPC159 were ultimately determined. In addition, although lack of confirmation in protein level due to lack of available antibodies, the mRNA level of five other candidate genes, FAM13C, SRGAP3, EPHA7, PIK3R3, and SNX25, could also be suppressed by miR‐9 in HeLa cell in vitro. We should note that only 21 of the 110 predicted target candidate genes had been experimentally examined in the current study. It was possible that more direct target gene could be identified among the rest of candidate genes, indicating that miR‐9 may involve in the development process of CAs through regulating multiple target genes.
As early as in the 1990s, numerous studies had reported the up‐regulation of IL‐6 in cervical cancer 35, 36. IL‐6 levels could be a possible candidature prognostic indicator of cervical cancer 37. A recent study carried out in eastern Chinese women found that the polymorphisms of the IL‐6 gene contribute to cervical cancer susceptibility 38. Wei LH, et al. reported that IL‐6 could induce VEGF expression via Jak/STAT3 signaling pathway, and, thus, promote angiogenesis and cervical tumorigenesis 39. Although the oncogenic function of IL‐6 has already been well established in cervical cancer, the driving force of the aberrant high level of IL‐6 has not been fully studied. Our results here presented a conclusive regulative function of miR‐9 on IL‐6 in HeLa, demonstrating that IL‐6 is a novel direct target gene of miR‐9 in CAs. The JAK/STAT pathway is an evolutionarily conserved signaling pathway involved in basic cellular functions like cell growth, differentiation, and death. IL‐6 stimulation leads to the autophosphorylation and activation of JAK, the STAT3 protein was then phosphorylated by JAK, formed homodimer and translocated into the cell nucleus to promote transcription of responsive genes like Pim‐1 and VEGF. In this study, the down‐regulated genes induce by miR‐9 in HeLa cells were significantly enrichment in Jak/STAT signaling pathway, indicating an important role of miR‐9 on the inactivation of IL‐6/Jak/STAT3 in the process of CAs development. Consistently, we proved that overexpression of miR‐9 could suppressed the activity of STAT3. Since Pim‐1 and VEGF are crucial target genes of Jak/STAT3 pathway, up‐regulation of these two genes was observed in various cancers and they were reported to play the oncogenic role by promoting cell proliferation, survival, and malignant transformation 40, 41, 42, 43. The suppression of Pim‐1 and VEGF after miR‐9 overexpression in HeLa cells further indicated the inactivation of Jak/STAT3 pathway and the tumor suppressor role of miR‐9 in CAs.
The cancer‐related function of TC10 has been well established in variety types of cancers. TC10 could prompt reorganization of the actin cytoskeleton and regulate cell shape, attachment, and motility 44. Especially, when ectopically expressing miR‐9 in melanoma cells, the expression of TC10 and several other proteins that regulate actin dynamics, including Rab8, Rab11a, and RelA, are significantly decreased, thus, reduced the motility of melanoma cells 17. Therefore, one explanation to the suppression of migration abilities we observed in HeLa cells after overexpression of miR‐9 could be the direct suppression effect of miR‐9 on TC10 expression. CKAP2 was reported to promote the proliferation of WI‐38 cells in a p53 dependent way 45. Increased expression of CKAP2 in HCC tumor tissues was found associated with shorter recurrence‐free survival, indicating an oncogenic role of CKAP2 46. The knock‐down of HSPC159 could increase the sensitivity to Methotrexate of colon cancer cells 47, implying its oncogenic potential. Based on the known function of these miR‐9 target genes, it is reasonable to postulate that suppression of them may all contribute to the tumor‐suppressing role of miR‐9 in CAs.
In conclusion, our present study indicates that hypermethylation modulated miR‐9 expression silencing abolished its suppression on IL‐6, which in turn leads to the activation of IL‐6/Jak/STAT3 pathway. In together with the co‐operation of other target genes like TC10, CKAP2, and HSPC159, miR‐9 down‐regulation‐mediated IL‐6/Jak/STAT3 pathway activation may be involved in the progression of CAs.
Supporting information
Additional supporting information may be found in the online version of this article at the publisher's web‐site.
Supporting Information Figure S1: Methylation status of mir‐9‐1, mir‐9‐2 and mir‐9‐3 in CSCC tissues and normal control tissues (a‐c) Methylation intensities of three miR‐9 precursor genes in CSCC tissues and normal control tissues. (d) Relative expression of mature miR‐9 in CSCC tissues and normal control tissues.
Supporting Information Table S1: Result of STR matching analysis (DSMZ Profile Database).
Supporting Information Table S2: Primers sequences for the methylation detection and the size of thePCR products.
Supporting Information Table S3: Primers sequences for the methylation detection and the size of thePCR products.
Supporting Information Table S4: Primer sequences for luciferase reportorplasmid construction.
Supporting Information Table S5: Methylation status of miR‐9 precursors in each sample.
Supporting Information Table S6: Differently expressed genes identified by the comparisonof the mRNA expression profiles of HeLamiR‐9 and its control cells.
Supporting Information Table S7: 110 down‐regulated genes with predicted miR‐9 target.
Conflicts of interest: The authors declare no conflict of interest.
Jiangbo Zhang and Junqiao Jia contributed equally to the presented work.
REFERENCES
- 1. Jemal A, Bray F, Center MM, Ferlay J, Ward E, Forman D. Global cancer statistics. CA Cancer J Clin 2011; 61:69–90. [DOI] [PubMed] [Google Scholar]
- 2. Pisani P, Bray F, Parkin. DM . Estimates of the world‐wide prevalence of cancer for 25 sites in the adult population. Int J Cancer 2002; 97:72–81. [DOI] [PubMed] [Google Scholar]
- 3. Bosch FX, Lorincz A, Munoz N, Meijer CJ, Shah KV. The causal relation between human papillomavirus and cervical cancer. J Clin Pathol 2002; 55:244–265. [DOI] [PMC free article] [PubMed] [Google Scholar]
- 4. Ambros. V . The functions of animal microRNAs. Nature 2004; 431:350–355. [DOI] [PubMed] [Google Scholar]
- 5. Calin GA, Croce CM. MicroRNA signatures in human cancers. Nat Rev Cancer 2006; 6:857–866. [DOI] [PubMed] [Google Scholar]
- 6. Johnson CD, Esquela‐Kerscher A, Stefani G, et al. The let‐7 microRNA represses cell proliferation pathways in human cells. Cancer Res 2007; 67:7713–7722. [DOI] [PubMed] [Google Scholar]
- 7. Hu X, Schwarz JK, Lewis JS Jr, et al. A microRNA expression signature for cervical cancer prognosis. Cancer Res 2010; 70:1441–1448. [DOI] [PMC free article] [PubMed] [Google Scholar]
- 8. Rao Q, Shen Q, Zhou H, Peng Y, Li J, Lin Z. Aberrant microRNA expression in human cervical carcinomas. Med Oncol 2012; 29:1242–1248. [DOI] [PubMed] [Google Scholar]
- 9. Wang X, Tang S, Le SY, et al. Aberrant expression of oncogenic and tumor‐suppressive microRNAs in cervical cancer is required for cancer cell growth. PLoS ONE 2008; 3:e2557. [DOI] [PMC free article] [PubMed] [Google Scholar]
- 10. LiW SC, ChanL C, HuC Y, LaiC H, Hsu N, Lin WC. Identification of homologous microRNAs in 56 animal genomes. Genomics 2010; 96:1–9. [DOI] [PubMed] [Google Scholar]
- 11. Nass D, Rosenwald S, Meiri E, et al. MiR‐92b and miR‐9/9* are specifically expressed in brain primary tumors and can be used to differentiate primary from metastatic brain tumors. Brain Pathol 2009; 19:375–383. [DOI] [PMC free article] [PubMed] [Google Scholar]
- 12. Tan X, Wang S, Yang B, et al. The CREB‐miR‐9 negative feedback minicircuitry coordinates the migration and proliferation of glioma cells. PLoS ONE 2012; 7:e49570. [DOI] [PMC free article] [PubMed] [Google Scholar]
- 13. Ma L, Young J, Prabhala H. MiR‐9, a MYC/MYCN‐activated microRNA, regulates E‐cadherin and cancer metastasis. Nat Cell Biol 2010; 12:247–256. [DOI] [PMC free article] [PubMed] [Google Scholar]
- 14. Zhu L, Chen H, Zhou D. MicroRNA‐9 up‐regulation is involved in colorectal cancer metastasis via promoting cell motility. Med Oncol 2012; 29:1037–1043. [DOI] [PubMed] [Google Scholar]
- 15. Wan HY, Guo LM, Liu T, Liu M, Li X, Tang H. Regulation of the transcription factor NF‐kappaB1 by microRNA‐9 in human gastric adenocarcinoma. Mol Cancer 2010; 9:16. [DOI] [PMC free article] [PubMed] [Google Scholar]
- 16. Guo LM, Pu Y, Han Z. et al. MicroRNA‐9 inhibits ovarian cancer cell growth through regulation of NF‐kappaB1. FEBS J 2009; 276:5537–5546. [DOI] [PubMed] [Google Scholar]
- 17. Liu S, Kumar SM, Lu H, et al. MicroRNA‐9 up‐regulates E‐cadherin through inhibition of NF‐kappaB1‐Snail1 pathway in melanoma. J Pathol 2012; 226:61–72. [DOI] [PMC free article] [PubMed] [Google Scholar]
- 18. Selcuklu SD, Donoghue MT, Rehmet K, et al. MicroRNA‐9 inhibition of cell proliferation and identification of novel miR‐9 targets by transcriptome profiling in breast cancer cells. J Biol Chem 2012; 287:29516–29528. [DOI] [PMC free article] [PubMed] [Google Scholar]
- 19. Lehmann U, Hasemeier B, Christgen M, et al. Epigenetic inactivation of microRNA gene hsa‐mir‐9‐1 in human breast cancer. J Pathol 2008; 214:17–24. [DOI] [PubMed] [Google Scholar]
- 20. Bandres E, Agirre X, Bitarte N, et al. Epigenetic regulation of microRNA expression in colorectal cancer. Int J Cancer 2009; 125:2737–2743. [DOI] [PubMed] [Google Scholar]
- 21. Hildebrandt MA, Gu J, Lin J, et al. Hsa‐miR‐9 methylation status is associated with cancer development and metastatic recurrence in patients with clear cell renal cell carcinoma. Oncogene 2010; 29:5724–5728. [DOI] [PubMed] [Google Scholar]
- 22. Hu X, Schwarz JK, Lewis JS Jr, et al. A microRNA expression signature for cervical cancer prognosis. Cancer Res 2010; 70:1441–1448. [DOI] [PMC free article] [PubMed] [Google Scholar]
- 23. Wilting SM, Snijders PJ, Verlaat W, et al. Altered microRNA expression associated with chromosomal changes contributes to cervical carcinogenesis. Oncogene 2013; 32:106–116. [DOI] [PubMed] [Google Scholar]
- 24. Wang Y, Cheng J, Xu C, et al. Quantitative methylation analysis reveals gender and age differences in p16INK4a hypermethylation in hepatitis B virus‐related hepatocellular carcinoma. Liver Int 2012; 32:420–428. [DOI] [PubMed] [Google Scholar]
- 25. Xie Q, Chen X, Lu F, et al. Aberrant expression of microRNA 155 may accelerate cell proliferation by targeting sex‐determining region Y box 6 in hepatocellular carcinoma. Cancer 2012; 118:2431–2442. [DOI] [PubMed] [Google Scholar]
- 26. Chen Z, Huang C, Yang YL, et al. Inhibition of the STAT3 signaling pathway is involved in the antitumor activity of cepharanthine in SaOS2 cells. Acta Pharmacol Sin 2012; 33:101–108. [DOI] [PMC free article] [PubMed] [Google Scholar]
- 27. Zhang D, Sun M, Samols D, Kushner I. STAT3 participates in transcriptional activation of the C‐reactive protein gene by interleukin‐6. J Biol Chem 1996; 271:9503–9509. [DOI] [PubMed] [Google Scholar]
- 28. Block KM, Hanke NT, Maine EA, Baker. AF . IL‐6 stimulates STAT3 and Pim‐1 kinase in pancreatic cancer cell lines. Pancreas 2012; 41:773–781. [DOI] [PMC free article] [PubMed] [Google Scholar]
- 29. Rotkrua P, Akiyama Y, Hashimoto Y, Otsubo T, Yuasa Y. MiR‐9 downregulates CDX2 expression in gastric cancer cells. Int J Cancer 2011; 129:2611–2620. [DOI] [PubMed] [Google Scholar]
- 30. Tsai KW, Liao YL, Wu CW, et al. Aberrant hypermethylation of miR‐9 genes in gastric cancer. Epigenetics 2011; 6:1189–1197. [DOI] [PMC free article] [PubMed] [Google Scholar]
- 31. Tan HX, Wang Q, Chen LZ, et al. MicroRNA‐9 reduces cell invasion and E‐cadherin secretion in SK‐Hep‐1 cell. Med Oncol 2010; 27:654–660. [DOI] [PubMed] [Google Scholar]
- 32. Vazquez‐Mena O, Medina‐Martinez I, Juárez‐Torres E, et al. Amplified genes may be overexpressed, unchanged, or downregulated in cervical cancer cell lines. PLoS ONE 2012; 7:e32667. [DOI] [PMC free article] [PubMed] [Google Scholar]
- 33. Narayan G, Murty VV. Integrative genomic approaches in cervical cancer: Implications for molecular pathogenesis. Future Oncol 2010; 6:1643–1652. [DOI] [PMC free article] [PubMed] [Google Scholar]
- 34. Ojesina AI, Lichtenstein L, Freeman SS, et al. Landscape of genomic alterations in cervical carcinomas. Nature 2014; 506:371–375. [DOI] [PMC free article] [PubMed] [Google Scholar]
- 35. Iglesias M, Plowman GD, Woodworth. CD . Interleukin‐6 and interleukin‐6 soluble receptor regulate proliferation of normal, human papillomavirus‐immortalized, and carcinoma‐derived cervical cells in vitro. Am J Pathol 1995; 146:944–952. [PMC free article] [PubMed] [Google Scholar]
- 36. Takano H, Harigaya K, Ishii G, et al. Interleukin‐6 (IL‐6) production in carcinoma of the cervix. Arch Gynecol Obstet 1996; 258:25–33. [DOI] [PubMed] [Google Scholar]
- 37. Srivani R, Nagarajan. B . A prognostic insight on in vivo expression of interleukin‐6 in uterine cervical cancer. Int J Gynecol Cancer 2003; 13:331–339. [DOI] [PubMed] [Google Scholar]
- 38. Shi TY, Zhu ML, He J, et al. Polymorphisms of the Interleukin 6 gene contribute to cervical cancer susceptibility in Eastern Chinese women. Hum Genet 2013; 132:301–312. [DOI] [PubMed] [Google Scholar]
- 39. Wei LH, Kuo ML, Chen CA, et al. Interleukin‐6 promotes cervical tumor growth by VEGF‐dependent angiogenesis via a STAT3 pathway. Oncogene 2003; 22:1517–1527. [DOI] [PubMed] [Google Scholar]
- 40. Weirauch U, Beckmann N, Thomas M, et al. Functional role and therapeutic potential of the pim‐1 kinase in colon carcinoma. Neoplasia 2013; 15:783–794. [DOI] [PMC free article] [PubMed] [Google Scholar]
- 41. Carbajo‐Pescador S, Ordonez R, Benet M, et al. Inhibition of VEGF expression through blockade of Hif1alpha and STAT3 signalling mediates the anti‐angiogenic effect of melatonin in HepG2 liver cancer cells. Br J Cancer 2013; 109:83–91. [DOI] [PMC free article] [PubMed] [Google Scholar]
- 42. Cibull TL, Jones TD, Li L, et al. Overexpression of Pim‐1 during progression of prostatic adenocarcinoma. J Clin Pathol 2006; 59:285–288. [DOI] [PMC free article] [PubMed] [Google Scholar]
- 43. Chen Z, Han. ZC . STAT3: A critical transcription activator in angiogenesis. Med Res Rev 2008; 28:185–200. [DOI] [PubMed] [Google Scholar]
- 44. Murphy GA, Solski PA, Jillian SA, et al. Cellular functions of TC10, a Rho family GTPase: Regulation of morphology, signal transduction and cell growth. Oncogene 1999; 18:3831–3845. [DOI] [PubMed] [Google Scholar]
- 45. Shimi T, Butin‐Israeli V, Adam SA, et al. The role of nuclear lamin B1 in cell proliferation and senescence. Genes Dev 2011; 25:2579–2593. [DOI] [PMC free article] [PubMed] [Google Scholar]
- 46. Hayashi T, Ohtsuka M, Okamura D, et al. Cytoskeleton‐associated protein 2 is a potential predictive marker for risk of early and extensive recurrence of hepatocellular carcinoma after operative resection. Surgery 2014; 155:114–123. [DOI] [PubMed] [Google Scholar]
- 47. Mencia N, Selga E, Noe V, Ciudad CJ. Underexpression of miR‐224 in methotrexate resistant human colon cancer cells. Biochem Pharmacol 2011; 82:1572–1582. [DOI] [PubMed] [Google Scholar]
Associated Data
This section collects any data citations, data availability statements, or supplementary materials included in this article.
Supplementary Materials
Additional supporting information may be found in the online version of this article at the publisher's web‐site.
Supporting Information Figure S1: Methylation status of mir‐9‐1, mir‐9‐2 and mir‐9‐3 in CSCC tissues and normal control tissues (a‐c) Methylation intensities of three miR‐9 precursor genes in CSCC tissues and normal control tissues. (d) Relative expression of mature miR‐9 in CSCC tissues and normal control tissues.
Supporting Information Table S1: Result of STR matching analysis (DSMZ Profile Database).
Supporting Information Table S2: Primers sequences for the methylation detection and the size of thePCR products.
Supporting Information Table S3: Primers sequences for the methylation detection and the size of thePCR products.
Supporting Information Table S4: Primer sequences for luciferase reportorplasmid construction.
Supporting Information Table S5: Methylation status of miR‐9 precursors in each sample.
Supporting Information Table S6: Differently expressed genes identified by the comparisonof the mRNA expression profiles of HeLamiR‐9 and its control cells.
Supporting Information Table S7: 110 down‐regulated genes with predicted miR‐9 target.