

Abstract
Aims
To identify studies about the prevalence of alcohol use disorder (AUD) in mainland China, evaluate the quality of these studies and conduct a meta‐analysis of the prevalence of AUD in China's adult population and in population subgroups defined by sex, age and urban versus rural residency.
Methods
Relevant studies published prior to January 2014 were identified from the following databases: China Knowledge Resource Integrated (CNKI), Wanfang, Pubmed, EmBase and Web of Science. A 16‐item quality assessment inventory for epidemiological studies in mainland China was constructed to evaluate the methodological rigor of the studies. A total of 38 studies including 1 304 354 individuals were identified. Outcomes included current and life‐time prevalence of AUD, alcohol dependence and alcohol abuse.
Results
The pooled life‐time and current prevalence of alcohol dependence were 1.4% [95% confidence interval (CI) = 1.3, 1.5] and 1.5% (95% CI = 1.2, 1.9). For males, pooled estimates of the current prevalence of alcohol dependence, alcohol abuse and AUD were 4.4 (95% CI = 3.1, 5.7), 4.0 (95% CI = 2.2, 5.7) and 10.1% (95% CI = 4.7, 15.4), respectively; the corresponding values for females were all below 0.2, 0.1, and 0.1%. There was large between‐study heterogeneity in the prevalence measures that was associated with sample size, the use of key informants and the use of substitute respondents. The quality of included studies was generally low. Higher‐quality studies reported higher prevalence.
Conclusions
Alcohol use disorder is an urgent public health problem in China, especially among males. When using high‐quality studies, current and life‐time prevalence estimates of alcohol dependence in China measure 2.2% and 3.7%, respectively, approaching those of the Netherlands, United States and other western countries.
Keywords: Alcohol use disorder, China, meta‐analysis, prevalence, quality assessment, systematic review
Introduction
Alcohol use disorder (AUD) is a common mental disorder that is associated with substantial disease burden around the world, including China 1. The recently published 2010 Global Burden of Disease (GBD) data for China reported that AUD accounted for 11.7% of the total burden of disease attributed to mental and behavioral disorders 2, making it the second most important mental disorder after depression. Despite the magnitude of this public health problem, there has been little systematic research and no targeted policy initiatives to address the problem in China.
The first step in addressing this problem is to determine the prevalence and demographic profile of AUD, but there is currently little good‐quality, nationally representative data about the prevalence of AUD in China. China's drinking culture is quite different from that in high‐income countries, so the algorithm that the GBD report used to assess the health burden related to AUD 1, which is based primarily on western studies, may need to be modified to make it more relevant for China. In China, for example, heavy drinking episodes, only seen typically in males, occur most frequently during meals or other social functions with business associates, friends or relatives. At these functions repetitive toasting is used to express respect, and mutual intoxication is used to establish and reinforce important social relationships 3. The western pattern of drinking alone in pubs and party drinking among young adults is rare. Available studies about AUD in China report a different demographic profile than that reported elsewhere: male AUD prevalence is 30‐fold that of female prevalence, and the highest prevalence of AUD is seen in middle‐aged (not young) men 4, 5, 6, 7. These studies also suggest that the prevalence of AUD in China has been increasing over time in concert with increases in individual disposable income 8; but these reported increases may also be due to the use of more sensitive measures of AUD in more recent epidemiological studies.
Most of the available epidemiological studies about AUD in China were conducted within specific regions or specific population subgroups, and many of the published studies have serious methodological limitations. Thus, before initiating interventions to reduce the burden of AUD in China, several tasks—similar to the tasks now being undertaken to combat China's smoking epidemic—need to be undertaken: (1) all available reports on the prevalence of AUD published in either Chinese or English need to be collected; (2) after considering the quality of each study, the findings need to be integrated into an up‐to‐date profile of the prevalence and expected trajectory of AUD in different demographic groups around the country; and (3) based on these results, a plan for creating an ongoing monitoring system for AUD that will inform alcohol‐related policies and programs needs to be developed and implemented.
As a first step in this decades‐long process, the current report aims: (1) to systematically review, evaluate and summarize prevalence studies on AUD conducted in mainland China; and (2) to assess variations in the reported prevalence with regard to sex, age, location, year of study and methodological quality of the study.
Methods
Search strategy and inclusion criteria
The following databases were searched for articles published before January 2014: China Knowledge Resource Integrated (CNKI), Wanfang, Pubmed, Ovid‐EmBase, Web of Science [including the science citation index (expanded), social sciences citation index, and arts and humanities citation index], and PsycInfo using the following Boolean search strategy: (alcohol use disorder OR alcohol abuse OR alcohol dependence OR alcoholism) AND prevalence AND China. All citations of the identified articles were hand‐checked to identify any additional articles.
Studies that met the following criteria were included: (1) reported the prevalence (current or life‐time) of alcohol use disorders, alcohol abuse or alcohol dependence; (2) reported numbers of cases and sample sizes; (3) used one of the three main diagnostic systems employed in China [the Chinese Classification of Mental Disorders (CCMD), the Diagnostic and Statistical Manual of Mental Disorders (DSM)] or the International Classification of Diseases (ICD)]; (4) conducted in mainland China; and (5) the source population is community‐dwelling individuals. Two authors (F.D. and W.X.) performed independently the search of all identified articles.
Data extraction
Three authors (F.D., W.X. and H.G.C.) extracted the following information from all included articles: sample size, year of publication, year of the survey, location of study, sampling method, geographical scope of the area surveyed (city, county, province, etc.), diagnostic system used, response level, number of AUD cases and prevalence of AUD. Numbers of cases and prevalence were extracted for males, females, urban residents, rural residents and different age groups. When separate results were reported for cross‐sectional surveys of the same population at different times, or when one publication reported results from multiple sites, data were extracted for each individual survey or site.
Quality assessment
The quality assessment scale developed for this analysis included the 16 items listed in Table 1. The construction of the list was based on the STROBE (Strengthening the Reporting of Observational Studies in Epidemiology) statement 9, several other quality assessment tools for prevalence studies 10, 11 and the authors’ own knowledge about internal and external validity of epidemiological studies in China. Items 14–16 were added to the list after reviewing several articles.
Table 1.
Number of studies (of 38 studies) that contained information on the 16 quality assessment items.
| Item | n (%) |
|---|---|
| 1. Provided location of study | 38 (100.0%) |
| 2. Defined eligibility criteria, source population and sampling procedure | 12 (31.6%) |
| 3. Reported numbers of individuals at each stage of study (e.g. numbers potentially eligible, examined for eligibility, confirmed eligible, included in the study, completing assessment and included in analysis) | 5 (13.2%) |
| 4. Gave reasons for non‐participation at each stage | 7 (18.4%) |
| 5. Study dates of recruitment | 30 (78.9%) |
| 6. Clearly defined the method of assessing alcohol‐use disorders (e.g. non‐structured, semistructured or structured interview) | 32 (84.2%) |
| 7. Assessed by psychiatrist | 16 (42.1%) |
| 8. Used weighting and other analytical methods to take account of sampling strategy and non‐response rates | 5 (13.2%) |
| 9. Reported number of cases | 33 (86.8%) |
| 10. Provided unadjusted estimates and, if applicable, adjusted estimates and 95% CI | 6 (15.8%) |
| 11. Sampling method identified a sample that was representative of the source population | 10 (26.3%) |
| 12. Provided inter‐rater reliability of diagnostic assessment | 23 (60.5%) |
| 13. Used validated diagnostic tools | 25 (65.8%) |
| 14. Reported prevalence matches number of cases and sample size | 32 (84.2%) |
| 15. Interviewed key informants in the community about numbers of affected individuals in the community (reverse‐coded: if yes, score ‘0’; if no, score ‘1’) | 6 (15.8%) |
| 16. Used substitutes [usually within the same primary sampling unit (PSU) and matched on sex and age) if target subject not available (reverse‐coded: if yes, score ‘0’; if no, score ‘1’) | 3 (7.9%) |
CI = confidence interval.
For items 1–14, studies that fulfilled the specified criterion were given a ‘1’ and those that did not were given a ‘0’; items 15 and 16 were reverse‐coded. Thus, the theoretical range of the total score was 0–16. The quality of each study was categorized into three groups based on the total score of the study (i.e. 0 ~ 7 = low, 8 ~ 12 = intermediate, 13 ~ 16 = high). Each paper was assessed by two authors; the intraclass correlation coefficient (i.e. inter‐rater reliability) of the initial total score was 0.67. For 31 of the papers, differences in initial scores on items were discussed by the two raters to arrive at a consensus score of the item; in two cases the opinion of a third author was sought to settle unresolved disagreements over an item. The most inconsistently coded item was item 2 (kappa = 0.22), which evaluates the adequacy of the description of the sampling procedures in the paper; several papers reported that a sample was ‘selected’ from a population without specifying how it was selected, resulting in different scores by the two coders.
The review protocol was not registered.
Analysis
DerSimonian–Laird random‐effect models were used to determine the pooled prevalence estimates 12. The DerSimonian–Laird model is one of the most commonly used random‐effect models, and has been shown to perform well in different scenarios in a simulation study 13. In this study, we constructed the models using the prevalence and its standard error reported in the original papers. Some of the original papers did not report standard errors; in these cases we calculated the standard error using the formula: , where p is the prevalence and n is the sample size.
We report both non‐transformed and transformed estimates based on the Freeman–Tukey type arcsine square‐root transformation 14. This type of transformation eliminates confidence intervals (CIs) outside the 0–100% range and stabilizes the variance. The Freeman–Tukey transformation assumes that the reported prevalence in the original studies are unweighted, but several of the original studies considered in this meta‐analysis 6, 7, 8, 15, 16 used weights to take into account differential sampling probability (usually oversampling of high‐risk individuals) and poststratification factors (to bring the sample into balance with the source population), and they adjusted the standard errors for possible clustering as a result of multi‐stage sampling strategies. To deal with this issue, we used the expected number of cases (i.e. the product of the prevalence and sample size) rather than the actual number of cases identified in these studies for the transformation. In view of the use of this data manipulation, we chose to present the untransformed data as our main results and the Freeman–Tukey transformed results in the Supporting information.
Heterogeneity in estimates across studies is measured by I2, which represents the proportion of the variance in the estimates across studies due to heterogeneity 17. All outcomes for which data were available in at least 10 studies were assessed for ‘small study effect’ using the Egger's test 18; a P‐value of less than 0.05 is considered statistically significant and 95% CIs were provided to gauge the precision of estimates.
Meta‐regression was used to explore factors associated with heterogeneity for all estimates that were based on data from 10 studies or more. (Results for outcomes with fewer than 10 studies are available upon request.) All quality items and available study characteristics were considered as potential independent variables in these regression models, including sample size [categorized into ‘small’ (<3000), ‘medium–small’ (3001–8000), ‘medium–large’ (8001–20 000) and ‘large’ (>20 000)], the year the study was conducted (categorized into ‘before 1991’, ‘1991–2000’ and ‘after 2000’), geographical location of the survey (‘East’ and ‘West’ regions of China) and the language of publication (Chinese or English). Bivariate associations were first estimated and then final multivariate models were estimated using a backward stepwise method of selection. For meta‐regressions the significance level was set at 0.10, because the statistical power is reduced due to the limited number of studies for the analysis of heterogeneity; this level of significance has been used in previous systematic reviews for the assessment of heterogeneity 19, 20. All analyses were conducted using Stata statistical software (version 13.1; StataCorp LP, College Station, TX, USA), including three user‐written commands: the ‘metaan’ command was used to generate the pooled estimates, the ‘metareg’ command was used for meta regression and the ‘metabias’ command was used to assess the small study effect (i.e. publication bias).
Results
As shown in Fig. 1, the search identified 2427 publications, 39 of which met the inclusion criteria. One of these studies did not specify the time‐frame of the prevalence estimate (i.e. life‐time or current) and, as the author was unreachable, it was excluded 21. Therefore, a total of 38 studies with a total of 1 304 354 individuals were included in the analysis; 14 used the Chinese diagnostic system (CCMD), 16 used the DSM system and eight used the ICD system. The basic characteristics of these studies are shown in Table 2. Among the nine studies that reported the prevalence of alcohol abuse, six followed the diagnostic hierarchy that prioritizes alcohol dependence over alcohol abuse (thus, ‘alcohol abuse’ in these studies denotes non‐dependence alcohol abuse) and three studies allowed for comorbid alcohol abuse and alcohol dependence 22, 23, 24. Three studies reported two separate sets of estimates for two different sites or for two different years 7, 24, 25, so the final data set from the 38 studies included 41 separate epidemiological estimates. Based on these studies, estimates are available for 20 of the 31 provinces, autonomous regions and separate municipal regions in mainland China. Fig. S1 in the Supporting information provides a map of the prevalence of alcohol dependence in China summarized from all available data.
Figure 1.
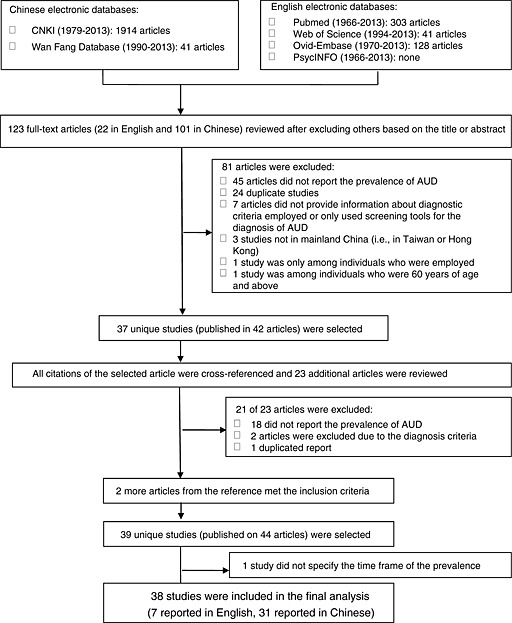
Flowchart of the identification of articles
Table 2.
Characteristics of included studies.
| Reference no. | Author | Language | Cites/Province(s) | year of study | Diagnostic criteria | Response level | Sample size | Smallest sampling unit |
|---|---|---|---|---|---|---|---|---|
| 4 | Hao, Wei | English | Five cities across China | 2001 | DSM‐3‐R | 0.98 | 24 992 | Household |
| 5 | Phillips, Michael | English | 4 provinces across China | 2001 | DSM‐4 | 0.95 | 16 577 | Individual |
| 6 | Yutao Xiang | English | Beijing | 2006 | DSM‐3‐R | Not reported | 5926 | Individual |
| 7 | Zhou, Liang | English | Shuangfeng, Hunan & Weihui, Henan | 2007 | DSM‐4 | 0.83 | 5351 in Shuangfeng; 4515 in Weihui; | Individual |
| 15 | Lee, Sing | English | Beijing & Shanghai | 2001 | DSM‐4 | 0.75 | 5201 | Individual |
| 22 | Namkoong, Kee | English | Yanbian | 1988 | DSM‐3 | Not reported | 1532 | Not clear |
| 23 | Yang, Jiayi | Chinese | Kunming, Yunnan | 2005 | ICD‐10 | Not reported | 5033 | Individual |
| 24 | Liu, Zhaoxi | Chinese | Shandong | 1984 | CCMD | Not reported | 88 822 in 1984; 67 901 in 1994 | Not clear |
| 25 | Zhang, Jinhui | Chinese | Shaoxing, Zhejiang | 1991 | CCMD‐2 | Not reported | 214 640 in 1991; 339 651 in 2001 | Village or street |
| 33 | Gao, Zhizhong | Chinese | Zhangjiakou, Hebei | 1987 | CCMD | Not reported | 6200 | Not enough information |
| 16 | Li, Keqiang | English | Hebei | 2004 | DSM‐4‐TR | 0.86 | 20 716 | Neighborhood/village |
| 34 | Wang, Xiaoqiong | Chinese | Ruian, Jiangxi | 2004 | CCMD‐3 | Not reported | 77 116 | Individual |
| 35 | Wang, Yachun | Chinese | Tongzhou, Jiangsu | 2002 | CCMD‐2‐R | 0.93 | 145 188 | Village |
| 36 | Zhang, xiaobin | Chinese | Pinggu, Beijing | 2004 | ICD‐10 | Not reported | 293 | Township |
| 37 | Kang, Ming | Chinese | Huaiyin, Jiangsu | 1989 | CCMD‐2 | 0.98 | 13 892 | Individual |
| 38 | Yang, Xiaoli | Chinese | Liaoning | 2004 | DSM‐3‐R | 0.86 | 13 358 | Household |
| 39 | Zhu, Xiangou | Chinese | Yichun, Jiangxi | 2002 | CCMD‐3 | Not reported | 1898 | Household |
| 40 | Zhou, Yingping | Chinese | Huizhou, Guangdong | 2010 | CCMD‐3 | Not reported | 1420 | Household |
| 41 | Hao, Wei | Chinese | Hunan | 1991 | CCMD‐2 | Not reported | 2378 | Household |
| 42 | Hu, Jiming | Chinese | Zhongshan, Guangdong | 2000 | CCMD‐2 | Not reported | 2909 | Household |
| 43 | Jia, Liangchun | Chinese | 3 cites in Guizhou | 2002 | CCMD‐3 | Not reported | 8506 | Household |
| 44 | Zhang, Mingkang | Chinese | Wuxi, Jiangsu | 2003 | CCMD‐3 | Not reported | 11 940 | Household |
| 45 | Li, Jun | Chinese | Wenchuan, Sichuan | 2008 | DSM‐4‐TR | 0.71 | 14 207 | Individual |
| 46 | Wei, Bo | Chinese | Guangxi | 2007 | ICD‐10 | 0.86 | 18 219 | Individual |
| 47 | Gong, Zhaoying | Chinese | Weihai, Shandong | 2006 | CCMD‐3 | Not reported | 50 174 | Village/neighborhood committee |
| 48 | Zhang, Mingsheng | Chinese | Wenling, Zhejiang | 1992 | CCMD‐2 | Not reported | 1985 | Village |
| 49 | Yu, Junhong | Chinese | Zhenjiang, Jiangsu | 1993 | DSM‐3‐R | Not reported | 6012 | Not clear |
| 50 | Hao Wei | English | Six cities across China | 1993 | DSM‐3‐R | 0.91 | 23 513 | Household |
| 51 | Wang, Lehui | Chinese | Beijing | 1991 | DSM‐3 | Not reported | 35 385 | Household |
| 52 | Wang, Yaohua | Chinese | Panzhihua, Sichuan | 1997 | DSM‐3‐R | 0.94 | 5364 | Individual |
| 53 | Jia, Liangchun | Chinese | Guizhou | 2001 | CCMD‐3 | Not reported | 7970 | Individual |
| 54 | Guo, Wanjun | Chinese | 5 Jinuo villages, Yunnan | 2000 | ICD‐10 | 0.95 | 640 | Village/communes |
| 55 | Wang, Min | Chinese | Chengdu, Sichuan | 2010 | DSM‐4 | 0.85 | 9175 | Not clear |
| 56 | Zhang, Weixi | Chinese | Seven cities across China | 1993 | CCMD‐2 | Not reported | 19 223 | Village or street |
| 61 | Li, Li | Chinese | Dongying, Shandong | 2008 | CCMD‐3 | Not reported | 6034 | Household |
| 62 | Tang, Wei | Chinese | Wenzhou, Zhejiang | 2002 | ICD‐10 | Not reported | 18 173 | Household |
| 63 | A, Hongli | Chinese | Dali & Kunming, Yunnan | 2004 | ICD‐10 | Not reported | 200 | Household |
| 64 | Liu, Shanming | Chinese | Four cities/districts, Tibet | 2003 | DSM‐IV | >0.99 | 1722 | Individual |
DSM‐IV Diagnostic and Statistical Manual, version IV; ICD = International Classification of Diseases; CCMD‐3 = Chinese Classification of Mental Disorders, version 3.
The most commonly reported outcome measures were life‐time alcohol dependence (31 studies) and current alcohol dependence (17 studies). Current dependence usually referred to ‘point prevalence’ (13 of the 17 studies), but four studies reported current prevalence for periods ranging from the prior 2 weeks to the prior year. Among the eight studies that reported current alcohol abuse, four defined current prevalence as ‘point prevalence’ and the other four defined current prevalence for different intervals up to 1 year.
Prevalence of AUD
As shown in Table 3, for the population as a whole, the pooled estimates for the current prevalence of alcohol dependence, alcohol abuse and overall AUD were 1.5% (95% CI = 1.2, 1.9), 0.9% (95% CI = 0.6, 1.1) and 3.2% (95% CI = 2.1, 4.2), respectively. The corresponding life‐time estimates were 1.4% (95% CI = 1.3, 1.5), 3.3% (95% CI = 2.1, 4.5) and 2.5% (95% CI = 2.2, 2.7). Corresponding values using the Freeman–Tukey transformation, which are shown in the Supporting information, Table S1, were similar. The detailed data on which these pooled estimates are based are shown in forest plots: the forest plots for alcohol dependence are presented in Figs 2 and 3; those for alcohol abuse and AUD (which are based on a smaller number of studies) are shown in the Supporting information, Fig. S2. Forest plots can also be constructed based on the Freeman–Tukey transformed results; an example is shown in the Supporting information, Fig. S3.
Table 3.
Pooled estimates of current and life‐time prevalence of alcohol use disorders using the DerSimonian–Laird random‐effect models, data from China 1987 to 2013.
| Outcome | Subgroup | No. of studies | Range of prevalence (%) | Pooled prevalence (%) | 95% CI (%) | I2 (%) |
|---|---|---|---|---|---|---|
| Current prevalence | ||||||
| Alcohol use disorder | Overall | 5 | 1.6, 5.8 | 3.2 | 2.1, 4.2 | 97.8 |
| Alcohol dependence | Overall | 17 | 0.1, 17.3 | 1.5 | 1.2, 1.9 | 99.2 |
| Alcohol abuse | Overall | 8 | 0.1, 3.7 | 0.9 | 0.6, 1.1 | 98.0 |
| Alcohol use disorder | Male | 4 | 3.9, 16.4 | 10.1 | 4.7, 15.4 | 99.5 |
| Alcohol dependence | Male | 11 | 0.8, 26.7 | 4.4 | 3.1, 5.7 | 99.5 |
| Alcohol abuse | Male | 5 | 1.6, 7.7 | 4.0 | 2.2, 5.7 | 98.6 |
| Alcohol use disorder | Female | 2 | 0.1, 0.3 | 0.2 | <0.1, 0.4 | 90.6 |
| Alcohol dependence | Female | 9 | <0.1, 6.4 | 0.1 | <0.1, 0.2 | 88.0 |
| Alcohol abuse | Female | 3 | 0.1, 0.2 | 0.1 | <0.1, 0.1 | 49.3 |
| Alcohol use disorder | Urban | 1 | 5.2 | 4.0, 6.5 | – | |
| Alcohol dependence | Urban | 6 | <0.1, 1.6 | 0.5 | 0.2, 0.9 | 96.1 |
| Alcohol abuse | Urban | 2 | 0.9, 3.6 | 2.2 | <0.1, 4.8 | 95.1 |
| Alcohol use disorder | Rural | 1 | 6.1 | 5.4, 6.8 | – | |
| Alcohol dependence | Rural | 7 | 0.1, 17.3 | 1.2 | 0.7, 1.8 | 98.0 |
| Alcohol abuse | Rural | 2 | 0.8, 3.4 | 2.1 | <0.1, 4.7 | 98.1 |
| Life‐time prevalence | ||||||
| Alcohol use disorder | Overall | 7 | <0.1, 9.8 | 2.5 | 2.2, 2.7 | 99.7 |
| Alcohol dependence | Overall | 31 | <0.1, 20.0 | 1.4 | 1.3, 1.5 | 99.4 |
| Alcohol abuse | Overall | 5 | 1.2, 6.9 | 3.3 | 2.1, 4.5 | 96.9 |
| Alcohol use disorder | Male | 4 | 8.2, 22.6 | 13.8 | 6.5, 21.1 | 99.5 |
| Alcohol dependence | Male | 26 | 0.1, 28.5 | 4.7 | 4.2, 5.2 | 99.5 |
| Alcohol abuse | Male | 7 | 1.8, 13.8 | 6.2 | 3.8, 8.7 | 99.0 |
| Alcohol use disorder | Female | 2 | 0.4, 1.7 | 0.9 | <0.1, 2.2 | 88.1 |
| Alcohol dependence | Female | 24 | 0.0, 11.8 | 0.1 | <0.1, 0.1 | 84.9 |
| Alcohol abuse | Female | 5 | <0.1, 0.2 | 0.1 | <0.1, 0.1 | 49.5 |
| Alcohol use disorder | Urban | 2 | 3.9, 4.7 | 4.6 | 4.1, 5.1 | <0.1 |
| Alcohol dependence | Urban | 15 | <0.1, 7.8 | 0.9 | 0.7, 1.1 | 98.8 |
| Alcohol abuse | Urban | 2 | 0.2, 3.3 | 1.7 | <0.1, 4.8 | 98.3 |
| Alcohol use disorder | Rural | 2 | 3.9, 5.4 | 4.5 | 3.1, 5.9 | 76.9 |
| Alcohol dependence | Rural | 16 | <0.1, 18.3 | 1.2 | 1.0, 1.4 | 99.0 |
| Alcohol abuse | Rural | 2 | 1.7, 3.4 | 2.6 | 0.9, 4.2 | 90.6 |
CI = confidence interval.
Figure 2.

Forest plots of current and life‐time prevalence (%) of alcohol dependence among community‐dwelling adults in China using the DerSimonian–Laird random‐effect model
Figure 3.
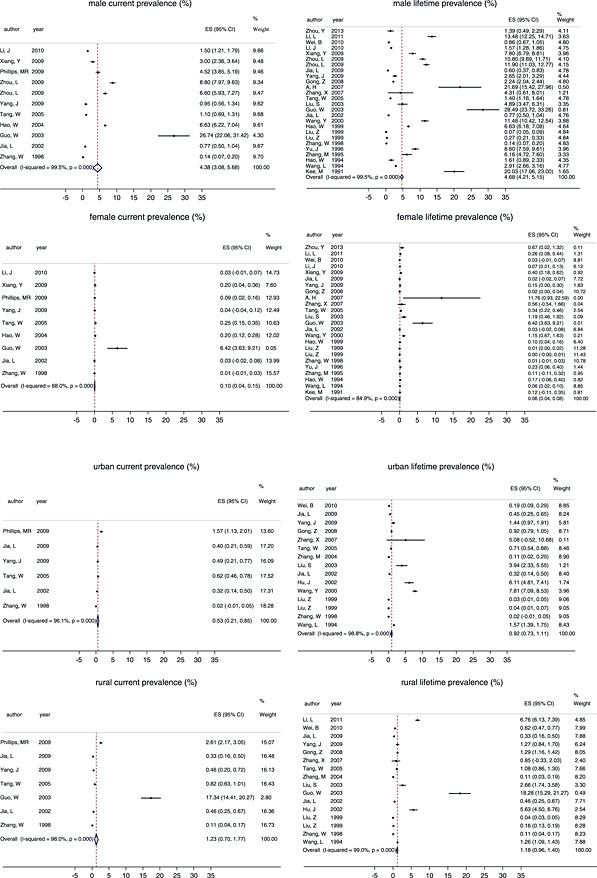
(a) Forest plots of current and lifetime prevalence (%) of alcohol dependence among community‐dwelling adult males and females in China using the DerSimonian–Laird random‐effect model. (b) Forest plots of current and life‐time prevalence (%) of alcohol dependence among community‐dwelling adults in urban and rural China using the DerSimonian–Laird random‐effect model
Both Table 3 and Fig. 3 highlight the much higher prevalence of AUD in Chinese males compared to Chinese females. Using all available information, we conducted a meta‐analysis of the male‐to‐female ratios (MFR) of the different measures and found large between‐study heterogeneity (i.e. I 2 > 50%). The pooled estimate of the MFR for current alcohol dependence from nine studies was 11.9 (95% CI = 5.8, 24.5; range = 4.2, 54.8; I 2 = 38.6%), and the pooled estimate of the MFR for life‐time alcohol dependence from 24 studies was 17.4 (95% CI = 10.0, 30.3; range = 1.8, 336.2; I 2 = 90.7%). Three studies provided information on the MFR of the current prevalence of alcohol abuse [pooled MFR = 35.1 (95% CI = 9.6, 128.1); I 2 < 0.1%] and five studies reported information on the MFR of the life‐time prevalence of alcohol abuse [pooled MFR = 36.0 (95% CI = 8.7, 148.5); I 2 = 83.0%]. Two studies provided information on the MFR of the current prevalence of AUD [MFR = 51.0 (95% CI = 25.3, 102.6) and 37.9 (95% CI = 25.4, 56.3)] and two studies reported information on the MFR of the life‐time prevalence of AUD [MFR = 22.1 (95% CI = 14.8, 32.9) and 4.0 (95% CI = 2.3, 7.2)].
Table 3 and Fig. 3 also provide estimates of the prevalence of AUD in urban and rural communities. Using information from studies that assessed AUD in both rural and urban sites, the pooled estimates for the rural‐to‐urban ratio of the current prevalence of alcohol dependence were 1.4 (95% CI = 1.1, 1.8; number of studies = 7; range = 0.8, 5.9; I 2 = 29.9%) and the corresponding estimate of life‐time alcohol dependence was 1.3 (95% CI = 0.99, 1.8; number of studies = 15; range = 0.2, 5.9; I 2 = 83.0%). One study reported a rural‐to‐urban ratio of current AUD of 1.2 (95% CI = 1.1, 1.3). The rural‐to‐urban ratio of current alcohol abuse, life‐time AUD and life‐time alcohol abuse (ranging from 0.8 to 3.3) were reported in two studies each, but CIs around these ratios all included the null value (one), indicating that the differences in the prevalence between urban and rural populations for these conditions were not statistically significant.
Prevalence of AUD in different age groups
Due to the limited number of studies and different categorization of age groups across studies, it was impossible to produce pooled estimates for different age groups, so we are only able to provide a narrative summary. Eight studies reported age‐group‐specific life‐time prevalence of alcohol dependence and six reported age‐group‐specific current prevalence of alcohol dependence. The most common pattern for both life‐time and current prevalence was an increasing trend with age (until the age of 60 years) with a rapid climb prior to the age of 30 years and a slower climb among individuals aged 30–60 years. The prevalence among those younger than 25 years was consistently low (<1%). The ratio of the prevalence among older adults 26, 27, 28, 29, 30, 31, 32, 33, 34, 35, 36, 37, 38, 39, 40, 41, 42, 43, 44, 45, 46, 47, 48, 49, 50, 51, 52, 53, 54, 55, 56 to that in younger adults 18, 19, 20, 21, 22, 23, 24, 25, 26, 57, 58, 59, 60 varied from 2 to more than 10, with a mean ratio of approximately 6.5. Two studies reported life‐time alcohol abuse by age and three reported current prevalence of alcohol abuse by age; they all reported higher prevalence among individuals between 25 and 55 years of age compared to those older than 55 years.
Quality evaluation, assessment of small study effect and correlates of heterogeneity
The details of the quality assessment are shown in Table 1. Only seven of the 16 quality items were present in more than 75% of the studies. Four items were absent in more than 75% of the studies: they did not report the numbers of individuals at each sampling stage of the study, did not provide reasons for non‐participation, did not use weighting to adjust for sampling and non‐response rates and did not provide both unadjusted and adjusted rates. The remaining five quality items were present in 25–75% of the studies: the sample was representative of the source population in only 26% of the studies; the study used clearly defined eligibility criteria, source population and sampling procedures in only 32% of studies; the diagnostic assessment was by a psychiatrist in 42% of the studies; the report provided measures of reliability in 61% of studies; and validated diagnostic tools were used in 66% of the studies.
The total quality score varied from 4 to 14, with a median of 6 (interquartile range = 5, 8) indicating a somewhat low overall quality. Due to the wide variation in quality across studies, we conducted a stratified analysis by study quality. The results for the estimated outcomes that were based on data from 10 studies or more are shown in Table 4. For all assessed AUD outcomes, there is a clear trend for increased reported prevalence with increasing quality of study. A similar analysis using the Freeman–Tukey transformed estimates (Supporting information, Table S2) showed a similar trend. Results for outcomes based on data from fewer than 10 studies stratified by study quality are shown in the Supporting information, Table S3.
Table 4.
Pooled prevalence estimates of current and life‐time alcohol dependence among adults living in China for seven outcomes (those with data from 10 studies or more from 1987 to 2013) estimated using DerSimonian–Laird random‐effect models and stratified by the quality of the included studies.a
| Outcome | Subgroup | Quality category | No. of studies | Pooled estimate (%) | 95% CI (%) | I2 (%) |
|---|---|---|---|---|---|---|
| Current alcohol dependence | Total | Low | 2 | 0.5 | 0.2, 0.8 | 92.4 |
| Intermediate | 12 | 1.5 | 1.1, 2.0 | 99.4 | ||
| High | 3 | 2.2 | 1.6, 3.7 | 82.6 | ||
| Current alcohol dependence | Male | Low | 1 | 1.1 | 0.9, 1.3 | – |
| Intermediate | 6 | 3.9 | 2.2, 5.7 | 99.6 | ||
| High | 4 | 5.7 | 3.4, 8.1 | 97.8 | ||
| Life‐time alcohol dependence | Total | Low | 12 | 0.8 | 0.6, 0.9 | 99.3 |
| Intermediate | 17 | 2.0 | 1.6, 2.5 | 99.4 | ||
| High | 2 | 3.7 | 2.5, 4.9 | 83.7 | ||
| Life‐time alcohol dependence | Males | Low | 8 | 4.6 | 4.0, 5.3 | 99.4 |
| Intermediate | 14 | 3.7 | 2.7, 4.7 | 99.0 | ||
| High | 4 | 8.9 | 6.1, 11.6 | 96.6 | ||
| Life‐time alcohol dependence | Females | Low | 8 | <0.1 | <0.1, 0.1 | 86.4 |
| Intermediate | 14 | 0.1 | <0.1, 0.1 | 80.5 | ||
| High | 2 | 0.7 | <0.1, 1.5 | 75.6 | ||
| Life‐time alcohol dependence | Urban | Low | 3 | 0.2 | 0.1, 0.3 | 96.7 |
| Intermediate | 11 | 1.5 | 1.1, 1.9 | 98.5 | ||
| High | 1 | 3.9 | 2.3, 5.6 | – | ||
| Life‐time alcohol dependence | Rural | Low | 4 | 1.3 | 1.0, 1.6 | 99.5 |
| Intermediate | 11 | 1.2 | 0.8, 1.6 | 98.5 | ||
| High | 1 | 2.7 | 1.7, 3.6 | – |
The low, intermediate and high quality are based on the score on the 16‐item quality scale (described in Methods section): 0 ~ 7 = low, 8 ~ 12 = intermediate, 13 ~ 16 = high. CI = confidence interval.
Table 5 shows the result of Egger's test of small study effects for the seven outcomes that had data from 10 studies or more. For all these outcomes the estimate was significantly greater than 0, which indicates a strong small study effect—that is, smaller studies tended to report higher estimates of AUD prevalence. This result can also be demonstrated using funnel plots, an example of which is shown in the Supporting information, Fig. S4.
Table 5.
Egger's test for small‐study effects on prevalence estimates of alcohol dependence among adults living in China for seven outcomes (those with data from 10 studies or more from 1987 to 2013).
| Outcome | Subgroup | No. of studies | Estimate | 95% CI |
|---|---|---|---|---|
| Current alcohol dependence | Total | 17 | 12.5 | 7.2, 17.8 |
| Current alcohol dependence | Male | 11 | 15.7 | 8.4, 22.9 |
| Life‐time alcohol dependence | Total | 31 | 12.0 | 8.9, 15.0 |
| Life‐time alcohol dependence | Males | 26 | 13.5 | 9.8, 17.1 |
| Life‐time alcohol dependence | Females | 24 | 2.6 | 2.0, 3.2 |
| Life‐time alcoholdependence | Urban | 15 | 9.0 | 4.7, 13.2 |
| Life‐time alcohol dependence | Rural | 16 | 9.2 | 5.4, 12.9 |
CI = confidence interval.
Table 6 presents the results of meta‐regression analyses that identified study characteristics associated with the heterogeneity in each of the seven prevalence measures that were based on data from 10 studies or more. We considered 21 covariates; nine of them showed up in the bivariate meta‐regression results, but only three covariates remained in the final models: (1) sample size was associated inversely with prevalence in five of the seven measures considered (i.e. smaller sample sizes were associated with higher prevalence); (2) studies that provided information on the reasons for non‐participation (quality item 4) reported a higher prevalence in two of the seven measures considered; and (3) the use of substitute respondents (when the originally sampled participant could not be located or was not available) was associated with higher prevalence of life‐time alcohol dependence for females.
Table 6.
Factors associated with the heterogeneity of prevalence estimates of alcohol dependence among adults in China using backward stepwise meta‐regression for seven outcomes reported in 10 or more studies from 1987 to 2013.a
| Outcome | Covariate | Bivariate β | 90% CI | Stepwise β | 90% CI | R2 (%) b |
|---|---|---|---|---|---|---|
| Current alcohol dependence (%) | Sample size | |||||
| 2nd quartile | –7.0 | –11.3, –2.8 | –7.0 | –11.3, –2.8 | 43.0 | |
| 3rd quartile | –6.8 | –10.7, –3.0 | –6.8 | –10.7, –3.0 | ||
| 4th quartile | –5.5 | –10.5, –0.4 | –5.5 | –10.5, –0.4 | ||
| Provides reasons for non‐participation | ||||||
| Yes | 5.0 | 1.7, 8.2 | ||||
| Used validated tools | ||||||
| Yes | –5.7 | –9.3, –2.1 | ||||
| Male current alcohol dependence (%) | Provides reasons for non‐participation | |||||
| Yes | 8.9 | 2.5, 15.3 | 5.7 | 4.1, 7.4 | 97.0 | |
| Sample size | ||||||
| 2nd quartile | –22.7 | –30.3, –15.1 | –28.4 | –24.6, –13.6 | ||
| 3rd quartile | –24.9 | –32.6, –17.2 | –28.0 | –25.9, –15.0 | ||
| 4th quartile | –20.1 | –29.2, –11.0 | –28.6 | –26.1, –14.9 | ||
| Used validated tools | ||||||
| Yes | –23.4 | –30.7, –16.1 | ||||
| Life‐time alcohol dependence (%) | Sample size | |||||
| 2nd quartile | –2.3 | –5.9, 1.2 | –2.3 | –5.9, 1.2 | 16.9 | |
| 3rd quartile | –4.9 | –8.5, –1.4 | –4.9 | –8.5, –1.4 | ||
| 4th quartile | –5.1 | –8.6, –1.5 | –5.1 | –8.6, –1.5 | ||
| Use of informants | ||||||
| Yes | –3.6 | –6.8, –0.4 | ||||
| Region of China | ||||||
| East | –3.6 | –6.8, –0.3 | ||||
| Male life‐time alcohol dependence (%) | Published in English | |||||
| Yes | 6.1 | 0.2, 12.0 | 6.7 | 1.2, 12.2 | 25.3 | |
| Sample size | ||||||
| 2nd quartile | –2.1 | –7.6, 3.5 | –4.3 | –9.9, 1.2 | ||
| 3rd quartile | –9.6 | –15.9, –3.3 | –7.4 | –14.1, –0.6 | ||
| 4th quartile | –8.1 | –14.4, –1.8 | –8.7 | –14.6, –2.8 | ||
| Female life‐time alcohol dependence (%) | Use of substitute respondents | |||||
| Yes | 0.2 | <0.1, 0.4 | 0.2 | <0.1, 0.4 | 79.9 | |
| Urban life‐time alcohol dependence (%) | Sample size | |||||
| 2nd quartile | –1.9 | –4.9, 1.1 | –1.9 | –4.9, 1.1 | 41.5 | |
| 3rd quartile | –4.8 | –7.5, –2.0 | –4.8 | –7.5, –2.0 | ||
| 4th quartile | –4.4 | –7.3 –1.6 | –4.4 | –7.3 –1.6 | ||
| Use of informants | ||||||
| Yes | –2.1 | –4.4, –0.1 | ||||
| Rural life‐time alcohol dependence (%) | Provides reasons for non‐participation | |||||
| Yes | 8.4 | 3.6, 13.2 | 8.4 | 3.6, 13.2 | 38.5 | |
| Sample size | ||||||
| 2nd quartile | –3.7 | –9.2, 1.8 | ||||
| 3rd quartile | –6.1 | –10.9, –1.2 | ||||
| 4th quartile | –5.8 | –10.9, –0.7 | ||||
| Representativeness of the sample | ||||||
| Yes | 5.5 | 0.9, 10.0 | ||||
Bivariate meta‐regression was conducted for each of the above seven outcome for all 21 covariates [i.e. quality of the study, language of publication, survey date (three categories), region (west versus east), sample size (four categories) and 16 quality assessment items]. The backward stepwise meta‐regression models started with the study characteristics that were associated significantly with heterogeneity in the bivariate analyses listed in the table. Significance level for retention in the final model set at P = 0.10. See Methods for details.
R 2 represents the proportion of between‐study variations associated with the covariates in the final model. CI = confidence interval.
Discussion
The findings of this study should be interpreted in light of the following limitations. First, only 12 of 38 studies were conducted before 2000, so our analysis is not able to provide definitive evidence about the secular trend of AUD in China. Secondly, China is a large country with substantial regional and ethnicity‐based differences in drinking culture, so our dichotomization of the country into two large regions (‘East’ and ‘West’) may have masked potentially important variations in AUD prevalence. Thirdly, due to the limited number of studies available for each outcome, we were only able to conduct sensitivity analyses on seven of the 30 prevalence measures of interest (with 10 or more studies). Also, given the limited number of studies for each outcome, there was insufficient power to consider simultaneously all covariates identified in the bivariate meta‐regression, so we used the stepwise approach for meta‐regression. This limitation (i.e. not considering all covariates simultaneously) may have resulted in exaggerating the strength and the precision of the associations.
Despite these limitations, this report provides a comprehensive picture of the current state of knowledge about the prevalence of AUD in China. Prevalence data are available for the majority of mainland China, but there is considerable heterogeneity in reported prevalence between the studies (I 2 > 90% for most of the outcomes), some of which is associated with variables we identified using meta‐regression. Sample sizes of the 38 included studies varied from 200 to 339 651; larger studies were associated consistently with lower estimated prevalence. Six of the seven studies with sample sizes greater than 50 000 used key informants to identify cases; this method can lead to substantial underestimation, particularly when a single informant serves as the sole interviewee for an entire village or neighborhood (because it was not practical to complete a large 1‐to‐1 survey within a tight time‐frame or budget). These large studies were all ranked as low‐quality studies, suggesting that large sample sizes can be an indicator of perfunctory survey methodology. Another problem is the use of substitutes to replace the selected subjects if the target individual is not available (or unwilling). This is a common method used by researchers in China to achieve high response levels for community‐based surveys, but it can lead to biased estimates, such as the artificially inflated prevalence of alcohol dependence in females seen in our analysis. Our meta‐regression also found that the few studies that provided information about the reasons for non‐participation (quality item 4) had higher prevalence estimates; this item may serve as a proxy for the higher quality surveys which tend to report higher prevalence.
AUD is a major public health problem in China. We found a pooled current prevalence of alcohol dependence of 1.5% and a pooled current prevalence of alcohol abuse of 0.9%; the corresponding estimates for life‐time prevalence were 1.4 and 3.2%. When limiting the analysis to high‐quality studies, the current and life‐time prevalence estimates of alcohol dependence jumped to 2.2 and 3.7%, respectively. These estimates are not too distant from those reported in western countries such as the United States 57, the Netherlands 58 and Australia 59. However, AUD is essentially a male phenomenon in China, so the population‐wide prevalence figures obscure the high prevalence in Chinese men.
Several authors 26, 27, 28, 60 suggest that the high prevalence of specific polymorphisms of the alcohol dehydrogenase (ADH) and aldehyde dehydrogenase (ALDH) genes in Han Chinese—which results in the uncomfortable ‘flushing effect’ after alcohol ingestion—prevents or limits the development of AUD in China. However, drinking behavior and the development of AUD (as in tobacco smoking and other addictive behaviors) is under the combined influence of genetic, psychological and socio‐environmental factors 29. The Chinese drinking culture encourages heavy drinking during social occasions, especially among adult males. In a collective culture such as China 30, social pressure to participate in this form of social exchange can override the genetic predisposition against over‐drinking, leading to a variety of problems including AUD. Given the large and increasing negative effects of heavy drinking, it is time for the Chinese government to collect necessary information systematically to develop and implement policies that will help curtail this preventable loss of years of healthy life.
In this study, we observed consistently large male‐to‐female ratios (MFRs) in the prevalence of AUD (MFR > 10 in 80% of studies). We also observed a consistently increasing prevalence of AUD with age, a finding that is different from that reported in high‐income countries where the highest prevalence of AUD occurs in young adults (i.e. <25 years of age 26, 28, 35). These distinct socio‐demographic characteristics of AUD in China suggest that prevention and intervention strategies developed in high‐income countries may not be directly applicable to China. These observations also provide updated information for revising the GBD estimates of disease burden related to AUD in China. Using data downloaded from the Global Burden of Disease website 32, we graphed sex‐ and age‐specific estimates of disability‐adjusted life years (DALYs) attributed to AUD in China in 2010 (Fig. 4). The MFR based on these GBD estimates was 4.3, which is much lower than observed in this systematic review. The age group pattern reported for China in the 2010 GBD study is also different from our findings: the GBD study estimated AUD‐related loss of DALYs among younger age groups (e.g. 15–25 years) roughly equal to or higher than that of older age groups, while we find a prevalence of close to zero in the 15–19‐year age group in China. These observations suggest that some fine‐tuning of the GBD algorithms for AUD in China will be necessary to produce estimates of disease burden that are more contextually valid.
Figure 4.
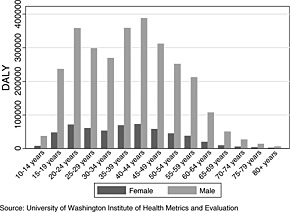
Disability‐adjusted life years (DALY) attributed to alcohol use disorder in China, 2010
The generally low quality of the prevalence studies is concerning. This is, of course, not a problem unique to AUD or to China. However, addressing national problems of this magnitude requires committing sufficient resources to the development of standardized, real‐time monitoring systems that are flexible enough to respond to the changing course of diseases as economic and social changes transform nations. As a leader among the low‐ and middle‐income countries that aims to optimize the allocation of limited resources for health, the time has come for China to adopt a more rigorous approach to the conduct and evaluation of the many large‐scale epidemiological studies conducted in the country.
Declaration of interests
None.
Supporting information
Supporting info item
Acknowledgements
The current analysis was funded by the China Medical Board (grant number 13‐165).
Cheng, H. G. , Deng, F. , Xiong, W. , and Phillips, M. R. (2015), Prevalence of alcohol use disorders in mainland China: a systematic review. Addiction, 110: 761–774. doi: 10.1111/add.12876.
References
- 1. Lim S. S., Vos T., Flaxman A. D., Danaei G., Shibuya K., Adair‐Rohani H. et al A comparative risk assessment of burden of disease and injury attributable to 67 risk factors and risk factor clusters in 21 regions, 1990–2010: a systematic analysis for the Global Burden of Disease Study 2010. Lancet 2012; 380: 2224–60. [DOI] [PMC free article] [PubMed] [Google Scholar]
- 2. Yang G., Wang Y., Zeng Y., Gao G. F., Liang X., Zhou M. et al Rapid health transition in China, 1990–2010: findings from the Global Burden of Disease Study 2010. Lancet 2013; 381: 1987–2015. [DOI] [PMC free article] [PubMed] [Google Scholar]
- 3. Cochrane J., Chen H., Conigrave K. M., Hao W. Alcohol use in China. Alcohol Alcohol 2003; 38: 537–42. [DOI] [PubMed] [Google Scholar]
- 4. Hao W., Su Z., Liu B., Zhang K., Yang H., Chen S. et al Drinking and drinking patterns and health status in the general population of five areas of China. Alcohol Alcohol 2004; 39: 43–52. [DOI] [PubMed] [Google Scholar]
- 5. Phillips M. R., Zhang J., Shi Q., Song Z., Ding Z., Pang S. et al Prevalence, treatment, and associated disability of mental disorders in four provinces in China during 2001–05: an epidemiological survey. Lancet 2009; 373: 2041–53. [DOI] [PubMed] [Google Scholar]
- 6. Xiang Y. T., Ma X., Lu J. Y., Cai Z. J., Li S. R., Xiang Y. Q. et al Alcohol‐related disorders in Beijing. China: prevalence, socio‐demographic correlates, and unmet need for treatment. Alcohol Clin Exp Res 2009; 33: 1111–18. [DOI] [PubMed] [Google Scholar]
- 7. Zhou L., Conner K. R., Phillips M. R., Caine E. D., Xiao S., Zhang R. et al Epidemiology of alcohol abuse and dependence in rural Chinese men. Alcohol Clin Exp Res 2009; 33: 1770–6. [DOI] [PMC free article] [PubMed] [Google Scholar]
- 8. World Health Organization (WHO) . Levels of Consumption: Recorded Alcohol Per Capita Consumption from 1990‐Data by Country. Geneva: WHO; 2013. [Google Scholar]
- 9. von Elm E., Altman D. G., Egger M., Pocock S. J., Gotzsche P. C., Vandenbroucke J. P. The Strengthening the Reporting of Observational Studies in Epidemiology (STROBE) statement: guidelines for reporting observational studies. Lancet 2007; 370: 1453–7. [DOI] [PubMed] [Google Scholar]
- 10. Wong W. C., Cheung C. S., Hart G. J. Development of a quality assessment tool for systematic reviews of observational studies (QATSO) of HIV prevalence in men having sex with men and associated risk behaviours. Emerg Themes Epidemiol 2008; 5: 23. [DOI] [PMC free article] [PubMed] [Google Scholar]
- 11. Slim K., Nini E., Forestier D., Kwiatkowski F., Panis Y., Chipponi J. Methodological index for non‐randomized studies (minors): development and validation of a new instrument. Aust NZ J Surg 2003; 73: 712–16. [DOI] [PubMed] [Google Scholar]
- 12. DerSimonian R., Laird N. Meta‐analysis in clinical trials. Control Clin Trials 1986; 7: 177–88. [DOI] [PubMed] [Google Scholar]
- 13. Kontopantelis E., Reeves D. Performance of statistical methods for meta‐analysis when true study effects are non‐normally distributed: a simulation study. Stat Methods Med Res 2012; 21: 409–26. [DOI] [PubMed] [Google Scholar]
- 14. Freeman M. F., Tukey J. W. Transformations related to the angular and the square root. Ann Math Stat 1950; 21: 607–1. [Google Scholar]
- 15. Lee S., Tsang A., Zhang M. Y., Huang Y. Q., He Y. L., Liu Z. R. et al Lifetime prevalence and inter‐cohort variation in DSM‐IV disorders in metropolitan China. Psychol Med 2007; 37: 61–71. [DOI] [PMC free article] [PubMed] [Google Scholar]
- 16. Li K., Cui Z., Cui L., Jiang Q., Shi G., Wu H. et al Epidemiological survey of mental disorders in the people aged 18 and older in Hebei Province. Asian J Psychiatry 2008; 1: 51–5. [DOI] [PubMed] [Google Scholar]
- 17. Higgins J. P., Thompson S. G., Deeks J. J., Altman D. G. Measuring inconsistency in meta‐analyses. BMJ 2003; 327: 557–60. [DOI] [PMC free article] [PubMed] [Google Scholar]
- 18. Egger M., Davey S. G., Schneider M., Minder C. Bias in meta‐analysis detected by a simple, graphical test, BMJ 1997; 315: 629–34. [DOI] [PMC free article] [PubMed] [Google Scholar]
- 19. Cappelleri J. C., Ioannidis J. P., Schmid C. H., de Ferranti S. D., Aubert M., Chalmers T. C. et al Large trials vs meta‐analysis of smaller trials: how do their results compare? JAMA 1996; 276: 1332–8. [PubMed] [Google Scholar]
- 20. Stuck A. E., Siu A. L., Wieland G. D., Adams J., Rubenstein L. Z. Comprehensive geriatric assessment: a meta‐analysis of controlled trials. Lancet 1993; 342: 1032–6. [DOI] [PubMed] [Google Scholar]
- 21. Chen Q., Wang J., Liu Q., Li Y., Xie S., Huang Y., Xu J. Cross‐sectional study of alcohol use disorder in Dalian, China. Chin J Public Health 2012; 28: 614–15. [Google Scholar]
- 22. Namkoong K., Lee H. Y., Lee M. H., Lee B. Y., Lee D. G. Cross‐cultural study of alcoholism: comparison between Kangwha, Korea and Yanbian, China. Yonsei Med J 1991; 32: 319–25. [DOI] [PubMed] [Google Scholar]
- 23. Yang J., Ruan Y., Huang Y., Luo C., Yao J., Gao C., Lu J. Study on tobacco and alcohol induced mental disorders among residents aged over 15 in Kunming city in 2005. Prev Med Trib 2009; 15: 490–2 [in Chinese]. [Google Scholar]
- 24. Liu Z., Zhang J., Weng Z. A ten year survey of patients with dependence on alcohol in Shandong Province. Chin J Behav Med Sci 1999; 8: 293–5 [in Chinese]. [Google Scholar]
- 25. Zhang J., He W., Yan W., Gan J., Shi Y. Study on the prevalence of mental diseases in Shaoxing city between 1991 and 2001. Chin J Epidemiol 2003; 24: 585–7 [in Chinese]. [PubMed] [Google Scholar]
- 26. Thomasson H. R., Edenberg H. J., Crabb D. W., Mai X. L., Jerome R. E., Li T. K. et al Alcohol and aldehyde dehydrogenase genotypes and alcoholism in Chinese men. Am J Hum Genet 1991; 48: 677–81. [PMC free article] [PubMed] [Google Scholar]
- 27. Higuchi S., Matsushita S., Muramatsu T., Murayama M., Hayashida M. Alcohol and aldehyde dehydrogenase genotypes and drinking behavior in Japanese. Alcohol Clin Exp Res 1996; 20: 493–7. [DOI] [PubMed] [Google Scholar]
- 28. Muramatsu T., Wang Z. C., Fang Y. R., Hu K. B., Yan H., Yamada K. et al Alcohol and aldehyde dehydrogenase genotypes and drinking behavior of Chinese living in Shanghai. Hum Genet 1995; 96: 151–4. [DOI] [PubMed] [Google Scholar]
- 29. Davies S. C., Winpenny E., Ball S., Fowler T., Rubin J., Nolte E. For debate: a new wave in public health improvement. Lancet 2014; 384(9957): 1889–95. [DOI] [PubMed] [Google Scholar]
- 30. Lim L. L., Chang W. C. Role of collective self‐esteem on youth violence in a collective culture. Int J Psychol/J Int de Psychol 2009; 44: 71–8. [DOI] [PubMed] [Google Scholar]
- 31. Kawakami N., Takeshima T., Ono Y., Uda H., Hata Y., Nakane Y. et al Twelve‐month prevalence, severity, and treatment of common mental disorders in communities in Japan: preliminary finding from the World Mental Health Japan Survey 2002–2003. Psychiatry Clin Neurosci 2005; 59: 441–52. [DOI] [PubMed] [Google Scholar]
- 32. Global Burden of Disease (GBD) Project . GBD data 2010. Available at: http://www.healthdata.org/gbd/data (accessed 18 November 2014) (Archived by WebCite® at http://www.webcitation.org/6UBsloTKb on 18 November 2014.)
- 33. Gao Z. The epidemiological survey of mental disorders in Wei County, Zhangjiakou area. Zhongguo Yi Xue Ke Xue Yuan Xue Bao 1987; 4: 64–6 [in Chinese]. [Google Scholar]
- 34. Wang X. The survey of mental illnesses in the moutainous areas and subsurbs of Ruian City. Zhonghua Xin Xue Guan Bing Za Zhi 2007; 14: 62 [in Chinese]. [Google Scholar]
- 35. Wang Y., Cai J., Gu X. The epidemiological study of mental disorders in rural Tongzhou. Jiangsu Yu Fang Yi Xue 2003; 14: 15–16 [in Chinese]. [Google Scholar]
- 36. Zhang X. The survey report of alcohol use in Pinggu district. Ji Ceng Yi Xue Lun Tan 2007; 11: 311–12 [in Chinese]. [Google Scholar]
- 37. Kang M., Lu B., Xie J., Li J., Chen N., Cai Z. The epidemiological survey of alcohol dependence and related issues in Huaiyin, Jiangsu, where it is known for alcohol production. Chin Mental Health J 1992; 6: 118–19 [in Chinese]. [Google Scholar]
- 38. Yang X., Jiang C., Fu Z., Yu Q., Yu C., Yan T. et al Alcohol use disorder and its influence factors among residents in Liaoning province. Chin J Public Health 2011; 27: 935–7 [in Chinese]. [Google Scholar]
- 39. Zhu X., Wan C., Lan S., Chen J. The epidemiological survey of mental illnesses in Yichun city, Jiangxi province. Chin J Epidemiol 2004; 25: 526 [in Chinese]. [Google Scholar]
- 40. Zhou Y., He K., Chen Y., Liu W., Lin Y., Jia F. et al The epidemiological survey of mental disorders in Yangqiao town of Huizhou. Med J Chin People's Health 2013; 25: 27–9 [in Chinese]. [Google Scholar]
- 41. Hao W., Li L., Xiao S., Yang D., Tu J., Zeng H. The epidemiological investigation of psychoactive substance use in two communities in Hunan province. Chin J Mental Health 1994; 8: 241–4 [in Chinese]. [Google Scholar]
- 42. Hu J., Li Z., Chen Y., Zhou X., Ma Y., Huang H. The epidemiological survey of mental illnesses in Zhongshan city, Guangdong. Chin J Nerv Mental Dis 2002; 28: 456–8 [in Chinese]. [Google Scholar]
- 43. Jia L., Zhang D., Luo H., Zhou C., Wang L., Ouyang X. et al An epidemiological investigation of alcohol dependence in Guiyang, Anshun and Bijie of Guizhou province. Chin J Mod Drug Appl 2009; 3: 209–10 [in Chinese]. [Google Scholar]
- 44. Zhang M., Yuan G., Mao J., Yao J., Chu X., Qian Y. et al Epidemiological features of the prevalence rates of various mental disorders and their related factors in Wuxi city: a cross‐sectional survey. Chin J Clin Rehab 2004; 8: 4950–2 [in Chinese]. [Google Scholar]
- 45. Li J., Zhang H., Hu M., Xu J., Huang M., Sun Q. et al Wenchuan earthquake victims in alcohol dependence and analysis of the results of flow transfer. Med J Chin People Health 2010; 22: 9–11 [in Chinese]. [Google Scholar]
- 46. Wei B., Chen Q., Feng Q., Pan R., Chen Q., Huang G. et al Epidemiological survey on mental disorders in urban and rural in Guangxi Zhuang autonomous region, China. J Guangxi Med Univ 2010; 27: 951–6 [in Chinese]. [Google Scholar]
- 47. Gong Z., Zhang K., Zhang C., Liu X., Cao C., Liang Y. et al Epidemiological survey on alcohol dependence in Weihai city, Shandong Province. Chin J Drug Abuse Prev Treat 2008; 14: 207–9 [in Chinese]. [Google Scholar]
- 48. Zhang M., Ye S., Xu S. The epidemiological survey of alcohol abuse among fishers in Songmen, Wenling city. Zhe Jiang J Prev Med 1995; 7: 12–15 [in Chinese]. [Google Scholar]
- 49. Yu J., Chang X., Liang G., Wan X. An epidemiological study of psychoactive substance usein Zhenjiang City. J Clin Psychiatry 1996; 6: 71–3 [in Chinese]. [Google Scholar]
- 50. Wei H., Derson Y., Xiao S., Li L., Zhang Y. Alcohol consumption and alcohol‐related problems: Chinese experience from six area samples, 1994. Addiction 1999; 94: 1467–76. [DOI] [PubMed] [Google Scholar]
- 51. Wang L., Zhu Z., Li Z. An epidemiological research of alcohol dependence and its related factors. Chin Bull Drug Depend 1994; 3: 22–9 [in Chinese]. [Google Scholar]
- 52. Wang Y., Heng K., Luo M., Li P. An analysis of relative factors for patients with alcoholic dependence in the Panzihua city. Sichuan Mental Health 2001; 14: 36–8 [in Chinese]. [Google Scholar]
- 53. Jia L. Zhang D., Zhou C., Wang L., Luo H., Wu A. et al A epidemiological investigation of alcohol dependence in partial area of Guizhou Province. Guizhou Med J 2002; 26: 1078–9 [in Chinese]. [Google Scholar]
- 54. Guo W. Alcohol Consumption and Alcohol‐Related Mental Health Problem: an Analysis for the Investigation in Jinuo Nationality Area, The First Affliated Hospital of Kunming Medical University Kunming: Kunming Medical University; 2003, p. 80 [in Chinese].
- 55. Wang M. The epidemiological analysis and intervention study in the prevention, treatment and rehabilitation of mental disorders. Guide China Med 2012; 10: 79–80 [in Chinese]. [Google Scholar]
- 56. Zhang W., Shen Y., Li S., Chen C., Huang Y., Wang J. Epidemiological investigation on mental disorders in 7 areas of China. Chin J Psychiatry 1998; 31: 69–71 [in Chinese]. [Google Scholar]
- 57. Hasin D. S., Stinson F. S., Ogburn E., Grant B. F. Prevalence, correlates, disability, and comorbidity of DSM‐IV alcohol abuse and dependence in the United States: results from the National Epidemiologic Survey on Alcohol and Related Conditions. Arch Gen Psychiatry 2007; 64: 830–42. [DOI] [PubMed] [Google Scholar]
- 58. Bijl R. V., Ravelli A., van Zessen G. Prevalence of psychiatric disorder in the general population: results of the Netherlands Mental Health Survey and Incidence Study (NEMESIS). Soc Psychiatry Psychiatr Epidemiol 1998; 33: 587–95. [DOI] [PubMed] [Google Scholar]
- 59. Teesson M., Hall W., Slade T., Mills K., Grove R., Mewton L. et al Prevalence and correlates of DSM‐IV alcohol abuse and dependence in Australia: findings of the 2007 National Survey of Mental Health and Wellbeing. Addiction 2010; 105: 2085–94. [DOI] [PubMed] [Google Scholar]
- 60. Goedde H. W., Agarwal D. P., Fritze G., Meier‐Tackmann D., Singh S., Beckmann G. et al Distribution of ADH2 and ALDH2 genotypes in different populations. Hum Genet 1992; 88: 344–6. [DOI] [PubMed] [Google Scholar]
- 61. Li L. Survey on Alcohol Dependence Prevalence for Rural Residents in Dongying City. Jinan, China: Social Medicine and Health Service Management, Shandong University; 2011, p. 46 [in Chinese]. [Google Scholar]
- 62. Tang W. Liu Q., Wen X., Zhang C., Yan L., Zhang B. et al Epidemiological survey on mental disorders in Wenzhou areas. Shanghai Arch Psychiatry 2005; 17: 197–9 [in Chinese]. [Google Scholar]
- 63. A H L., Gong Y., Wang Y., Huang S. A survey of alcohol use and alcohol dependence in a Bai minority township. J Clin Psychiatry 2006; 17: 1 [in Chinese]. [Google Scholar]
- 64. Liu S., Wei G., Zhang W., Xiang Y., Huang X., Yang C. et al Epidemiological survey on neuropsychiatric disorders in Tibet of China: neuroses, alcohol‐related disorders, mental retardation and epilepsy. J Sichuan Univ (Med Sci) 2012; 43: 4. [PubMed] [Google Scholar]
Associated Data
This section collects any data citations, data availability statements, or supplementary materials included in this article.
Supplementary Materials
Supporting info item