Figure 7.
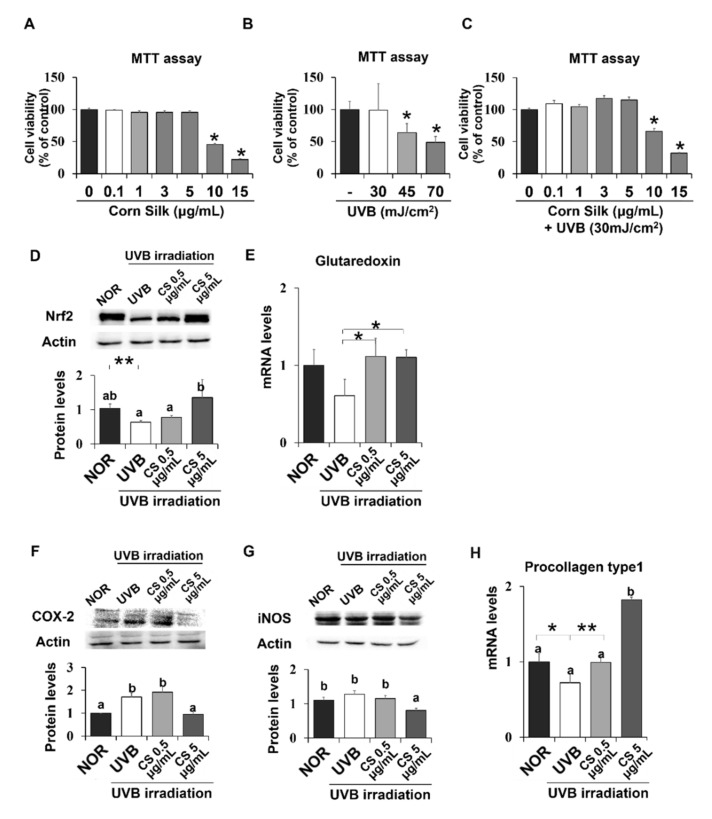
Viability of CS- or UVB treated HaCaT cells and CS effect on antioxidant and anti-inflammatory gene expressions in HaCaT cells. MTT assays showed the viability of HaCaT cells after exposure to either CS extract (A), only UVB (B), or both UVB and CS extract treatment (C). Protein levels of Nrf2 (D) were analyzed by Western blot and the representative images of the blot (three repetitions) are shown. Protein levels of COX-2 (F) and iNOS (G) were analyzed by Western blot and the blot images represent three repetitions. mRNA levels of Glutaredoxin (E), a target of Nrf2, and procollagen type 1 (H) was analyzed by qPCR and normalized to GAPDH. Results are mean ± SE. Different lowercase letters (a, b) represent statistical difference, as analyzed by ANOVA (p < 0.05). * p < 0.05, ** p < 0.01, student t-test.

