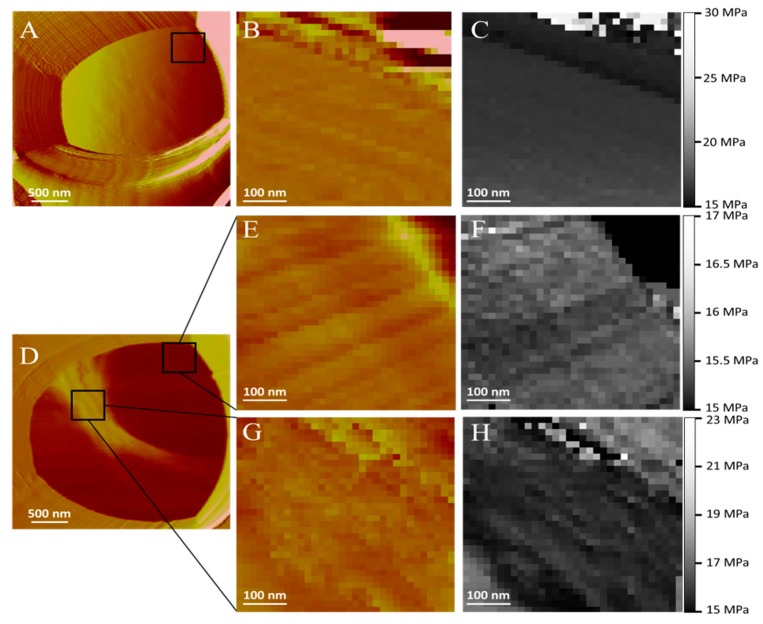
Figure 8.
Effect of AmB-gel on C. albicans cells. (A) Deflection image of a single yeast cell trapped in a pore. (B) Topographic map zoom image of a single yeast cell trapped in a pore. (C) Elasticity map zoom image of a single yeast cell trapped in a pore. (D) A reddish region (low region) that covers almost the 80% of the cell surface and a yellowish arched band (high region) crossing the surface from top-left to center-right of the cell surface. (E) Topographic map zoom image of the low region. (F) Elasticity map zoom image of the low region. (G) Topographic map zoom image of the high region. (H) Elasticity map zoom image of the high region.

