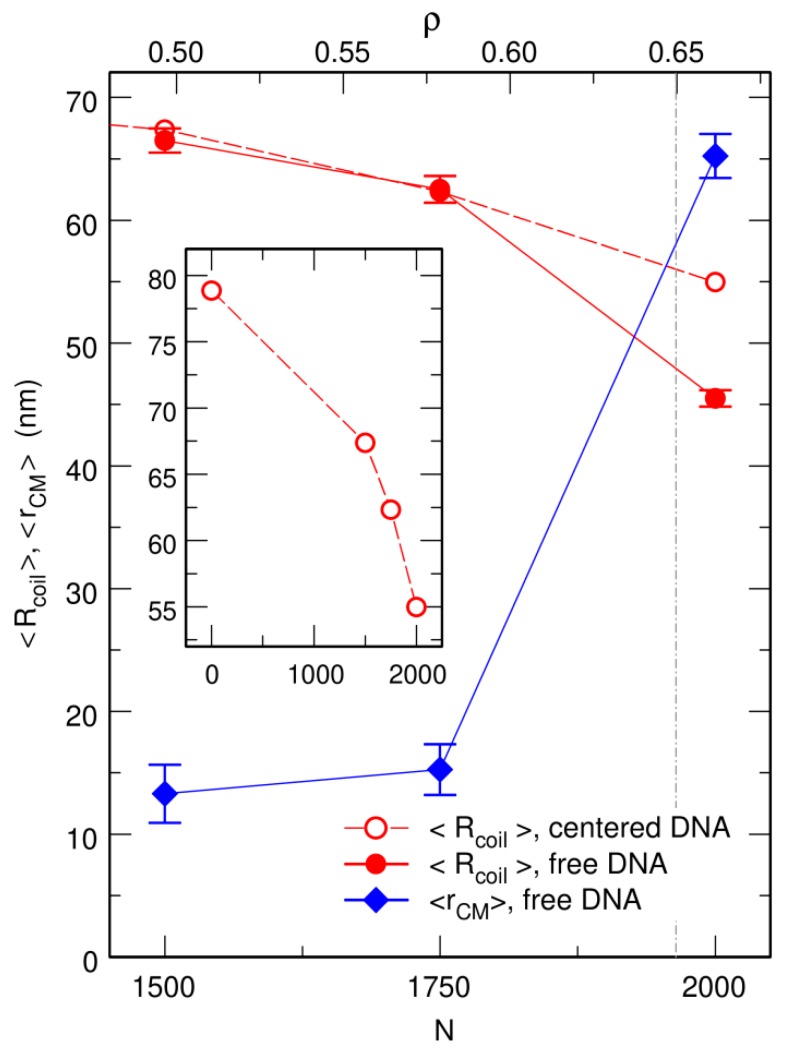
Figure 3.
Plot, as a function of the number N of spherical crowders (lower x axis) or the effective crowder volume fraction ρ (upper x axis), of the mean radius of the DNA coil, (circles), and the mean distance from its center of mass to the center of the confinement sphere, (lozenges). Empty circles correspond to the case where the center of the confinement sphere was repositioned on top of the center of mass of the DNA chain after each integration time step, and filled circles to the case where the centering step was omitted. The inset shows the plot of over a broader range of values of N, in order to highlight the abrupt decrease close to the jamming threshold. and are expressed in units of nm. The vertical dot-dashed line at denotes the approximate location of the jamming threshold.

