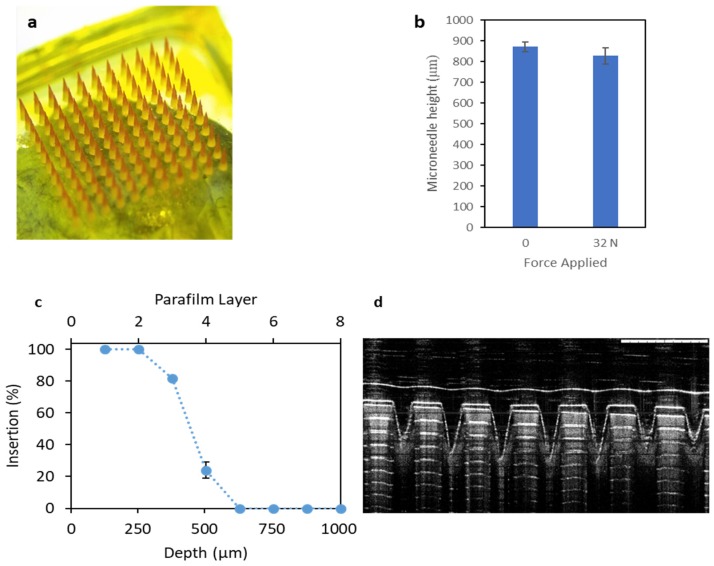
Figure 6.
(a) Panoramic light microscope image of CU-MN; (b) CU-MN height before and after application of 32 N force for 30 s (means + S.D., n = 3); (c) insertion depth and number of Parafilm M® layers perforated during CU-MN application (means ± S.D., n = 3) and (d) optimal cutting temperature (OCT) image of perforated Parafilm M® after CU-MN application (Scale bar = 1 mm).

