

Abstract
Objective
Discrimination reported by mental health service users in England is high. The study aims to determine changes in mental health‐related discrimination from 2008 to 2014.
Methods
Samples of mental health service users were interviewed from 2008 to 2014 using the Discrimination and Stigma Scale version 12. Social capital in terms of access to social resources is a marker of discrimination in terms of effects on social connections, and so from 2011, social capital also measured using the Resource Generator‐UK.
Results
Fewer participants reported discrimination in one or more life areas in 2014 compared to 2008 (OR: 0.58, 95% CI 0.36 to 0.94 P = 0.03). A weighted multiple regression model found a decrease in overall discrimination in 2014 compared to 2008 (mean difference: −13.55, 95% CI: −17.32 to −9.78, P < 0.001). There was not a consistent in discrimination decline between each year. No differences in access to social resources were found.
Conclusions
Discrimination has fallen significantly over 2008–2014, although there was not a consistent decline between years. There is no evidence that social capital has increased.
Keywords: discrimination, social capital, evaluation research
Significant outcomes.
Fall in percentage of participants reporting mental health‐related discrimination in one or more life areas between 2008 and 2014.
Fall in overall levels of mental health‐related discrimination between 2008 and 2014.
Limitations.
Low response rate across all years.
Change cannot be attributed directly to the Time to Change programme.
Introduction
Stigma and discrimination can severely exacerbate the difficulties facing people with mental health problems 1, 2, 3. In England, despite greater understanding about the causes of mental illness 4, public attitudes towards people with mental health problems deteriorated in the ten years prior to 2003 4. However, initiatives such as ‘Open the Doors’ launched by the World Psychiatric Association to reduce discrimination and stigma associated with schizophrenia have shown positive results in terms of decreasing social distance 5.
Between 2008 and 2011, the charities Mind and Rethink Mental Illness ran the first phase of Time to Change (TTC) (http://www.time-to-change.org.uk/), the largest ever programme in England to reduce stigma and discrimination against people with mental health problems 6. TTC subsequently secured funding from the Department of Health in England and Comic Relief for a second phase, running 2011–2015. The evaluation of TTC was the first to measure discriminatory behaviour nationally, as reported by service users using an annual ‘Viewpoint’ survey 7, 8. The Department of Health in England used this as an indicator to monitor the effect of one of the six policy objectives stated in: ‘No Health Without Mental Health’, namely ‘fewer people will experience stigma and discrimination’ 9. Over the first phase of TTC, there was a significant reduction in overall levels of discrimination, including significant reductions in discrimination from friends, family members and social life 7, 8. However, some of these gains appear to have been eroded by 2011, the end of the first year of Phase 2 of TTC 10.
Stigma may also have an impact on a person's access to social capital 11, through reduced social contact 12. Social capital is a multidimensional construct encompassing elements such as trust 13, ‘social norms’ 14 and the resources embedded within social networks 15, 16. These resources are accessible to individuals through reciprocal relationships 15, 17.
The aims of this study were to determine changes in discrimination levels, overall and by life area, throughout the duration of TTC (2008–14); TTC phase 2 (2011–2014); and over the most recent year (2013–14). An additional aim was to assess changes over TTC Phase 2 in social capital, using a measure added since 2011.
Material and methods
Design
This study consisted of a cross‐sectional survey. Invitation packs containing information about the study, local and national sources of support and a consent form were mailed to potential participants from the trusts (8917 in 2008; 12 887 in 2009; 12 866 in 2010; 9120 in 2011; 9894 in 2012; 9599 in 2013; and 10 983 in 2014). After 2008, information was also included in 13 commonly spoken languages explaining how to obtain the information pack in another language. A reminder letter was mailed to non‐responders after approximately two weeks. Participants mailed written consent forms, including contact details, directly to the research team. An interviewer contacted the participant by telephone after this form was received. Participants in 2011–2014 were offered a £10 voucher for taking part in the survey.
Telephone interview surveys were carried out annually between 2008 (baseline) and 2014. Different samples were used each year, recruited through National Health Service (NHS) Mental Health trusts (service provider organisations).
Setting
Each year, five NHS mental health trusts across England were recruited, with the aim of covering a population representative of England. Selected trusts covered different geographical regions of England and areas in each quintile of socio‐economic deprivation 18.
Participants
Inclusion criteria were aged 18–65, any mental illness diagnosis (excluding dementia), and been in recent receipt (i.e. within the last six months) of specialist mental health services. We excluded people who were not currently living in the community (e.g. in hospital) because participants were taking part in a sensitive, confidential telephone survey. Our target sample size was 1000 individual interviews each year, based on a sample size calculation to detect a five per cent change in the proportion reporting any vs. no discrimination experiences 7.
Within each participating trust, non‐clinical staff used their central patient database to select a random sample of persons receiving care for ongoing mental health problems. This was achieved by running a computer programme, which may have varied by Trust, ensuring that all eligible persons had an equal chance of being selected. In 2008, we selected 2000 out‐patients per trust based on a predicted response rate of 25% as achieved for the charity Rethink Mental Illness membership surveys. From 2009–2014, we selected up to 4000 out‐patients per trust to ensure we met the target sample after missing this in 2008. The sample was checked by clinical care teams to confirm eligibility and remove those judged to be at risk of distress from receiving an invitation pack; for example, people are currently relapsing or experiencing stressful situations 19.
The data collection team were members of the public who responded to an advertisements placed on service user notice boards and in a national newspaper. Over the course of the study, around 80% of interviewers were or had been mental health service users or carers. The interviewer's were trained and supervised by the research team. Participants were allocated to interviewers according to availability. Once an interviewer made contact with a participant, an interview was conducted or scheduled. If, after three scheduled appointments, an interview had not been successfully completed, the participant was considered to have withdrawn. Consent was re‐confirmed verbally by the interviewer prior to the start of the interview.
Measures
The Discrimination and Stigma Scale 12 (DISC‐12) was used to measure experienced and anticipated discrimination 20. The DISC‐12 is interviewer‐administered and contains 22 items on mental health‐related experiences of discrimination, covering 21 life areas, plus one for ‘other’ experience; and four items concerning anticipated discrimination. All responses are given on a four‐point scale from ‘not at all’ to ‘a lot’, higher scores indicate more discrimination. Where items related to situations which were not relevant to the participant in the previous 12 months (e.g. in relation to having children), or if a diagnosis could not have been known about, a ‘not applicable’ option was used. Analysis of the DISC‐12 has found that it has good psychometric properties 20.
The Resource Generator‐UK (RG‐UK) 17 was used to measure participants’ access to social capital in 2011–2014. In the tradition of social network measures such as the Name Generator 21 and Position Generator 22, this instrument measures participants’ access to resources within their social network. The RG‐UK was adapted from a version developed in the Netherlands 23, and its items have been validated for use in the UK. It has good reliability and validity 17 and has been used in samples of people with mental health problems, for example 12, 17, 24, 25 producing valid results.
The RG‐UK asks participants if they could obtain access to 27 skills or resources within their social network within one week. If they respond ‘yes’ to an item, they are asked to indicate the nature of the social tie through which they could access each skill or resource. The instrument has four subscales: domestic resources, personal skills, expert advice and problem‐solving resources. The mean score in a general population sample has been found to be 17.24 17, providing a benchmark for other samples. Sociodemographic and clinical characteristics were also obtained from the sample.
Statistical analysis
Analysis was carried out using SPSS (version 20, Armonk, NY) and STATA (version 11, Texas, USA). Overall experienced discrimination scores were calculated by counting any reported instance of discrimination as ‘1’ and situations in which no discrimination was reported as ‘0’. The overall score was then calculated as sum of reported discrimination divided by the number of questions answered (only applicable answers were included) and multiplied by 100, giving a percentage of items in which discrimination was reported. For example, if a participant reported discrimination for 13 of the 22 items and reported that four items were not applicable, the overall score would be 13/(22‐4)*100 = 72%. To compare the 2008–2014 samples for frequencies of experiences from each source of discrimination (i.e. each DISC item), a binary variable, ‘no discrimination’ vs. ‘any discrimination’ was created for each DISC item (‘not applicable’ responses were coded as ‘no discrimination’). In 2008, three items were used to measure anticipated discrimination. One was split into two items from 2009; we therefore only compared the two items common to all years. Items were compared using a binary variable, ‘no anticipated discrimination’ vs. ‘any anticipated discrimination’. RG‐UK total and subscale scores were calculated by scoring items accessible within a participant's network as 1 and those not accessible as 0, and summing to calculate scale totals.
Each annual sample was compared to population level data made available by the NHS Information Centre 26 for characteristics on which good NHS data were available, that is gender, age and ethnicity. Inverse probability weights were created based on these characteristics to weight observations for demographic disparities between the sample and the population.
Chi‐squared tests found differences between ethnicity, employment status and diagnosis between years, and analyses were therefore adjusted for these factors. The Bonferroni correction method was used to maintain the familywise type I error at 0.05 due to multiple testing.
A multivariable logistic regression model for report of one or more experiences of discrimination was performed to test for significant differences by study year, weighted to match the study population and included employment status and diagnosis as potential confounding factors.
The study received approval from Riverside NHS Ethics Committee 07/H0706/72.
Results
We interviewed a total of 6470 participants between 2008 and 2014. For details of participant characteristics, see Table 1. Response rates for completed interviews were 6% in 2008, 7% in 2009, 8% in 2010, 11% in 2011, 10% in 2012, 10% in 2013 and 8% in 2014. In all years, women and White British participants were over‐represented in the sample compared with data available from the NHS Information Centre 26.
Table 1.
Demographic characteristics of participants
| Characteristic | 2008 (n = 537) | 2009 (n = 1047) | 2010 (n = 979) | 2011 (n = 1016) | 2012 (n = 1004) | 2013 (n = 385) | 2014 (n = 902) |
|---|---|---|---|---|---|---|---|
| Gender, n (%) | |||||||
| Male | 188 (35) | 389 (37) | 369 (38) | 411 (40.5) | 387 (38.5) | 365 (37.1) | 306 (33.9) |
| Female | 344 (64) | 654 (63) | 605 (62) | 602 (59.3) | 617 (61.5) | 616 (62.5) | 595 (66.0) |
| Transgender | 0 (0) | 3 (0.3) | 5 (0.5) | 2 (0.2) | 0 (0) | 4 (0.4) | 1 (0.1) |
| Age (years), mean (SD) | 46 (11) | 46 (11) | 46 (11) | 45 (11) | 44 (11) | 44 (11) | 44 (11.8) |
| Ethnicity, n (%) | |||||||
| White | 515 (98) | 955 (92) | 918 (94) | 904 (90) | 898 (90) | 886 (90) | 833 (92.4) |
| Non‐White | 11 (2) | 81 (8) | 57 (6) | 105 (10) | 101 (10) | 99 (9.9) | 69 (7.6) |
| Employment status, n (%) | |||||||
| Employed | 147 (27) | 282 (27) | 298 (24) | 239 (24) | 222 (22) | 207 (21) | 265 (29.4) |
| Studying/Training/Volunteering/ Other | 56 (10) | 305 (29) | 224 (23) | 196 (19) | 238 (24) | 121 (21) | 184 (20.4) |
| Unemployed | 264 (49) | 355 (34) | 370 (38) | 485 (48) | 478 (48) | 582 (59) | 377 (41.8) |
| Retired | 70 (13) | 104 (10) | 85 (9) | 95 (9) | 64 (6) | 75 (8) | 74 (8.2) |
| Clinical Diagnosis, n (%) | |||||||
| Anxiety disorders | 36 (8) | 59 (6) | 57 (6) | 832 (9) | 86 (9) | 130 (13) | 133 (14.7) |
| Bipolar disorder | 147 (32) | 257 (26) | 194 (21) | 184 (20) | 218 (24) | 181 (18) | 151 (16.7) |
| Depression | 137 (29) | 291 (30) | 331 (36) | 331 (34) | 257 (28) | 265 (27) | 226 (25.1) |
| Personality disorders | 20 (4) | 60 (6) | 41 (5) | 55 (6) | 71 (8) | 98 (10) | 105 (11.6) |
| Schizophrenia and schizoaffective disorder | 75 (16) | 169 (17) | 137 (15) | 142 (16) | 200 (22) | 158 (16) | 110 (12.2) |
| Other | 51 (11) | 142 (15) | 147 (16) | 131 (14) | 85 (9) | 40 (4) | 22 (2.4) |
| Received involuntary treatment, n (%) | |||||||
| Yes | 212 (40) | 418 (40) | 309 (32) | 353 (35) | 424 (42.4) | 343 (35) | 298 (33.0) |
| No | 325 (60) | 628 (60) | 668 (68) | 663 (65) | 577 (57.5) | 636 (65) | 602 (66.7) |
Experienced discrimination
Weighted percentages of participants, reporting one or more experiences of discrimination for years 2008 to 2014, were 92.3%, 86.2%, 87.2%, 88.8%, 90.8%, 91.5% and 86.7%. Evidence was found for a difference in 2014 as compared to 2008 (OR: 0.58, 95% CI 0.36 to 0.94 P = 0.03), showing that fewer participants reported discrimination in one or more life areas in 2014 compared to 2008. However, there was not a cumulative decline year on year in reports of discrimination.
The weighted median number of life areas in which participants reported discrimination was 5.7 in 2008, compared to 4.1 by 2014, see Table 2. A weighted multiple regression model provided evidence of a smaller mean number of life areas in 2014 as compared to 2008 (mean difference: −1.71, 95% CI: −2.24 to −1.19, P < 0.001), 2011 (mean difference: −0.80, 95% CI −1.21 to −0.39, P < 0.001) and 2013 (mean difference: −0.61, 95% CI: −1.02 to −0.22, P = 0.003). Again, a cumulative decline year on year was not found.
Table 2.
Experienced discrimination, anticipated discrimination and social capital: 2008–2013, 2011–2013 and 2012–2013
| Weighted descriptivesa | 2008 to 2014b | 2011 to 2014b | 2013 to 2014b | ||||||||
|---|---|---|---|---|---|---|---|---|---|---|---|
| 2008 | 2011 | 2012 | 2013 | 2014 | Estimate (95% CI) | P | Estimate (95% CI) | P | Estimate (95% CI) | P | |
| Experienced discriminationa | |||||||||||
| Number of life areas | 5.7 | 4.9 | 5.4 | 4.7 | 4.1 | −1.71 (−2.24 to −1.19) | 0.001 | −0.80 (−1.21 to −0.39) | 0.00 | −0.61 (−1.02 to −0.21) | 0.003 |
| Overall discrimination score | 41.6 | 31.7 | 34.3 | 32.3 | 28.4 | −13.55 (−17.32 to −9.78) | 0.00 | −2.84 (−5.48 to −0.10) | 0.04 | −3.70 (−6.46 to −0.94) | 0.01 |
| Anticipated discrimination | |||||||||||
| Concealed MH from others | |||||||||||
| (Yes vs. No) § (%) | 72.9 | 70.5 | 77.0 | 70.3 | 74.0 | 1.07 (0.69 to 1.67) | 0.76 | 1.08 (0.78 to 1.49) | 0.64 | 1.15 (0.84 to 1.58) | 0.39 |
| Stopped from having close personal relationship (Yes vs. No) § (%) | 49.2 | 50.4 | 53.1 | 50.1 | 46.7 | 0.84 (0.59 to 1.20) | 0.34 | 0.79 (0.61 to 1.02) | 0.07 | 0.77 (0.60 to 0.99) | 0.04 |
| Social capital | |||||||||||
| RG‐UK total score | n/a | 14.0 | 13.5 | 13.0 | 13.9 | n/a | −0.14 (−0.83 to 0.54) | 0.68 | 0.63 (−0.01 to 1.27) | 0.05 | |
| RG‐UK factor: domestic | n/a | 4.0 | 3.9 | 3.8 | 4.1 | n/a | −0.19 (−0.43 to 0.05) | 0.12 | 0.21 (−0.03 to 0.44) | 0.08 | |
| RG‐UK factor: expert | n/a | 4.2 | 4.1 | 3.9 | 4.1 | n/a | −0.38 (−0.65 to −0.11) | 0.01 | 0.05 (−0.21 to 0.31) | 0.73 | |
| RG‐UK factor: skills | n/a | 2.8 | 2.6 | 2.5 | 2.9 | n/a | 0.01 (−0.18 to 0.21) | 0.89 | 0.29 (0.08 to 0.51) | 0.01 | |
| RG‐UK factor: problem‐solving | n/a | 3.0 | 2.8 | 2.7 | 2.8 | n/a | −0.11 (−0.25 to 0.33) | 0.13 | 0.08 (−0.06 to 0.22) | 0.26 | |
Means and proportions were estimated on the weighted sample to reflect the population characteristics by gender, age and ethnicity.
Results from multivariable linear regressions models with the exception of § where logistic models were used. Reported estimates are in the form of mean differences in outcome between years for the linear regression models, and odds ratios for the logistic models. All models were also adjusted for ethnicity, employment status and diagnosis as these were found to differ between years. The Social Capital models were also adjusted by age as this was found to differ between 2011 and 2013 samples. Inverse probability weights were used to reflect the population characteristics by gender, age and ethnicity.
The weighted mean discrimination scores from the specified time points ranged from 41.6% in 2008 to 28.4 in 2014, see Fig. 1. A weighted multiple regression model provided evidence of lower mean overall discrimination in 2014 as compared to 2008 (mean difference: −13.55, 95% CI: −17.32 to −9.78, P < 0.001). The model also provided evidence of lower mean overall discrimination in 2014 as compared to 2013 (mean difference: −3.70, 95% CI: −6.46 to −0.94, P = 0.009). No evidence of change was found between 2014 and 2011. Again, a cumulative decline year on year was not found.
Figure 1.
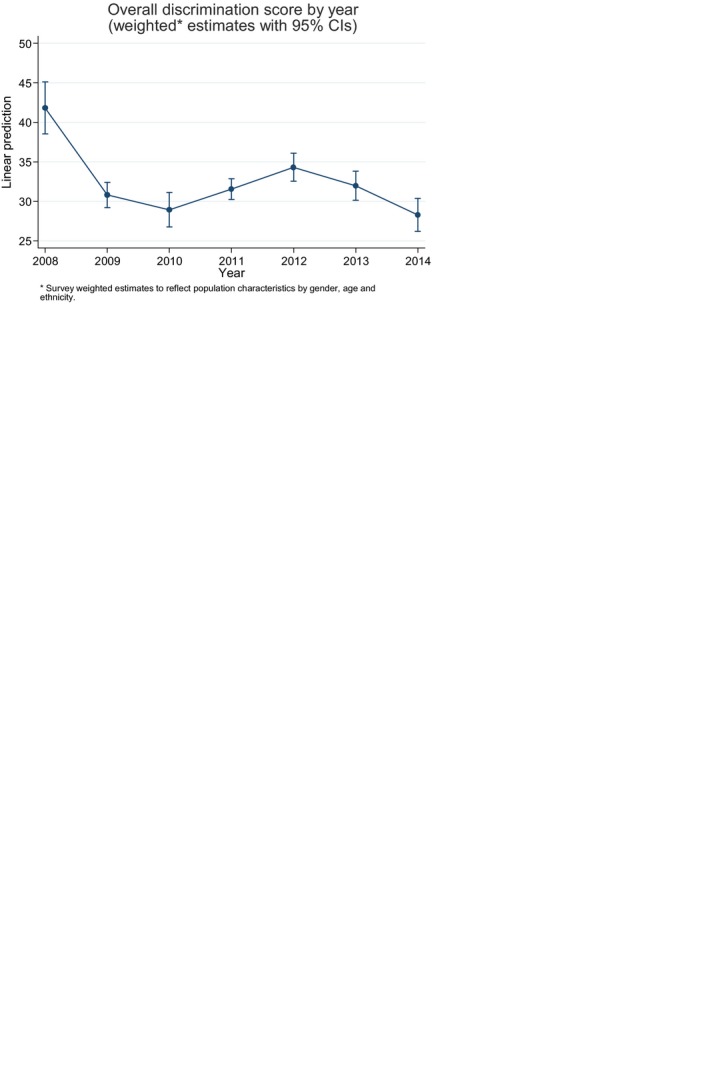
Overall discrimination score by year (weighted* estimates with 95% CIs).
Table 3 compares changes in negative discrimination between 2008–2014, 2011–2014 and 2013–2014 for each life area covered by the DISC‐12. Across all years, the most common sources of discrimination reported were as follows: family, friends and social life, and the experience of being avoided or shunned. Comparing 2014 with 2008, there were significantly fewer experiences of discrimination reported with respect to friends, family, dating, mental health staff, finding a job, keeping a job, police, education, religious activities, social life, privacy, starting a family or being shunned in 2014, although there were fluctuations in the direction of change throughout the time period.
Table 3.
Negative discrimination 2008–2014, 2011–2014 and 2013–2014
| Percentage reporting discriminationa | 2008 to 2014b | 2011 to 2014a | 2013 to 2014a | ||||||||||||||
|---|---|---|---|---|---|---|---|---|---|---|---|---|---|---|---|---|---|
| Life area | 2008 | 2011 | 2012 | 2013 | 2014 | OR | P | Significant after Bonferroni correction | OR | P | Significant after Bonferroni correction | OR | P | Significant after Bonferroni correction | |||
| Being shunned | 58 | 50 | 61 | 50 | 51 | 0.60 | 0.01 |
|
0.81 | 0.09 | ns | 0.73 | 0.02 |
|
|||
| Friends | 58 | 40 | 50 | 44 | 43 | 0.48 | 0.00 |
|
1.08 | 0.56 | ns | 0.78 | 0.09 | ns | |||
| Family | 54 | 42 | 46 | 47 | 47 | 0.55 | 0.00 |
|
0.92 | 0.52 | ns | 0.76 | 0.04 |
|
|||
| Social life | 46 | 34 | 42 | 31 | 33 | 0.43 | 0.00 |
|
0.75 | 0.03 |
|
0.74 | 0.03 |
|
|||
| Mental health staff | 38 | 32 | 33 | 35 | 33 | 0.70 | 0.03 |
|
1.02 | 0.89 | ns | 0.72 | 0.02 |
|
|||
| Dating | 31 | 26 | 26 | 21 | 21 | 0.36 | 0.00 |
|
0.50 | 0.00 |
|
0.64 | 0.00 |
|
|||
| Physical health | 29 | 28 | 31 | 30 | 29 | 0.79 | 0.22 | ns | 0.87 | 0.29 | ns | 0.80 | 0.09 | ns | |||
| Neighbours | 24 | 25 | 25 | 20 | 22 | 0.70 | 0.07 | ns | 0.70 | 0.02 |
|
0.84 | 0.28 | ns | |||
| Find job | 28 | 23 | 21 | 13 | 17 | 0.44 | 0.00 |
|
0.69 | 0.03 |
|
1.31 | 0.11 | ns | |||
| Privacy | 27 | 21 | 22 | 16 | 18 | 0.41 | 0.00 |
|
0.61 | 0.00 |
|
0.81 | 0.19 | ns | |||
| Safety | 23 | 24 | 25 | 20 | 21 | 0.70 | 0.10 | ns | 0.67 | 0.01 |
|
0.77 | 0.10 | ns | |||
| Benefits | 18 | 27 | 28 | 25 | 24 | 1.24 | 0.28 | ns | 0.81 | 0.13 | ns | 0.90 | 0.44 | ns | |||
| Parenting | 19 | 16 | 18 | 17 | 15 | 0.64 | 0.05 | ns | 0.76 | 0.15 | ns | 0.93 | 0.67 | ns | |||
| Keep job | 22 | 18 | 19 | 14 | 16 | 0.57 | 0.01 |
|
0.83 | 0.24 | ns | 0.95 | 0.78 | ns | |||
| Police | 18 | 19 | 18 | 13 | 14 | 0.50 | 0.01 |
|
0.50 | 0.00 |
|
0.64 | 0.02 |
|
|||
| Housing | 13 | 14 | 17 | 15 | 14 | 1.03 | 0.89 | ns | 1.14 | 0.47 | ns | 0.98 | 0.89 | ns | |||
| Education | 15 | 15 | 13 | 10 | 10 | 0.49 | 0.01 |
|
0.64 | 0.03 |
|
0.75 | 0.19 | ns | |||
| Marriage | 13 | 17 | 14 | 11 | 14 | 0.93 | 0.75 | ns | 0.70 | 0.03 |
|
1.20 | 0.27 | ns | |||
| Transport | 10 | 12 | 13 | 12 | 11 | 0.83 | 0.49 | ns | 0.67 | 0.05 |
|
0.59 | 0.02 |
|
|||
| Starting a family | 12 | 9 | 9 | 6 | 7 | 0.43 | 0.00 |
|
0.62 | 0.04 |
|
0.99 | 0.97 | ns | |||
| Religious activities | 10 | 5 | 6 | 4 | 5 | 0.44 | 0.01 |
|
1.08 | 0.79 | ns | 1.12 | 0.68 | ns | |||
Proportions were estimated on the weighted sample to reflect the population characteristics by gender, age and ethnicity.
Results from multivariable logistic regressions of report of discrimination on year, adjusted for ethnicity, employment status and diagnosis as these were found to differ between years. Inverse probability weights were used to reflect the population characteristics by gender, age and ethnicity.
Comparing 2014 with 2011 specifically, there were significantly fewer experiences of discrimination with regard to: social life, dating, neighbours, finding a job, privacy, safety, education, marriage, transport, starting a family and police in 2014.
Comparing 2014 with 2013 specifically, there were significantly fewer experiences of discrimination with regard to: family, mental health staff, dating, social life, police, public transport and the experience of being shunned in 2014.
Anticipated discrimination
A logistic regression using weighted percentages shows no evidence for a significant change between any of the specified time points for feeling the need to conceal one's diagnosis, see Table 2. No differences in stopping oneself from starting relationships were found in 2014 compared to 2008 or 2011. A significant difference was found indicating that fewer participants stopped themselves from starting relationships in 2014 compared to 2013 (OR: 0.77, 95% CI: 0.59, 0.99, P = 0.04). Again, there were fluctuations in the direction of change throughout the time period.
Social capital
The weighted mean number of resources accessible to participants from 2011 to 2014 is displayed in Table 2, and it was significantly lower than the general population benchmark of 17.24 11 in each year (P < 0.001).
After adjusting for potential confounders between years in sensitivity models for all comparisons made, the results show no differences between 2014 and 2011 on the Total score RG‐UK. There was a difference of 0.38 between 2014 and 2011 on the expert subscale (95% CI: −0.65 to −0.11), indicating access to fewer expert resources in 2014. A difference of 0.29 more resources was found on the skills subscale in 2014 compared to 2013 (95% CI: 0.08 to 0.51). No other significant differences were found.
Discussion
Over the course of TTC, our findings show a period of decrease in experiences of discrimination, followed by a brief increase, and a second period of reduction. The overall median number of life areas in which discrimination was reported was significantly lower in 2014 than in 2008; however, there was not a consistent decline. Concerning specific life areas in which experienced discrimination was assessed, significant decreases were found comparing the specified time points for social life, dating and interactions with the police, however again these were not consistent. No differences were found between any of the specified time points for treatment within physical health services or welfare benefits.
The pattern of a brief rise in reports of discrimination after an initial fall and a second fall during Phase 2 of TTC may be at least partially explained by economic downturn in the UK economy from 2009. A synthesis (systematic review and meta‐analysis) of trends in public attitude towards mental health in the United States between the 1950s and the 1990s showed improvements and declines which mirrored the economic and employment context of the country 27. Additionally, an attitude study conducted over two time points (1990 and 2011) in Germany found that public attitudes towards people with schizophrenia worsened over time 28. More negative attitudes may be translated into discriminatory behaviour. However, knowledge, attitudes and some behaviour items were found to have improved in 2015 compared to 2009 in a survey conducted in England as reported in this issue (Henderson et al.). Although the majority of participants reported experiencing discrimination in at least one life area in 2014, the proportion of experienced discrimination is down on 2008, 2011, 2012 and 2013. This is in line with research suggesting that public attitudes towards mental illness may be improving 29, 30.
It is difficult to address stigma in mental health and physical health professionals because of unequal power relationships between service users and staff and other problems such as staff burnout and structural discrimination which affect resources 31, as also highlighted in pages xx‐xx (Hamilton et al.) of this issue. Research presented in pages xx‐xx (Knaak & Patten) of this issue highlights the specific problems faced when designing and delivering antistigma programmes to healthcare providers, suggesting that targeted interventions may be required. Additionally, there is evidence to suggest that attitudes towards people who receive disability welfare benefits can be negative 32 and, although the change in discrimination regarding welfare benefits in the current sample did not change significantly between 2009 and 2015, between 2009 and 2012 there was a signification increase of this type of discrimination found by the Viewpoint Survey 10.
It is not known whether experienced and anticipated discrimination were changing before the baseline point in 2008, nor how contemporaneous factors may have contributed to these changes over time, so shifts in scores cannot be directly attributed to the TTC programme.
The other key limitation of this study is the response rate. Following the rate of 6% in 2008, two changes were made to the 2009–2010 recruitment strategy, detailed in the methods section; despite these changes, only 7% and 8% of people who received an invitation pack were interviewed in 2009 and 2010 respectively. In 2011–2014, two further changes, an invitation letter from the participating trust and the offer of a £10 voucher for taking part in the survey, increased the response rate to 11%, 10%, 10.3% and 8% respectively. There are a number of factors that may have affected the response rate. First, participants had to respond to the initial mail out by sending back a consent form to the research team, after which, they would be called by an interviewer who would verbally confirm consent before starting the interview, creating a ‘two step’ consent procedure. Second, recruitment relied on sampling through NHS trust patient databases which may not have been accurate or up to date; between 46 and 176 packs per year are known to have been returned to the trusts as undeliverable and it is likely that more were undelivered but not returned. Third, the consistently low response rate may reflect the nature of the population, many of whom may struggle to engage with a study of this kind. Finally, this population may be asked to participate in research quite regularly and may be experiencing research fatigue. In spite of the low response rate our sampling design is an improvement over previous similar surveys in England, as the sample is drawn from those using NHS mental health services rather than from memberships of national mental health charities. Further, the high reported rates of discrimination are consistent with surveys using the same instrument and different data collection methods yielding higher response rates 1, 3, 33.
The results may have been affected by changes to simplify the wording of the survey instrument, as a revised version of the DISC was used from 2009. The main change was that ‘treated differently, and worse’ was replaced by ‘treated unfairly’ in each item on experienced discrimination. The changes lowered the Flesch–Kincaid reading grade to level 7.4 (i.e. understandable by the average US 7–8th grader) from 13.2 (i.e. understandable by the average US 13th grader). Subsequent validation of the DISC shows that the two sets of wording used in 2008 vs. 2009 onwards elicit similar responses 20. Further, while each question was re‐worded in the same way, this did not result in the same pattern of change in endorsement across all items.
Unfortunately, we did not have the means to collect any information from people who did not respond to the invitation pack and so it is not known if or how they differ from the participants of the study. It remains to be seen whether programmes such as Time to Change can impact on experiences in life areas in which structural discrimination may play a considerable role such as healthcare and welfare benefits, especially during reductions in public spending.
Funding
Time to Change programme, grants from UK Department of Health and Comic Relief.
Declaration of interest
None.
Acknowledgements
We would like to acknowledge the Viewpoint interviewing team. We are also grateful for collaboration on the evaluation by: Sue Baker, Paul Farmer and Paul Corry. During Phase 1 of TTC GT, DR and CH were funded in relation to a National Institute for Health Research (NIHR) Applied Programme grant awarded to the South London and Maudsley NHS Foundation Trust (GT). GT and DR were funded in relation to the NIHR Specialist Mental Health Biomedical Research Centre at the Institute of Psychiatry, King's College London and the South London and Maudsley NHS Foundation Trust. CH, SEL and EC were supported during phases 1 and 2 by the grants to Time to Change from Big Lottery, the UK Department of Health and Comic Relief, and ER during phase 2. CH was also funded by grants from the NIHR, Maudsley Charity and Guy's and St Thomas's Charity. DR would like to acknowledge the NIHR CLAHRC South London. All opinions expressed here are solely those of the authors.
Corker E, Hamilton S, Robinson E, Cotney J, Pinfold V, Rose D, Thornicroft G, Henderson C. Viewpoint survey of mental health service users’ experiences of discrimination in England 2008–2014.
References
- 1. Lasalvia A, Zoppei S, Van Bortel T et al. Global pattern of experienced and anticipated discrimination reported by people with major depressive disorder: a cross‐sectional survey. Lancet 2013;381:55–62. [DOI] [PubMed] [Google Scholar]
- 2. Thornicroft G. Shunned. Oxford: Oxford University Press, 2006. [Google Scholar]
- 3. Thornicroft G, Brohan E, Rose D, Sartorius N, Leese M, Grp IS. Global pattern of experienced and anticipated discrimination against people with schizophrenia: a cross‐sectional survey. Lancet 2009;373:408–415. [DOI] [PubMed] [Google Scholar]
- 4. Mehta N, Kassam A, Leese M, Butler G, Thornicroft G. Public attitudes towards people with mental illness in England and Scotland, 1994–2003. Br J Psychiatry 2009;194:278–284. [DOI] [PubMed] [Google Scholar]
- 5. Gaebel W, Zäske H, Baumann AE et al. Evaluation of the German WPA ‘Program against stigma and discrimination because of schizophrenia ‐ Open the Doors’: results from representative telephone surveys before and after three years of antistigma interventions. Schizophr Res 2008;98:184–193. [DOI] [PubMed] [Google Scholar]
- 6. Henderson C, Thornicroft G. Stigma and discrimination in mental illness: Time to Change. Lancet 2009;373:1928. [DOI] [PubMed] [Google Scholar]
- 7. Henderson C, Corker E, Lewis‐Holmes E et al. England's time to change antistigma campaign: one‐year outcomes of service user‐rated experiences of discrimination. Psychiatr Serv 2012;63:451–457. [DOI] [PubMed] [Google Scholar]
- 8. Corker E, Hamilton S, Henderson C et al. Experiences of discrimination among people using mental health services in England 2008–2011. Br J Psychiatry Suppl 2013;55:s58–s63. [DOI] [PubMed] [Google Scholar]
- 9. Prince M, Patel V, Saxena S et al. No health without mental health. Lancet 2007;370:859–877. [DOI] [PubMed] [Google Scholar]
- 10. Henderson RC, Corker E, Hamilton S et al. Viewpoint survey of mental health service users’ experiences of discrimination in England 2008–2012. Soc Psychiatry Psychiatr Epidemiol 2014;49:1599–1608. [DOI] [PMC free article] [PubMed] [Google Scholar]
- 11. Webber M. Social capital and mental health In: Kingsley J, ed. Social perspectives in mental health developing social models to understand and work with mental distress. London: J. Tew, 2005: 90–111. [Google Scholar]
- 12. Webber M, Corker E, Hamilton S et al. Discrimination against people with severe mental illness and their access to social capital: findings from the Viewpoint survey. Epidemiol Psychiatr Sci 2014;23:155–165. [DOI] [PMC free article] [PubMed] [Google Scholar]
- 13. Coleman JS. Social capital in the creation of human capital. Am J Sociol 1988;94:s95–s120. [Google Scholar]
- 14. Putnam R. Bowling alone: the collapse and revival of American community. New York: Simon & Schuster, 2000. [Google Scholar]
- 15. Lin N. Social capital. A theory of social structure and action. Cambridge: Cambridge University Press, 2001. [Google Scholar]
- 16. Bourdieu P. The forms of capital In: Halsey AH, Lauder H, Brown P, StuartWells A, eds. Education: culture, economy, society. Oxford: Oxford University Press, 1997:46–58. [Google Scholar]
- 17. Webber MP, Huxley PJ. Measuring access to social capital: the validity and reliability of the Resource Generator‐UK and its association with common mental disorder. Soc Sci Med 2007;65:481–492. [DOI] [PubMed] [Google Scholar]
- 18. Glover GR, Robin E, Emami J, Arabscheibani GR. A needs index for mental health care. Soc Psychiatry Psychiatr Epidemiol 1998;33:89–96. [DOI] [PubMed] [Google Scholar]
- 19. Williams LM, Patterson JE, Miller RB. Panning for gold: a clinician's guide to using research. J Marital Fam Ther 2006;32:17–32. [DOI] [PubMed] [Google Scholar]
- 20. Brohan E, Clement S, Rose D, Sartorius N, Slade M, Thornicroft G. Development and psychometric evaluation of the Discrimination and Stigma Scale (DISC). Psychiatry Res 2013;208:33–40. [DOI] [PubMed] [Google Scholar]
- 21. McCallister L, Fischer CS. A procedure for surveying personal networks. Sociol Methods Res 1978;7:131–148. [Google Scholar]
- 22. Lin N, Erickson B. Social capital an international research program. Oxford: Oxford University Press, 2008. [Google Scholar]
- 23. Van Der Gaag M, Snijders TAB. The Resource Generator: social capital quantification with concrete items. Soc Networks 2005;27:1–29. [Google Scholar]
- 24. Dutt K, Webber M. Access to social capital and social support among South East Asian women with severe mental health problems: a cross‐sectional survey. Int J Soc Psychiatry 2010;56:593–605. [DOI] [PubMed] [Google Scholar]
- 25. Webber M, Huxley P, Harris T. Social capital and the course of depression: six‐month prospective cohort study. J Affect Disord 2011;129:149–157. [DOI] [PubMed] [Google Scholar]
- 26. NHS . NHS Information Centre [Internet]. 2011. Available from: http://www.hscic.gov.uk/
- 27. Schomerus G, Schwahn C, Holzinger A et al. Evolution of public attitudes about mental illness: a systematic review and meta‐analysis. Acta Psychiatr Scand 2012;125:440–452. [DOI] [PubMed] [Google Scholar]
- 28. Angermeyer MC, Matschinger H, Schomerus G. Attitudes towards psychiatric treatment and people with mental illness: changes over two decades. Br J Psychiatry 2013;203:146–151. [DOI] [PubMed] [Google Scholar]
- 29. Evans‐lacko S, Corker E, Williams P, Henderson C, Thornicroft G. Effect of the Time to Change anti‐stigma campaign on trends in mental‐illness‐related public stigma among the English population in 2003–13: an analysis of survey data. Lancet Psychiatry 2014;1:121–128. [DOI] [PubMed] [Google Scholar]
- 30. Evans‐Lacko S, Henderson C, Thornicroft G. Public knowledge, attitudes and behaviour regarding people with mental illness in England 2009–2012. Br J Psychiatry Suppl 2013;55:s51–s57. [DOI] [PubMed] [Google Scholar]
- 31. Onyett S. Revisiting job satisfaction and burnout in community mental health teams. J Ment Health 2011;20:198–209. [DOI] [PubMed] [Google Scholar]
- 32. NatCen . British Social Attitudes. 2012.
- 33. Wyllie A, Brown R. Discrimination reported by users of mental health services: 2010 survey. New Zealand; 2011.