

Abstract
In vitro drug release testing and ex vivo transcorneal drug permeation can provide valuable information on the performance of the Q1/Q2 equivalent ointments prior to any animal studies. Good correlation between in vitro and ex vivo drug release may be indicative of good in vitro and in vivo correlation. Accordingly, it is important to investigate in vitro as well as ex vivo drug release from Q1/Q2 equivalent ophthalmic ointments and evaluate whether a correlation between these release profiles can be established. Four Q1/Q2 equivalent loteprednol etabonate ointments were prepared using different processing methods and excipient sources. The rheological parameters (crossover modulus and K value) of the four formulations were determined. The in vitro drug release testing of the four ointment formulations were performed using three different apparati (Franz diffusion cells, USP apparatus 2 with enhancer cells and USP apparatus 4 with semisolid adapters). Three models (zero order, logarithmic and the Higuchi model) were used to study the release kinetics of the ointment formulations. The transcorneal (rabbit corneas) permeation studies were performed using spherical joint Franz diffusion cells. The USP apparatus 4 method demonstrated better discriminatory ability compared to the USP apparatus 2 and the Franz diffusion cell methods. The in vitro release profiles of the four Q1/Q2 equivalent ointments with manufacturing differences showed a better fit using the Higuchi model (R2 > 0.98) for all three release testing methods, compared to the other two models. Ex vivo drug release through the rabbit corneas displayed zero order release kinetics. A logarithmic correlation between rheological parameters (crossover and K value) and transcorneal flux were established. In addition, a plot of the in vitro release rate against the ex vivo release flux of the four ointment formulations, yielded a straight line (R2 > 0.98) for all three release methods. Accordingly, the rheological parameters may be useful in predicting in vitro as well as ex vivo release properties.
Keywords: ophthalmic ointment, Lotemax, in vitro, ex vivo, transcorneal, rabbit corneas, Franz diffusion cells, hydroxypropyl-beta-cyclodextrin
Graphical abstract
1. Introduction
Topical ocular drug delivery has been limited by low drug bioavailability due to the short retention time of drugs on the corneal surface and their rapid precorneal elimination. Following eye drop instillation, up to 95% of the drug contained in the drops is lost as a result of tearing and nonproductive absorption. Tremendous effort has been made to improve ocular drug bioavailability using different mechanisms such as in situ gelling [1–4], contact lenses [5, 6], viscosity enhancers [7] and mucoadhesives [8]. However, to date, conventional dosage forms (e.g. eye drops, suspensions and ointments) are still the mainstream treatment of ocular diseases, accounting for approximately 97% of the marketed topical ocular products approved by the FDA [9]. Among those commercial ophthalmic dosage forms, ointments (mainly the oleaginous type) account for approximately 10% of the products, second only to eye drops. Conventional oleaginous ophthalmic ointments are preferred due to their prolonged retention time on the eye surface, which results in reduced dosing frequency and improved patient compliance, compared to other conventional topical ocular dosage forms. However, there has been a lack of understanding of formulation design and processing, as well as in vitro, ex vivo and in vivo performance of ocular ointments, with only a few recent publications [9–11] covering these aspects.
According to the FDA guideline [12], a critical quality attribute (CQA) is a physical, chemical, biological, or microbiological property or characteristic that should be within an appropriate limit, range, or distribution to ensure the desired product quality. CQAs are generally associated with the drug substance, excipients, intermediates (in-process materials), and drug product. CQAs of dosage forms are typically the aspects affecting the drug product purity, stability and drug release. It is crucial to understand the critical quality attributes and their impact on product performance in order to facilitate manufacturing as well as regulatory review to achieve reproducible and safe drug products. In the manufacturing of qualitatively (same components) and quantitatively (same components in same concentration) (Q1/Q2) equivalent formulations, it has been reported that minor manufacturing changes (e.g. manufacturing site changes, different solvents utilized in the processing, the excipient grade and source, etc.) may lead to significant differences in the in vitro and in vivo performances [11, 13–15]. Therefore, it is important to develop in vitro dissolution methods that are capable of discriminating formulations with manufacturing differences.
To further understand how the critical attributes impact in vivo performance of the Q1/Q2 equivalent ophthalmic formulations with manufacturing differences, the best approach is to conduct in vivo studies. However, those studies are time-consuming, expensive and require a large number of animals. In vitro and/or ex vivo models, on the other hand, are more economical and are ethical alternatives to investigate permeation and absorption in the eye. Such models can be particularly useful during preliminary formulation development. There has been a recent review of commonly used in vitro and ex vivo models of corneal penetration and absorption [16]. The rabbit model is preferred for in vivo as well as ex vivo corneal studies since the anatomy of the rabbit eye is the most similar to that of the human eye. It has been demonstrated that good linear correlation (r2 = 0.95) can be achieved between in vitro permeation and in vivo drug absorption for passively diffused drugs in corneal epithelium studies [17]. A good in vitro-ex vivo correlation of drug release may be indicative of good in vitro-in vivo correlation.
The current study investigates loteprednol etabonate ophthalmic ointment. Loteprednol etabonate is one of the first-generation cortienic acid-based soft steroids extensively used as a treatment for ophthalmic inflammatory conditions [18]. Under physiological conditions, loteprednol etabonate converts to an inactive metabolite after it produces its therapeutic effect [19]. Compared to other corticosteroids, the soft drug design of loteprednol etabonate renders it less toxic with a higher therapeutic index. To date, there are three ophthalmic dosage forms (suspension: 0.5% or 0.2%, ointment: 0.5% and gel: 0.5%) of loteprednol etabonate approved by the FDA as Lotemax® (Bausch & Lomb Inc.) for the treatment of postoperative pain and inflammation after ocular surgery. Previous reports [10, 11] have shown strong logarithmic correlations between the critical quality attributes (crossover modulus and K value) and the in vitro drug release rate for loteprednol etabonate ophthalmic ointments.
The aim of the present study is to investigates how the CQAs affect the ex vivo transcorneal flux and the relationship between the in vitro drug release and ex vivo transcorneal drug permeation for four Q1/Q2 equivalent formulations of loteprednol etabonate with manufacturing differences using the spherical Franz diffusion cells. Therefore, the attempts will be made to correlate the physicochemical properties with the in vitro as well as the ex vivo drug release from the Q1/Q2 equivalent formulations, and to correlate the in vitro and the ex vivo drug release. In addition, the present paper will study the in vitro drug release mechanism of the ointments. In vitro drug release data from three different methods (Franz diffusion cells, USP apparatus 2 with enhancer cells and USP apparatus 4 with semisolid adapters) will be utilized. The in vitro drug release kinetics of the Q1/Q2 equivalent ointments will be evaluated using three commonly used models (zero-order kinetics, logarithmic model and Higuchi model).
2. Materials and methods
2.1. Materials
Loteprednol etabonate (particle size: 19 μm) was purchased from Pure Chemistry Scientific Inc, USA. Two different sources of white petrolatum were purchased from Fisher® and Fougera®, respectively. Mineral oil USP, sodium chloride, calcium chloride, sodium dodecyl sulfate (SDS), was purchased from Sigma-Aldrich, USA. Sodium bicarbonate was purchased from Fisher®, USA. Hydroxypropyl-beta-cyclodextrin (HP-β- CD) was purchased from Shandong Binzhou Zhiyuan Biotechnology Co., Ltd, China. Unless otherwise specified, all materials were of analytical grade.
2.2. Preparation of loteprednol etabonate ointments
Loteprednol etabonate ointments (drug content: 0.5% w/w) that are Q1/Q2 equivalent were prepared as previously reported [11]. In brief, a mixture (batch size: 50 grams) of white petrolatum (69.2% w/w), API (0.5% w/w) and mineral oil (30.3% w/w) was added in a plastic jar (Unguator®). The mixture was processed with three different manufacturing methods including: 1) hot melting at 65°C and mixing with immediate cooling in a −20°C freezer; 2) hot melting at 65°C and mixing with cooling at room temperature; and 3) simple mixing at room temperature. The stirring speed of mixing (Unguator® e/s mixer, GAKO® International GmbH) was 1,450 rpm and the mixing time for the simple mixing and hot melting methods were 6 and 5 minutes, respectively. Two different sources of white petrolatum (Fisher®, Fougera®) were used to prepare the loteprednol etabonate ophthalmic ointment formulations. Four Q1/Q2 equivalent ointment formulations with different manufacturing processes were prepared and are listed in Table 1.
Table 1.
Manufacturing methods for the Q1/Q2 equivalent loteprednol etabonate ophthalmic ointments.
| Formulations | Manufacturing process | Petrolatum sources |
|---|---|---|
| F1 | Hot melting with immediate cooling at −20°C | Fisher® |
| F2 | Hot melting with cooling at room temperature | Fougera® |
| F3 | Simple mixing at room temperature | Fisher® |
| F4 | Simple mixing at room temperature | Fougera® |
2.3. HPLC analysis
The concentration of loteprednol etabonate was determined using a PerkinElmer Flexar HPLC system with a UV detector set at 244 nm. The mobile phase was a mixture of acetonitrile, water, and acetic acid (65.0/34.5/0.5, v/v/v). Zorbax® Eclipse XDB-Phenyl C18 (250 x 4.6 mm, 5 μm; Agilent Technologies, USA) column was used with a flow rate of 1 ml/min and the column temperature was set at 30°C. Fifty microliters of the samples were injected into the HPLC. The chromatographs were analyzed using the Chromera software kit V3.0. Adequate linearity was shown in the concentration ranges of 0.02 to 1.00 μg/ml (R2= 0.99) and 0.10 to 5.00 μg/ml (R2= 0.99). Both concentration ranges showed adequate inter- and intra-day precision (RSD (%) < 2.0).
2.4. Rheological characterization
The rheological properties of the loteprednol etabonate ointments were characterized using a Rheometer (ARES-G2, TA Instruments, USA) equipped with a step-peltier stage and a 20 mm AL ST plate. Approximately 0.3 g of the ointment was placed on the lower plate. The geometry gap was set at 1,000 μm. The temperature of the conditioning step was set at 37°C. A time sweep step was performed for 45 min to allow the samples to fully recover from the shear applied during sample preparation (monitored at oscillatory stress 0.1 Pa and 0.1 Hz oscillation frequency. Then a stress sweep step was performed with the oscillatory stress changing from 0.1 to 25 Pa while maintaining the frequency at 0.1 Hz. After the same time sweep step mentioned earlier, a steady state flow step was performed with the shear rate (, 1/s) changing from 10−4 to 103 s−1. The viscosity of the samples were measured in log mode (2 points per decade were collected). During the measurement, the % tolerance in each point was set to 5.0%. All samples were performed in triplicates.
2.5. In vitro release testing
Three release testing methods (Franz diffusion cells, USP apparatus 2 and USP apparatus 4) were used to investigate the in vitro release of the loteprednol etabonate ointments. The release testing was performed in pH 7.4 artificial tear fluid (containing 0.67% (w/v) of NaCl, 0.2% (w/v) of NaHCO3, and 0.008% (w/v) of CaCl2·2H2O) with 0.5% SDS (w/v) at 37°C. Cellulose acetate membranes (Sartorius®, 0.45 μm average pore size) were used as the artificial membrane and maintained in Millipore water for 30 minutes prior to ointment loading. At predetermined time intervals (0.25, 0.5, 1.0, 1.5, 2.0, 2.5, 3.0, 4.0, 6.0 hours), a certain volume of sample was withdrawn and replenished with fresh media.
2.5.1. Franz diffusion cells
Vertical Franz diffusion cells with a volume of 12 ml (contact area: 1.77 cm2, PermeGear Inc.) were used. Cellulose acetate membranes were placed on top of the receptor chambers of the cells following the addition of the release media. Then the donor chambers were mounted on the membranes and clamped tightly. 150 mg samples of the ointments were loaded into the donor chambers and 250 μl of the release medium were added to the top of the ointment to simulate the small amount of tear secreted on the eye surface. The stirring speed of the Franz diffusion cells was set at 600 rpm. At pre-determined time intervals, 0.15 ml of the media were withdrawn from the receptor chambers and replenished with fresh media.
2.5.2. USP apparatus 2 with enhancer cells
Enhancer cells (surface area: 4 cm2, Agilent Technologies, USA) were used with USP apparatus 2 equipped with 200 ml flat bottom dissolution vessels to determine the in vitro release profiles of the loteprednol etabonate ointments. Fifty milligrams of the ointment samples were filled into the compartment of the enhancer cells. To prevent bulge or air entrapment between the ointment surface and the membrane, the ointment surface was flattened using a thin plastic tool. Cellulose acetate membranes were placed on the surface of the ointment samples and the cells were assembled as per the manufacturer’s instructions. The assembled enhancer cells were placed at the bottom of the dissolution vessels with the membrane facing up and the pre-heated (37.0 ± 0.5°C) release medium (40 ml) was then added to start the test. The mini paddles were used and the agitation speed was set at 150 rpm. At pre-determined time intervals, 1 ml samples of the release medium were withdrawn and replenished with fresh media.
2.5.3. USP apparatus 4 with semisolid adapters
Semisolid adapters (exposure area of 1.54 cm2, Sotax Corporation, USA) were used with USP apparatus 4 (Sotax CE7 smart with CY 7 piston pump, Sotax Corporation, USA) to perform the in vitro release testing of loteprednol etabonate ointments. The reservoirs of the adapter cells (depth: 2.6 mm) were filled with the ointments (~330 mg) and the surface was flattened with a thin plastic tool to avoid air entrapment between the ointment surface and the membrane. Cellulose acetate membranes were placed over the surface of the sample compartments and the adapters were assembled as per the manufacturer’s instructions. The adapters with the membrane facing down were loaded into flow-through cells (22.6 mm in diameter) prefilled with 14 g of glass beads (1 mm in diameter). 50 ml of release media was circulated through the flow-through cells at a flow rate of 8 ml/min at 37°C. At pre-determined time intervals, 1 ml of the release medium was withdrawn and replenished with fresh media. This method was developed in our laboratory to achieve discrimination between ophthalmic ointment formulations with manufacturing differences [11] (Figure 1).
Figure 1.

Photographs of the semisolid adapters and schematic representation of USP apparatus 4 with the semisolid adapters used for release testing of ophthalmic ointments.
2.6. Ex vivo transcorneal permeation
Franz diffusion cells (PermeGear Inc., Hellertown, PA) with spherical joints (diameter: 9 mm, area: 0.64 cm2, volume: 5 ml) (Figure 2) were utilized to investigate the transcorneal permeation of the ointment formulations. Optisol™-GS, which is the storage media used for the preservation of donor corneal epithelium in cornea transplantation [20], was utilized as the storage medium for the rabbit corneas. The excised rabbit corneas (Pel-Freez Biologicals, Rogers, AR) were stored in Optisol™-GS corneal storage media (Bausch & Lomb Inc, NY) at 4°C after harvesting. The corneas were shipped in this medium on ice and stored at 4°C upon receiving. All the experiments were completed within three days. The transcorneal permeation was performed in pH 7.4 artificial tear fluid with 9% (w/v) hydroxypropyl-beta-cyclodextrin (HP-β-CD) at 34°C. Five milliliters of permeation media was added into the receptor chamber and the agitation speed was set at 600 rpm. The rabbit corneas with sclera (the white part) were trimmed to the right size and washed using pH 7.4 PBS three times prior to mounting onto the spherical joint of the receptor chamber. The cornea was placed so that the exterior side faced the donor chamber. A steel clamp was used to tighten the two chambers. Any bubbles between the media in the receptor chamber and the cornea were expelled. 200 μl of permeation media was added to the donor chamber to equilibrate the corneas for 10 minutes. The equilibrium media was then removed from the donor chamber and any residual media was removed via absorption onto a tissue paper. Approximately 200 mg of ointment was dispensed into the donor chamber and flattened using a dispensing tip (Unguator®). 100 μl of permeation media was added to the donor chamber to mimic the tear fluid excreted from the human eyes. The transcorneal permeation of drug solutions (in pH 7.4 artificial tear fluid with 9% (w/v) HP-β-CD) with different concentrations was also investigated. One milliliter volumes of the drug solutions (8.80, 17.20 and 35.70 μg/ml) were added to the donor chamber. Parafilm was used to cover the donor chamber to prevent water evaporation. The samples were withdrawn at predetermined time intervals: 0.5, 1.0, 1.5, 2.0, 2.5, 3.0, 4.0 hours after sample loading.
Figure 2.

Photographic image of spherical joint Franz diffusion cells used for transcorneal permeation studies.
2.7. Epithelium integrity of rabbit corneas
Integrity of the epithelium layer of rabbit corneas were examined before and after the ex vivo transcorneal permeation experiments. The cornea tissues were fixed using 10% buffered (phosphate buffer) formalin and embedded in paraffin blocks. Hematoxylin and eosin (H&E) staining was used to check the histology of the corneas. Slides of the tissue sections were observed using Olympus BX51 light microscopy (Olympus America Inc. New York) and the images were captured utilizing SPOT IMAGING™ software (Diagnostic Instruments, Inc. MI, USA).
2.8. Statistical analysis
ANOVA analysis with Bonferroni’s test was performed to compare the mean difference of the parameters. Significant differences were regarded when p < 0.05. Wilcoxon Rank Sum/Mann-Whitney rank test was used to compare the discriminatory ability of the in vitro and ex vivo release testing methods. The linear regression and fitting were performed using OriginPro 2017 software (OriginLab Corporation).
3. Results and Discussion
3.1. Rheological properties of loteprednol etabonate ointments
Based on the previous reports [10, 11], the two critical rheological parameters of loteprednol etabonate semisolid formulations are the crossover modulus (CM) and the Power law consistency index (K value). The crossover modulus is obtained at the point where the storage modulus G’ is equal to the loss modulus G” when plotted against the oscillatory stress (Figure 3). The K value is obtained using the Power law equation based on the rheograms of the formulations. It has been shown that a strong logarithmic correlation exists between the two critical parameters (crossover modulus and K value) and the in vitro drug release of the Q1/Q2 equivalent ointment formulations [10]. Accordingly, in the formulation screening processes, the crossover modulus and the K value may be used to predict the in vitro release rate of the Q1/Q2 equivalent ointment formulations.
Figure 3.
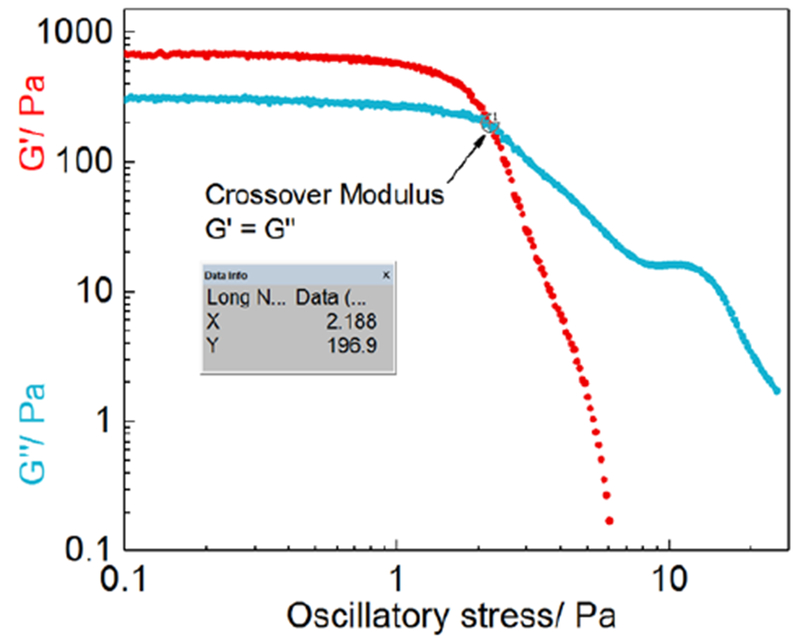
Representative (F2) stress sweep profiles (log-log scale) via plotting G’ and G” against oscillatory stress.
3.2. In vitro drug release of the Q1/Q2 equivalent ointments
In vitro drug release testing of the loteprednol etabonate ointments was investigated using three methods including: Franz diffusion cells, USP apparatus 2 with enhancer cells and USP apparatus 4 with semisolid adapters. The in vitro method development and evaluation of Q1/Q2 equivalent loteprendnol etabonate ointments have been previously reported [11]. According to the results, the USP apparatus 4 method had the best discriminatory ability between the Q1/Q2 formulations with manufacturing differences, compared to the other two in vitro release testing methods. The in vitro release rates of the ointment formulations obtained from different release methods all showed a logarithmic linear relationship with the critical physicochemical parameters (crossover modulus and K value) [11].
Based on the release profiles of the four Q1/Q2 equivalent loteprednol etabonate ointments, different models including zero order kinetics, logarithmic and Higuchi models were used here to investigate the release kinetics of the loteprednol etabonate semisolid ointments obtained using the different release testing methods (Franz diffusion cell method (Table 2a), USP apparatus 2 with enhancer cells (Table 2b) and USP apparatus 4 with semisolid adapters (Table 2c). The Hig uchi model showed the best fit for all the ointment formulations obtained and all three release testing methods. The goodness of fit coefficient (R2) between the three models demonstrated the following rank order: Higuchi > logarithmic > zero order. Therefore, drug release from the ointments follows the Higuchi model and is diffusion controlled.
Table 2a.
Model fitting of drug release profiles (Franz diffusion cell method) of loteprednol etabonate ointments.
| Zero order model | Logarithmic model | Higuchi model | ||||
|---|---|---|---|---|---|---|
| Formulation | k0 × 102 | R2 | klog | R2 | kH | R2 |
| F1 | 1.250 ± 0.131 | 0.946 ± 0.013 | 5.030 ± 0.543 | 0.995 ± 0.004 | 0.346 ± 0.037 | 0.989 ± 0.006 |
| F2 | 1.530 ± 0.259 | 0.965 ± 0.012 | 6.062 ± 1.024 | 0.987 ± 0.006 | 0.421 ± 0.071 | 0.995 ± 0.003 |
| F3 | 2.060 ± 0.294 | 0.967 ± 0.005 | 8.139 ± 1.149 | 0.987 ± 0.003 | 0.565 ± 0.088 | 0.996 ± 0.001 |
| F4 | 2.510 ± 0.216 | 0.977 ± 0.008 | 9.814 ± 0.878 | 0.980 ± 0.008 | 0.684 ± 0.066 | 0.998 ± 0.001 |
Table 2b.
Model fitting of drug release profiles (USP apparatus 2 with enhancer cells method) of loteprednol etabonate ointments.
| Zero order model | Logarithmic model | Higuchi model | ||||
|---|---|---|---|---|---|---|
| Formulation | k0 × 102 | R2 | klog | R2 | kH | R2 |
| F1 | 0.560 ± 0.073 | 0.975 ± 0.009 | 2.186 ± 0.289 | 0.981 ± 0.008 | 0.152 ± 0.020 | 0.996 ± 0.003 |
| F2 | 0.730 ± 0.080 | 0.949 ± 0.012 | 2.900 ± 0.317 | 0.980 ± 0.010 | 0.200 ± 0.022 | 0.983 ± 0.009 |
| F3 | 1.100 ± 0.092 | 0.978 ± 0.008 | 4.286 ± 0.373 | 0.980 ± 0.006 | 0.299 ± 0.026 | 0.997 ± 0.003 |
| F4 | 1.450 ± 0.113 | 0.977 ± 0.013 | 5.693 ± 0.466 | 0.979 ± 0.012 | 0.397 ± 0.031 | 0.998 ± 0.002 |
Table 2c.
Model fitting of drug release profiles (USP apparatus 4 with semisolid adapters method) of loteprednol etabonate ointments.
| Zero order model | Logarithmic model | Higuchi model | ||||
|---|---|---|---|---|---|---|
| Formulation | k0 × 102 | R2 | klog | R2 | kH | R2 |
| F1 | 0.730 ± 0.075 | 0.983 ± 0.009 | 2.856 ± 0.275 | 0.978 ± 0.011 | 0.200 ± 0.020 | 0.985 ± 0.002 |
| F2 | 1.100 ± 0.052 | 0.981 ± 0.006 | 4.282 ± 0.199 | 0.977 ± 0.008 | 0.299 ± 0.015 | 0.997 ± 0.008 |
| F3 | 1.430 ± 0.177 | 0.987 ± 0.004 | 5.532 ± 0.708 | 0.978 ± 0.010 | 0.388 ± 0.049 | 0.983 ± 0.002 |
| F4 | 1.830 ± 0.233 | 0.980 ± 0.004 | 7.139 ± 0.911 | 0.979 ± 0.008 | 0.498 ± 0.063 | 0.988 ± 0.002 |
The selection of the time ranges as well as the number of time points may affect the model fitting results. Different time points and ranges of time (between 0.25 and 6 hours) were used for the model-fitting analysis. It was determined that the time points below 2 hours were very critical in determining the release kinetics of the formulations, as if only the time points of 2 hours and above are considered then the data from all three release testing methods changed from Higuchi to logarithmic or other models. For apparatus 4 data, the 0.25 h time point was below the detection limit for all four formulations. In addition, for the formulation with the slowest drug release (F1), 0.5-hour time point was also below the detection limit. Accordingly, for fair comparison the time range between 1 and 6 hours was selected to perform the model fitting.
3.3. Ex vivo drug permeation of the Q1/Q2 equivalent ointments
3.3.1. Transcorneal permeation of loteprednol etabonate solutions
Transcorneal permeation studies of different concentrations of loteprednol etabonate solutions prepared in 9% (w/v) HP-β-CD were tested using rabbit corneas. All drug concentrations showed zero order permeation kinetics (Figure 4A) and the steady state transcorneal flux (Jss) was linear, proportional to the concentration of the drug solution (Figure 4B). The apparent permeation coefficient (Papp) of the loteprednol etabonate was calculated using the following equation [21, 22]:
| (1) |
| (2) |
where ΔQ/Δt is the cumulative permeated amount of drug across the cornea (Q) over time (t), A is the exposed corneal surface area (0.64 cm2 in present study), C0 is the initial concentration of the drug in the donor chamber, 3600 is conversion from hours to minutes, and Jss is the steady state transcorneal flux (slope of cumulative permeation profiles in Figure 4A). The transcorneal permeation coefficient of the loteprednol etabonate was 0.04 cm/h (1.11 × 10⁻⁵ cm/s).
Figure 4.

A) Transcorneal permeation of loteprednol etabonate solutions with different concentrations; and B) linear regression profile obtained via plotting transcorneal flux against drug concentration (n = 3).
3.3.2. Transcorneal permeation of the ointment formulations
The profiles of ex vivo transcorneal permeation of the loteprednol etabonate ointment showed zero-order kinetics (Figure 5A). The drug flux from the ointments was obtained using zero-order model fitting (Figure 5B). Significant differences (p < 0.05) were observed between the transcorneal flux of F1 and F3; F1 and F4; as well as F2 and F4. In order to compare the discriminatory ability of the in vitro release methods with the ex vivo permeation methods, Wilcoxon Rank Sum/Mann-Whitney rank test was performed as previously described [11]. The same rank order was observed for transcorneal flux from the ointment formulations with manufacturing differences as had previously been observed for the in vitro drug release rates. All the methods (three in vitro release testing methods and the ex vivo permeation method) showed good discriminatory ability for the four ointment formulations (Table 3).
Figure 5.

A) Transcorneal permeation profiles; and B) Transcorneal flux of the loteprednol etabonate ointments obtained using spherical joint Franz diffusion cells (n = 6). (* p < 0.05; ** p < 0.01).
Table 3.
Discriminatory ability comparison of the three in vitro release testing methods as well as ex vivo permeation method based on the Wilcoxon Rank Sum/Mann-Whitney rank test.
| Ratio | Test: | F2 | F4 | F4 | F4 | F3 |
|---|---|---|---|---|---|---|
| Order | Reference: | F1 | F1 | F2 | F3 | F2 |
| In vitro release testing using Franz Diffusion Cell | ||||||
| 8th (%) | 102.3 | 178.1 | 139.5 | 104.7 | 115.4 | |
| 29th (%) | 143.2 | 223.7 | 187.8 | 105 | 166.7 | |
| In vitro release testing using USP Apparatus 2 | ||||||
| 8th (%) | 116.5 | 235.7 | 180.9 | 126.4 | 133.3 | |
| 29th (%) | 151.4 | 300 | 222.4 | 146.5 | 166.9 | |
| In vitro release testing using USP Apparatus 4 | ||||||
| 8th (%) | 142.5 | 224.3 | 144.2 | 114.2 | 112.0 | |
| 29th (%) | 162.3 | 286.5 | 185.2 | 148.9 | 145.1 | |
| Ex vivo permeation using spherical joint FDC | ||||||
| 8th (%) | 98.1 | 153.0 | 129.6 | 104.8 | 104.3 | |
| 29th (%) | 141.6 | 232.0 | 189.0 | 157.5 | 164.0 | |
3.3.3. Integrity of rabbit corneas
The current study was to investigate the impact of manufacturing differences on the physicochemical characteristics {in vitro drug release) as well as the ex vivo transcorneal flux. It is crucial to maintain the integrity of the rabbit cornea epithelium during the transcorneal permeation study. Accordingly, epithelium integrity was carefully examined during storage before experimentation, as well as after the drug permeation studies. The corneas were stored in Optisol™-GS at 4°C. H&E staining was used to examine the integrity of the rabbit corneas upon receipt (Day 0) (Figure 6A) and after storage for up to 6 days (Figure 6B). The corneas were intact for at least six days, however by day 13 the epithelium layer was not continuous and had thinned due to loss of cells (Figure 6C). Accordingly, all the corneas were used within three days to ensure epithelium integrity.
Figure 6.

Histological photographs of rabbit corneas: A) stored in Optisol™-GS at Day 0 at 4°C; B) stored in Optisol™-GS at Day 6 at 4°C; C) stored in Optisol™-GS at Day 13 at 4°C; D) incubated in pH 7.4 artificial tear fluid with 0.5% (w/v) of SDS at 34°C for 4 hours; E) incubated in pH 7.4 artificial tear fluid with 9% (w/v) HP-β-CD at 34°C for 7 hours; F) used in the transcorneal permeation study (6.5-hour duration); and G) used in the transcorneal permeation study (4-hour duration). * represents the epithelium layer side (exterior side of the rabbit cornea)
The in vitro drug release testing of the semisolid ophthalmic ointments was conducted in pH 7.4 artificial tear fluid containing 0.5% (w/v) SDS to maintain sink conditions. However, the same media cannot be applied to perform the ex vivo permeation study due to the severe de-epithelization caused by the surfactant (Figure 6D). HP-β-CD is an excellent excipient in ophthalmic drug delivery due to its superior drug solubilization, and tolerance in rabbit eyes (not toxic even at a concentration of 12.5% (w/v) aqueous solution) compared to other excipients [23], 9% (w/v) of HP-β-CD was used as the permeation media and different durations were investigated. As expected, the corneas remained intact after incubation (7 h) in the permeation media (Figure 6E). However, when mounted in the spherical Franz diffusion cells for a similar period of time (6.5 h), the epithelial layers (Figure 6F) were partially de-epithelized. This damage was avoided by reducing the experimental duration to 4 h (Figure 6G). It is speculated that the force applied on the corneas after mounting onto the Franz diffusion cells may have a significant impact on the integrity of the rabbit corneas. Therefore, the duration of the transcorneal permeation study using the Franz diffusion cells was limited to 4 hours in this case.
The concentration of the drug in the receiver chamber was far below the detection limit when no solubilizer was added due to the extremely low water solubility (~0.5 μg/ml) of loteprednol etabonate. Therefore, HP-β-CD was used as a solubilizer to increase the drug solubility while maintaining sink conditions. It has been reported that cyclodextrins alone cannot enhance drug transcorneal permeation, but they can enhance topical drug delivery to the eye by increasing the amount of free drug in the aqueous tear fluid [24]. In the ex vivo transcorneal process, the drug molecules have to pass through the five different cornea layers. The most important cornea layers in terms of drug permeation are the outmost epithelium layer and inner stroma layer. The other layers are relatively thin and do not provide significant resistant to drug permeation. For hydrophilic molecules, penetration into the epithelium layer is the rate limiting step. Whereas the stroma layer of the cornea is the rate limiting step for lipophilic drug molecules. Loteprednol etabonate has sufficient lipophilicity (logK of 3.0) [25], and therefore penetration into the stroma is the rate-limiting step.
3.4. In vitro-ex vivo correlation of drug release from the ophthalmic ointments
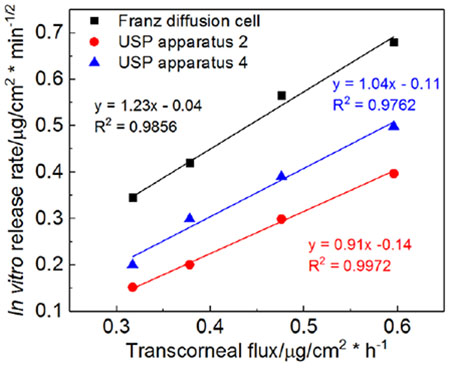
To better understand the impact of the physicochemical attributes of the ophthalmic ointments on the ex vivo drug flux, logarithmic models were utilized to investigate possible correlation between the rheological parameters (CM and K values) and the ex vivo drug flux. In addition, a linear model was used to understand the correlation between the in vitro drug release rate and the ex vivo transcorneal drug flux. A strong logarithmic correlation was observed for both rheological parameters (CM and K value) with the transcorneal flux for all four ointment formulations (Figure 7A). When comparing the in vitro drug release profiles with the ex vivo transcorneal permeation profiles (Figure 8), the drug permeation rates were much slower compared to the in vitro drug release rates obtained using different release testing methods. However, the rank order of the in vitro release from the four formulations was the same as their permeation rate. Plotting the in vitro release rate against the ex vivo release flux of the four ointment formulations, yielded a straight line (R2 > 0.98) for all three release testing methods, indicating a good in vitro-ex vivo linear correlation of the four Q1/Q2 equivalent ointment formulations (Figure 7B).
Figure 7.

Regression profiles of A) Linear correlation (logarithmic mode) between critical parameters and transcorneal flux; and B) linear correlation between in vitro release rate and ex vivo transcorneal flux.
Figure 8.

In vitro drug release and ex vivo transcorneal permeation profiles of four Q1/Q2 equivalent semisolid ophthalmic ointments: A) Formulation 1; B) Formulation 2; C) Formulation 3; and D) Formulation 4. (FDC: Franz diffusion cell method; USP apparatus 2: USP apparatus 2 with enhancer cells method; USP apparatus 4: USP apparatus 4 with semisolid adapters method; ex vivo: ex vivo transcorneal permeation using spherical joint Franz diffusion cells)
The four Q1/Q2 formulations were prepared using different mixing methods and excipient sources. Based on our previous studies [10, 11], two major manufacturing factors influence the rheological properties: 1) hot melting or non-hot melting; and 2) the white petrolatum source. Formulations prepared using the hot melting methods showed higher rheological properties compared to formulations prepared using the non-hot melting method (i.e. simple mixing). Hot melting results in intimate mixing of the white petrolatum and mineral oil, and consequently a more dense ointment base compared to those prepared via simple mixing. Our previous study [10] showed that white petrolatum from Fisher® possessed higher rheological properties compared to the petrolatum from Fougera®. Consequently, F1 showed the highest rheological parameters (crossover modulus (CM) and K value) since this formulation was prepared with the white petrolatum from Fisher® using the hot melting method. The current study revealed that both the in vitro drug release and the ex vivo drug flux from the ointments are inversely correlated to the rheological parameters (Figure 7A). The higher the rheological parameters (CM and K value), the lower the in vitro drug release and ex vivo flux. CM and K values are two different rheological parameters utilized to characterize the ointment formulations. CM characterizes the oscillatory stress applied on the ointments for transition from the solid-like state to the liquid-like state. The higher the CM, the more difficult it is to transition from solid-like to liquid-like properties under stress. The K value expresses the apparent viscosity of an ointment base at a shear rate of 1 s-1. Although the ointment samples are not under any stress during the in vitro and ex vivo drug flux experiments, the in vitro drug release rate or ex vivo flux of the ointment are dependent on their apparent viscosity. This can explain why the K value showed a higher degree of correlation with the in vitro drug release rate and ex vivo flux rate compared to CM.
Among the three in vitro release testing methods, the Franz diffusion cell method resulted in the highest release rate (Figure 8) for all four formulations. This can be attributed to the addition of 250 μl of release media (simulated tear fluid) into the donor chamber in the Franz diffusion cell method, facilitating drug release. Despite the release rate differences, all three release testing methods demonstrated the same release kinetics and the same rank order for all four Q1/Q2 equivalent ointments.
To better understand the impact of the manufacturing process on the ex vivo transcorneal permeation of the ophthalmic ointments, the lag time of the four formulations was determined using the intercept of the linear regression profiles (Figure 5A). The lag times were 19.4 ± 21.9, 15.2 ± 11.0, 48.3 ± 21.9 and 33.2 ± 14.2 minutes for F1, F2, F3 and F4, respectively. The formulations prepared using the hot melting methods (F1 and F2) showed significantly shorter (p < 0.05) lag times compared to the formulations prepared using the non-hot melting method (F3 and F4). This may be attributed to faster heat transfer and temperature equilibration as a result of the higher density of these formulations, allowing drug release at the initial time point. However, once the formulations prepared using simple mixing reached heat equilibrium, the drug is released faster due to the lower viscosity of these ointments. The formulations prepared using the white petrolatum from Fougera® demonstrated a slightly shorter lag time compared to the formulations prepared using the white petrolatum from Fisher® (i.e. F1 vs. F2; F3 vs. F4). This is probably due to the lower viscosity of the white petrolatum form Fougera®.
4. Conclusions
The present study further confirmed the utility of rheological parameters (crossover modulus and K value) as benchmarks to characterize semisolid ointment formulations. In addition, these rheological parameters may also be useful in the characterization of other semisolid formulations such as gels and creams. Strong correlations were obtained between the rheological parameters and both the in vitro and ex vivo drug release. Therefore, the rheological parameters can be used to predict the in vitro drug release and ex vivo drug permeation. Such correlations have not been previously reported. Given the particular anatomy of the eye, in vivo drug release data is difficult to obtain and is compromised by physicochemical factors such as tearing and non-productive absorption. Accordingly, development of in vitro-in vivo correlations (IVIVCs) is challenging for ophthalmic formulations. Therefore, ex vivo studies may be a good option to compare ophthalmic formulations including Q1/Q2 equivalent formulations with manufacturing differences. An in vitro-ex vivo correlation may be indicative of a possible IVIVC. The in vitro drug release from the ointment formulations is diffusion controlled since their in vitro drug release profiles followed the Higuchi release kinetics for all three release testing methods. The release kinetics of the ophthalmic ointments may vary if different time ranges are utilized in the model fitting, and so care should be taken when selecting which time range to use during the model fitting process. Epithelium integrity should be carefully examined during transcorneal permeation studies in the development of ophthalmic ointment products to avoid any possible errors.
5. Acknowledgement
Funding for this project was made possible by a Food and Drug Administration grant (1U01FD005177-01). The views expressed in this paper do not reflect the official policies of the U.S. Food and Drug Administration or the U.S. Department of Health and Human Services; nor does any mention of trade names, commercial practices, or organization imply endorsement by the United States Government.
Dissolution equipment support from Sotax Corporation is highly appreciated.
Abbreviations:
- Q1/Q2 equivalent
qualitative and quantitative sameness
- RLD
reference listed drug, Lotemax®
- CM
crossover modulus
- K value
Power law consistency index
- HP-β-CD
Hydroxypropyl-beta-cyclodextrin
- IVIVC
in vitro-in vivo correlation
Footnotes
Publisher's Disclaimer: This is a PDF file of an unedited manuscript that has been accepted for publication. As a service to our customers we are providing this early version of the manuscript. The manuscript will undergo copyediting, typesetting, and review of the resulting proof before it is published in its final citable form. Please note that during the production process errors may be discovered which could affect the content, and all legal disclaimers that apply to the journal pertain.
6. References
- [1].Destruel P-L, Zeng N, Maury M, Mignet N, Boudy V, In vitro and in vivo evaluation of in situ gelling systems for sustained topical ophthalmic delivery: state of the art and beyond, Drug discovery today, (2016). [DOI] [PubMed] [Google Scholar]
- [2].Fathalla ZM, Vangala A, Longman M, Khaled KA, Hussein AK, El-Garhy OH, Alany RG, Poloxamer-based thermoresponsive ketorolac tromethamine in situ gel preparations: Design, characterisation, toxicity and transcorneal permeation studies, European Journal of Pharmaceutics and Biopharmaceutics, 114 (2017) 119–134. [DOI] [PubMed] [Google Scholar]
- [3].Morsi N, Ibrahim M, Refai H, El Sorogy H, Nanoemulsion-based electrolyte triggered in situ gel for ocular delivery of acetazolamide, European Journal of Pharmaceutical Sciences, 104 (2017) 302–314. [DOI] [PubMed] [Google Scholar]
- [4].Jamard M, Hoare T, Sheardown H, Nanogels of methylcellulose hydrophobized with N-tert-butylacrylamide for ocular drug delivery, Drug delivery and translational research, 6 (2016) 648–659. [DOI] [PubMed] [Google Scholar]
- [5].García-Millán E, Quintáns-Carballo M, Otero-Espinar FJ, Improved release of triamcinolone acetonide from medicated soft contact lenses loaded with drug nanosuspensions, International Journal of Pharmaceutics, 525 (2017) 226–236. [DOI] [PubMed] [Google Scholar]
- [6].Kim J, Chauhan A, Dexamethasone transport and ocular delivery from poly (hydroxyethyl methacrylate) gels, International journal of pharmaceutics, 353 (2008) 205–222. [DOI] [PubMed] [Google Scholar]
- [7].Kaur IP, Singh M, Kanwar M, Formulation and evaluation of ophthalmic preparations of acetazolamide, International journal of pharmaceutics, 199 (2000) 119–127. [DOI] [PubMed] [Google Scholar]
- [8].Liu S, Dozois MD, Chang CN, Ahmad A, Ng DL, Hileeto D, Liang H, Reyad M-M, Boyd S, Jones LW, Prolonged ocular retention of mucoadhesive nanoparticle eye drop formulation enables treatment of eye diseases using significantly reduced dosage, Molecular pharmaceutics, 13 (2016) 2897–2905. [DOI] [PubMed] [Google Scholar]
- [9].Xu X, Al-Ghabeish M, Rahman Z, Krishnaiah YS, Yerlikaya F, Yang Y, Manda P, Hunt RL, Khan MA, Formulation and process factors influencing product quality and in vitro performance of ophthalmic ointments, International journal of pharmaceutics, 493 (2015) 412–425. [DOI] [PubMed] [Google Scholar]
- [10].Bao Q, Jog R, Shen J, Newman B, Wang Y, Choi S, Burgess DJ, Physicochemical attributes and dissolution testing of ophthalmic ointments, International journal of pharmaceutics, 523 (2017) 310–319. [DOI] [PMC free article] [PubMed] [Google Scholar]
- [11].Bao Q, Shen J, Jog R, Zhang C, Newman B, Wang Y, Choi S, Burgess DJ, In vitro release testing method development for ophthalmic ointments, International Journal of Pharmaceutics, 526 (2017) 145–156. [DOI] [PMC free article] [PubMed] [Google Scholar]
- [12].FDA U, Guidance for Industry. Q8 (R2) Pharmaceutical Development, in, Department of Health and Human Services Silver Spring, MD USA, 2008. [Google Scholar]
- [13].SUPACSS, Guidance for Industry. Nonsterile Semisolid Dosage Forms. Scale-up and Postapproval Changes: Chemistry, Manufacturing, and Controls; In Vitro Release Testing and in Vivo Bioequivalence Documentation, Center for Drug Evaluation and Research (CDER), (1997). [Google Scholar]
- [14].Shen J, Choi S, Qu W, Wang Y, Burgess DJ, In vitro-in vivo correlation of parenteral risperidone polymeric microspheres, Journal of Controlled Release, 218 (2015) 2–12. [DOI] [PMC free article] [PubMed] [Google Scholar]
- [15].Andhariya JV, Shen J, Choi S, Wang Y, Zou Y, Burgess DJ, Development of in vitro-in vivo correlation of parenteral naltrexone loaded polymeric microspheres, Journal of Controlled Release, 255 (2017) 27–35. [DOI] [PubMed] [Google Scholar]
- [16].Agarwal P, Rupenthal ID, In vitro and ex vivo corneal penetration and absorption models, Drug delivery and translational research, 6 (2016) 634–647. [DOI] [PubMed] [Google Scholar]
- [17].Chang-Lin J, Drug transport mechanisms in the rabbit corneal epithelium: In vitro-in vivo correlation, (1969). [Google Scholar]
- [18].Bodor N, Buchwald P, Ophthalmic drug design based on the metabolic activity of the eye: soft drugs and chemical delivery systems, The AAPS journal, 7 (2005) E820–E833. [DOI] [PMC free article] [PubMed] [Google Scholar]
- [19].Glogowski S, Lowe E, Siou-Mermet R, Ong T, Richardson M, Prolonged Exposure to Loteprednol Etabonate in Human Tear Fluid and Rabbit Ocular Tissues Following Topical Ocular Administration of Lotemax Gel, 0.5%, Journal of Ocular Pharmacology and Therapeutics, 30 (2014) 66–73. [DOI] [PubMed] [Google Scholar]
- [20].Greenbaum A, Hasany S, Rootman D, Optisol vs Dexsol as storage media for preservation of human corneal epithelium, Eye, 18 (2004) 519. [DOI] [PubMed] [Google Scholar]
- [21].Valls R, Vega E, Garcia M, Egea M, Valls J, Transcorneal permeation in a corneal device of non-steroidal anti-inflammatory drugs in drug delivery systems, The open medicinal chemistry journal, 2 (2008) 66. [DOI] [PMC free article] [PubMed] [Google Scholar]
- [22].Burgalassi S, Monti D, Brignoccoli A, Fabiani O, Lenzi C, Pirone A, Chetoni P, Development of cultured rabbit corneal epithelium for drug permeation studies: a comparison with excised rabbit cornea, Journal of Ocular Pharmacology & Therapeutics, 20 (2004) 518–532. [DOI] [PubMed] [Google Scholar]
- [23].European Medicines Agency. 2014 Background review for cyclodextrins used as excipients. Url: http://www.ema.europa.eu/docs/en_GB/document_library/Report/2014/12/WC500177936.pdf, 2017. (accessed 01 August 2017).
- [24].Loftsson T, Drug permeation through biomembranes: cyclodextrins and the unstirred water layer, Die Pharmazie-An International Journal of Pharmaceutical Sciences, 67 (2012) 363–370. [PubMed] [Google Scholar]
- [25].REDDY IK, KHAN MA, WU W-M, BODOR NS, Permeability of a soft steroid, loteprednol etabonate, through an excised rabbit cornea, Journal of ocular pharmacology and therapeutics, 12 (1996) 159–167. [DOI] [PubMed] [Google Scholar]