

Abstract
Background:
While tobacco and alcohol studies have focused on density of outlets as a determinant of consumption, research has begun examining the effects of medical marijuana (MM) dispensaries on marijuana use.
Objectives:
Examine the relationship between density of MM dispensaries and frequency of marijuana use among young adult medical marijuana patients (MMP) and non-patient users (NPU).
Methods:
Young adult marijuana users (n=329) aged 18–26 years old were sampled in Los Angeles in 2014–15 and separated into MMP (n=198) and NPU (n=131). In 2014, 425 operational MM dispensaries were identified within the City of Los Angeles. Sequential multilevel Poisson random effect models examined density of MM dispensaries per square mile and 90-day marijuana use among MMP and NUP at the ZIP code level while controlling for demographic, behavioral, and community characteristics.
Results:
Density of MM dispensaries was not related to 90-day use of marijuana (days of use or hits per day) among either MMP or NPU. MMP reported significantly greater days of marijuana use in the past 90 days compared to NPU but no differences were found for hits per day. African Americans reported significant greater hits per day compared to whites. Hispanics reported significantly fewer hits per day compared to non-Hispanics.
Conclusion:
Concentration of MM dispensaries surrounding young adult marijuana users in Los Angeles was unrelated to days of marijuana use irrespective of having a MM recommendation or not. Rather, individual factors related to consumer choices and behaviors were more important in determining recent marijuana use among MMP and NPU.
Introduction
Marijuana dispensaries are an increasingly common feature of urban spaces as more states legalize marijuana for medical and recreational use. While these storefront establishments are designated to dispense marijuana to individuals with doctor’s recommendations and/or legal adults for recreational use, research is increasingly examining whether the location or concentration of dispensaries are associated with negative effects for communities where they are positioned, such as crime, violence, and hospitalization (Contreras, 2017; Freisthler, Gaidus, Tam, Ponicki, & Gruenewald, 2017; Friesthler, Ponicki, Gaidus, & Gruenewald, 2016; Kepple & Freisthler, 2012; Mair, Freisthler, Ponicki, & Gaidus 2015; Subica, Douglas, Kepple, Villanueva, & Grills, 2018; Zakrewski, Wheeler, & Thompson 2019). Prior studies of marijuana dispensaries have been pursued at the city level (Contreras, 2017; Friesthler et al., 2016; Freisthler et al., 2017; Kepple & Freisthler, 2012; Kioumarsi et al., 2018; Subica et al., 2018; Thomas & Freisthler, 2016), as well as larger areas, including the state level (Freisthler and Gruenewald, 2014; Huckle et al., 2008; Mair et al., 2015; Shi 2016). While tobacco and alcohol studies have frequently focused on density of outlets within a community as a determinant of tobacco or alcohol consumption, research has begun examining the relationship between the availability of medical marijuana dispensaries and marijuana use among adults (Friesthler & Gruenwald, 2014) and adolescents (Shi, 2016). No studies have examined whether density of medical marijuana dispensaries is associated with frequency of marijuana use among young adults, the group with the highest rates of marijuana use (Substance Abuse and Mental Health Services Administration, 2017).
In contrast to research studying the effects of density of marijuana dispensaries, research examining the relationship between density of alcohol and tobacco outlets and health is well-established. For instance, the relationship between adolescent or young adult alcohol consumption and alcohol outlet density has been commonly studied and results typically point to a positive association (Rowland et al., 2016; Shih et al., 2015). Alcohol outlet density has been associated with various social problems, such as earlier age of initiation of alcohol use (Rowland et al., 2016), increased binge drinking (Shih et al., 2015; Troung & Sturm, 2009), violent crime (Cameron, Cochrane, Gordon, & Livingston, 2016; Gorman et al., 2018; Furr-Holden et al., 2016), intimate partner violence (Snowden, 2016), greater personal problems (Kypri, Bell, Hay, & Baxter, 2008), and neighborhood disorder, particularly, pedestrian (Nesoff et al., 2018) and bicyclist injuries (DiMaggio, Mooney, Frangos, & Wall, 2016). Similarly, a number of studies have documented a positive relationship between youth smoking behavior and residential or school-based tobacco outlet density (Cantrell et al., 2016; Finan et al., 2018; Henriksen et al., 2008; Larsen et al., 2017; Lipperman-Kreda, Grube, & Friend, 2012; Lipperman-Kreda, Grube, Friend, & Mair, 2015; McCarthy et al., 2009; Mennis & Mason, 2016; Mennis, Mason, Way, & Zaharakis, 2016; Schleicher, Johnson, Fortmann, & Henriksen, 2016). In studies examining the association of outlet density and frequency of tobacco or alcohol use among recent users, results were inconsistent, including no association (Henriksen et al, 2008), or a positive association (Schonlau et al., 2008). Overall, studies of alcohol and tobacco use among youth generally indicate higher rates of use where density of outlets is greater (Berg, Henriksen, Cavazos-Rehg, Haardoerfer, & Freisthler, 2018).
Research to date on density of medical marijuana dispensaries and marijuana consumption indicates mixed results. For instance, a statewide survey of California adult residents identified a positive association between city-level density of storefront dispensaries and prevalence and frequency of past year marijuana use, and that young adults (aged 18–29) were more likely to be current and frequent marijuana users than older adults (Freisthler & Gruenewald, 2014). In contrast, a study of adolescents from 18 states with legalized medical marijuana found no relationship between current or recent marijuana use and proximity of marijuana dispensaries to schools (Shi, 2016). Another California-based study found increased aggregate-level hospitalizations with primary or secondary marijuana abuse/dependence codes in ZIP code areas with higher density of medical marijuana dispensaries (Mair et al., 2015). Existing studies, however, have not established a relationship between lifetime marijuana use and density of marijuana storefronts or delivery services (Friesthler & Gruenwald, 2014), nor have they examined rates of current marijuana use and density among young adult marijuana users.
Current marijuana use among young adults is commonly examined according to demographic factors, such as race/ethnicity, age, gender, education, and socioeconomic status. Nationally, young adults (aged 18–25) have the highest rates of current (past 30 days) marijuana use compared to adolescents and older adults (Substance Abuse and Mental Health Services Administration, 2017), and marijuana use rates among young adults are even higher in California (Center for Behavioral Health Statistics and Quality, 2017). Non-Hispanics of two or more races ranked highest in current marijuana use, followed by non-Hispanic African-Americans, whites, American Indians, and Latinos (Center for Behavioral Health Statistics and Quality, 2017). Among high school students, marijuana use is higher among males than females, and higher among black and Hispanics than whites (Kann et al., 2016). Young adults with a college degree use marijuana at lower rates than counterparts with lower education status (Center for Behavioral Health Statistics and Quality, 2017), while twelfth grade students were less likely to use marijuana in the past 30 days than their counterparts who had dropped out of school (Tice, 2013). Employment and marijuana use in the past 30 days has been found to be negatively associated (Register & Williams, 1992).
This study investigates whether density of medical marijuana dispensaries is related to frequency of current marijuana use among young adult marijuana users. The chosen environment is Los Angeles, which contains the greatest concentration of medical marijuana dispensaries in the U.S. with an estimated 400 dispensaries within the city limits (UCLA Medical Marijuana Research, 2015).
Methods
Sample
Targeted sampling (Watters & Biernacki, 1989) and chain referral sampling (Biernacki & Waldorf, 1981) were used to sample participants (n=366) between February 2014 and April 2015 in socioeconomic and geographically diverse areas of Los Angeles, such as medical marijuana dispensaries, parks, streets, and college campuses. Additionally, recruitment flyers were posted on Craigslist, a classified advertisements website, and in public locations across the Los Angeles area. Persons screened for study eligibility were given a $3 gift card while those who were both qualified and interviewed received a $25 cash incentive. All data collection preceded the legalization of recreational marijuana use in California, which included legalizing personal use in 2016 and legal sales in 2018.
Eligibility requirements included: aged between 18 and 26 years old; used marijuana at least four times in the last 30 days; lived in the Los Angeles metro area; and spoke/read English. Also, sampling was stratified based upon whether young adults had a current medical marijuana recommendation issued by a California-based physician, i.e., medical marijuana patients (MMP), or not, i.e., non-patient users (NPU). Participants enrolled as MMP were required to provide a valid doctor’s recommendation. Persons who reported a prior history as MMP or ever having an expired recommendation were excluded during screening.
Interviewers screened 710 young adults and 436 (61.4%) met study eligibility requirements. Among NPU, 180 conformed to eligibility requirements and 156 (86.7%) were enrolled. Among MMP, 256 met eligibility requirements and 210 (82.0%) were enrolled in the study. Enrolled and non-enrolled individuals were compared along socio-demographic variables, i.e., age, gender, and race/ethnicity, but no significant differences were found.
A total of 366 participants were sampled - 156 NPU (43%) and 210 MMP (57%). Due to missing observations for our models of interest (n=37), the final sample size for our analyses was 329 participants (131 NPU and 198 MMP). A separate analysis found no significant differences between missing observations (n=37) and the final analytical sample (n=329) along key demographic variables.
Data Collection
The study instrument was programmed using Research Electronic Data Capture (REDCap) (Harris et al., 2009). Interviews were conducted in semi-private locations in the neighborhoods where participants were recruited or lived. Questions used in this analysis were administered face-to-face on a laptop computer. Study procedures were approved by the Institutional Review Boards at Children’s Hospital Los Angeles and Drexel University.
Measures
The complete quantitative instrument examined subjects relating to demographics, marijuana and other drug use, health, and risk behaviors and required approximately 60 to 90 minutes to administer. In this analysis, the primary outcome variable is days of marijuana use in the past 90 days, which was assessed with the following question: “How many days have you used marijuana in the past 90 days?” A secondary outcome variable included was number of hits per day in the past 90 days, which was assessed with the following question: “How many hits (pull of a pipe, joint, bong, etc.) per day did you typically do in the past 90 days?” Participant’s residential location was determined with the following question: “What is the ZIP code of your current address or residence?” Sociodemographic variables were derived from structured questions about age, gender, race/ethnicity, education, marital status, and annual income (Lankenau et al., 2012). Driving a car in the past 90 days was also assessed given that driving is a primary means of travel in Los Angeles and could be associated with access to medical marijuana dispensaries. Variables pertaining to 90-day marijuana use included: money spent on marijuana products; obtaining marijuana products from a storefront (whether participants reported purchasing marijuana themselves from a medical marijuana dispensary or a drug seller, friend, family member, or someone else purchased marijuana for the participant from a dispensary); and number of sources used to obtain marijuana, e.g., dispensary, drug seller, family, friend, etc. (Lankenau et al., 2017). Face validity of outcomes examined in this analysis was achieved through pre-testing (n=10) of the quantitative instrument with MMP and NPU and having the instrument reviewed by the study’s community advisory board.
In prior studies, density of medical marijuana dispensaries has been measured by the number of storefronts per roadway mile within city (Freisthler & Gruenwald, 2014; Lipperman-Kreda, Lee, Morrison, & Freisthler, 2014) and census tracts (Kepple & Freisthler, 2012), and per square mileage in local and adjacent ZIP codes (Mair et al., 2015) and census tracts (Thomas & Freisthler, 2016). In this analysis, we operationalized medical marijuana density three ways: per square mile; per roadway; and by population density. To calculate density per population, square mileage, and the roadway mile for each ZIP code area, we divided the number of medical marijuana dispensaries by the population in each ZIP code, the total square mileage of each ZIP code, and the total roadway mile in each ZIP code, respectively. In the primary analysis, we used density per square mile as the main density indicator since it is a better measure of access to marijuana within a defined space, i.e., neighborhood, compared to density per population, which also indicates access but within in the context of neighborhood concentration.
Medical marijuana dispensary data
The medical marijuana dispensary data was compiled in the following manner. First, the names and addresses of 172 legally operating dispensaries were acquired from the Los Angeles County Department of Public Health and the Office of Los Angeles City Clerk. Second, the names and addresses of 385 illegally operating dispensaries – businesses that were out of compliance with city regulations - were obtained from Weedmaps.com, a marijuana social media site, in late 2013. Third, in mid-2014, our research team verified the addresses and operational status of all dispensaries (n=557) by cross-checking several marijuana social media websites, such as Weedmaps.com, Yelp.com, Leafly.com, Stickyguide.com as well as contacting dispensaries by telephone in some cases. Following this last step, 425 operational medical marijuana dispensaries were identified within the City of Los Angeles, which is equivalent to the findings of a separate team of researchers who found 418 open dispensaries in the City of Los Angeles in 2014 (UCLA Medical Marijuana Research, 2015). The location of these 425 dispensaries in the City of Los Angeles are plotted by ZIP code in Figure 1, which indicates higher concentrations of dispensaries in ZIP codes associated with particular neighborhoods, such as downtown Los Angeles, South Los Angeles, Venice, Van Nuys, North Hollywood, and Studio City.
Figure 1.
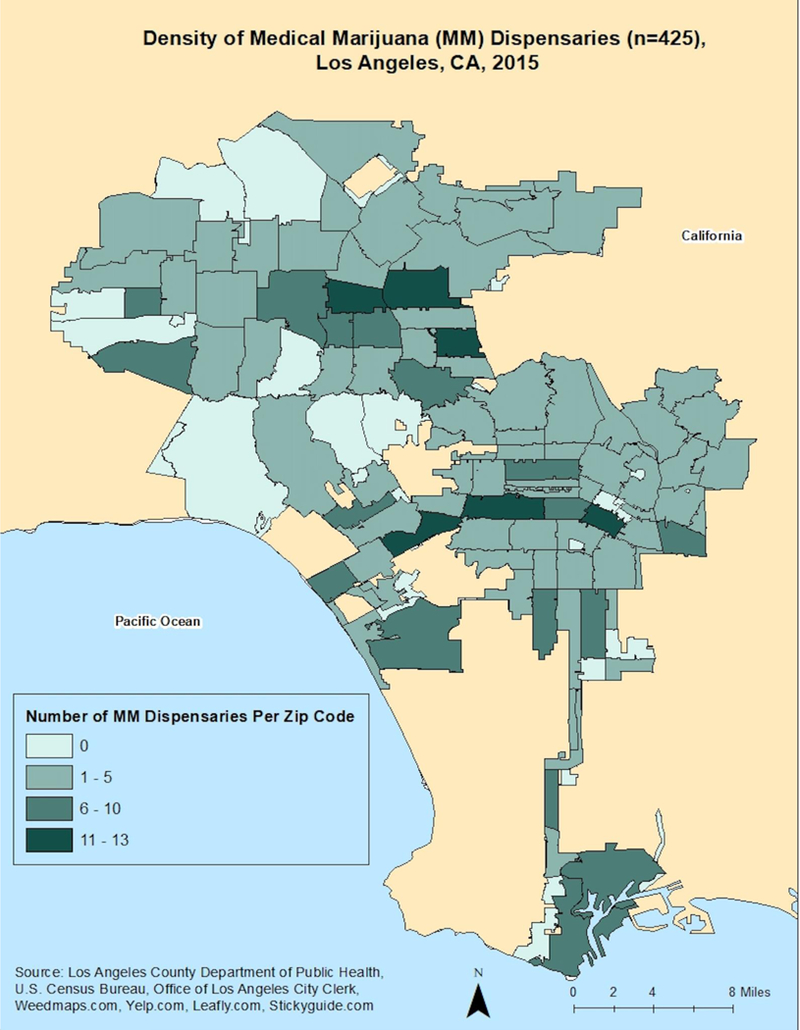
Density of Medical Marijuana (MM) Dispensaries (n=425), Los Angeles, CA, 2015.
Los Angeles ZIP code data
Demographic information of 294 ZIP code areas within Los Angeles County was captured through the United States Census Bureau website (U.S. Census Bureau, 2014). The demographic information was obtained from the 2010–2014 American Community Survey 5-Year Estimates and included several variables, such as number of population per ZIP code, race/ethnicity, age range, sexual identity, employment status, income level, education attainment, and the percentage of population below poverty level (Mair et al., 2015). In addition to 294 ZIP code areas with population equal or more than 1, there were 223 ZIP codes with zero population that were excluded from the analysis. In the final analysis, participants resided in 150 ZIP codes across Los Angeles County.
Data Analysis
Descriptive statistics – including counts, percentages, and t-tests – in addition to unadjusted odds ratios were calculated for all variables by patient status, i.e., MMP and NPU. Medical marijuana patients (MMP) were used as the reference group when calculating the unadjusted odds ratios. Odds ratios were calculated for categorical variables while t-tests were used for continuous variables (see Table 1). Since we assessed the impact of several demographic, behaviors related to marijuana use, and ZIP code characteristics on 90-day marijuana use, we examined the variance inflation factor (Chatterjee & Hadi, 2012) of these independent variables to assess multicollinearity and all factors were found to be less than 10.
Table 1.
Descriptive Characteristics of Medical Marijuana Patients (MMP) and Non-Patient Users (NPU) (N=329)
| Variable | MMP N=198 % (n) | NPU N=131 % (n) | Total N=329 % (n) | Unadjusted Odds Ratios (95% CI) |
|---|---|---|---|---|
| Gender/Sex at birth | ||||
| Male | 67.7 (134) | 62.6 (82) | 65.7 (216) | 1.3 (0.8–2.0) |
| Age | ||||
| 18–20 years old | 43.4 (86) | 52.7 (69) | 47.1 (155) | 0.7 (0.4–1.1) |
| 21–23 years old | 30.3 (60) | 27.5 (36) | 29.2 (96) | 1.1 (0.7–1.8) |
| 24–26 years old | 26.3 (52) | 19.8 (26) | 23.7 (78) | 1.4 (0.8–2.5) |
| Ethnicity | ||||
| Hispanic/Latino | 44.4 (88) | 48.9 (64) | 46.2 (152) | 0.8 (0.5–1.3) |
| Race | ||||
| Non-Hispanic White | 28.8 (57) | 20.6 (27) | 25.5 (84) | 1.6 (0.9–2.6) |
| Non-Hispanic Black/African American | 17.7 (35) | 20.6 (27) | 18.8 (62) | 0.9 (0.5–1.4) |
| Other1 | 9.1 (18) | 9.9 (13) | 9.4 (31) | 0.9 (0.4–2.0) |
| Education/ | ||||
| Some college or above | 72.7 (144) | 66.4 (87) | 70.2 (231) | 1.3 (0.8–2.2) |
| Employment History | ||||
| Employed | 55.6 (110) | 49.6 (65) | 53.2 (175) | 1.3 (0.8–2.0) |
| Relationship | ||||
| Single | 52.0 (103) | 50.4 (66) | 51.4 (169) | 1.1 (0.7–1.7) |
| Drove car (past 90 days) | ||||
| Yes | 77.3 (153) | 80.2 (105) | 78.4 (258) | 0.8 (0.5–1.4) |
| Purchased marijuana products from storefront (past 90 days) | ||||
| Yes | 99.0 (196) | 16.0 (21) | 66.0 (217) | 513.3 (118.1–2230.5)*** |
| Money spent on marijuana products (past 90 days) | ||||
| mean (sd) | 576.6 (749.3) | 299.7 (580.6) | 466.3 (699.5) | t (319) = 3.76a*** |
| Number of sources used to obtain marijuana (past 90 days) | ||||
| mean (sd) | 6.6 (7.2) | 3.9 (4.1) | 5.5 (6.3) | t (322) = 4.37a*** |
| 90 Day Marijuana Use | ||||
| mean (sd) | 76.4 (21.7) | 62.0 (28.6) | 70.7 (25.6) | t (227) = 4.88a*** |
| 90 Day Hits per Day | ||||
| Mean (sd) | 25.5 (27.5) | 20.2 (24.8) | 23.4 (26.5) | t (297) = 1.80a*** |
Other includes Asian American and multiracial
p<0.001
Indicates t-test statistic (degrees of freedom)
We utilized multilevel Poisson random effect models (Agresti & Kateri, 2011) for 90-day marijuana among the sample of NPU and MMP (see Table 2), where the random effects were at the ZIP code level. These models allow for the inclusion of both individual-and ZIP code-level characteristics and an assessment of how these characteristics impact 90-day marijuana use. Model 1 included an overall fixed intercept, individual-level characteristics (gender, age, race/ethnicity, education, relationship status, employment, and past 90-day mode of transportation), and ZIP code-level random effects. Model 2 extended Model 1 to include individual-level marijuana use behaviors - purchasing marijuana products from storefronts, money spent on marijuana products, and number of sources of marijuana products – all within the past 90 days. Model 3 extended Model 2 to also include ZIP code-level characteristics, including marijuana dispensary density, race (non-Hispanic white, percent non-Hispanic African American, percent Hispanic), education (percentage with at least a high school diploma), age (18–24, 25–34, 35–44, 45–64, and > 65 years), and unemployment. To examine the potential interaction between MMP and NPU status and marijuana dispensary density, we also considered Model 4, which included this as an interaction term. Although we objectively compared all models using Akaike information criterion (AIC) (Sakamoto, Ishiguro, & Kitagawa, 1986), we also considered the improvement in our ZIP code-level variance components across all models. All models were assessed using the statistical package, R (R Core Team, 2015). Additinally, we conducted the same analyses with hits per day in the past 90 days as a secondary outcome variable (see Table 3),
Table 2.
Poisson random effect analyses of marijuana use in the past 90 days and individual- and ZIP code-level measures for all participants (N=329; 150 ZIP Codes)
| Model 1 | Model 2 | Model 3 | ||||||||||
|---|---|---|---|---|---|---|---|---|---|---|---|---|
| β | IRR | SE | p | β | IRR | SE | p | β | IRR | SE | p | |
| Individual Level: | ||||||||||||
| Intercept | −6.298 | 0.002 | 0.068 | <0.001 | −6.260 | 0.002 | 0.069 | <0.001 | 4.261 | 70.862 | 0.053 | <0.001 |
| Male | 0.059 | 1.060 | 0.021 | 0.006 | 0.006 | 1.006 | 0.022 | 0.780 | 0.003 | 1.003 | 0.021 | 0.893 |
| Age (reference: > 24 years) | ||||||||||||
| 21–23 years | −0.208 | 0.812 | 0.027 | <0.001 | −0.237 | 0.789 | 0.027 | <0.001 | −0.218 | 0.804 | 0.027 | <0.001 |
| 20 years and younger | −0.130 | 0.879 | 0.028 | <0.001 | −0.148 | 0.862 | 0.028 | <0.001 | −0.141 | 0.869 | 0.027 | <0.001 |
| Race/Ethnicity (reference: White, non-Hispanic) | ||||||||||||
| African American, non-Hispanic | 0.108 | 1.114 | 0.031 | <0.001 | 0.046 | 1.047 | 0.031 | 0.144 | 0.041 | 1.041 | 0.030 | 0.180 |
| Other (Asian Pacific Islander, non-Hispanic + Multi-racial) | −0.039 | 0.962 | 0.035 | 0.267 | −0.069 | 0.933 | 0.035 | 0.050 | −0.075 | 0.928 | 0.035 | 0.030 |
| Hispanic | 0.018 | 1.018 | 0.025 | 0.463 | −0.017 | 0.983 | 0.025 | 0.506 | −0.011 | 0.989 | 0.025 | 0.644 |
| Education: At least some college | −0.109 | 0.896 | 0.024 | <0.001 | −0.071 | 0.931 | 0.024 | 0.003 | −0.079 | 0.924 | 0.023 | 0.001 |
| Relationship status: single | 0.094 | 1.099 | 0.020 | <0.001 | 0.107 | 1.113 | 0.020 | <0.001 | 0.095 | 1.099 | 0.019 | <0.001 |
| Employed | 0.059 | 1.061 | 0.020 | 0.004 | 0.082 | 1.085 | 0.021 | <0.001 | 0.082 | 1.086 | 0.020 | <0.001 |
| Mode of transportation: driving (past 90 days) | −0.111 | 0.895 | 0.023 | <0.001 | −0.077 | 0.925 | 0.023 | 0.001 | −0.083 | 0.920 | 0.023 | <0.001 |
| MMP | 0.242 | 1.274 | 0.019 | <0.001 | 0.136 | 1.146 | 0.036 | <0.001 | 0.110 | 1.116 | 0.036 | 0.002 |
| Purchase MJ products from storefront (past 90 days) | 0.045 | 1.046 | 0.037 | 0.231 | 0.072 | 1.074 | 0.037 | 0.051 | ||||
| Money spent on MJ products (past 90 days) | 0.105 | 1.111 | 0.009 | <0.001 | 0.099 | 1.104 | 0.009 | <0.001 | ||||
| Number of difference sources to obtain MJ products (past 90 days) | 0.090 | 1.094 | 0.009 | <0.001 | 0.088 | 1.092 | 0.009 | <0.001 | ||||
| ZIP Code Level: | ||||||||||||
| Density of marijuana dispensaries (per square mile) | 0.029 | 1.030 | 0.029 | 0.320 | ||||||||
| % non-Hispanic white | 0.032 | 1.033 | 0.045 | 0.471 | ||||||||
| % non-Hispanic African American | −0.038 | 0.963 | 0.051 | 0.463 | ||||||||
| % Hispanic | −0.057 | 0.944 | 0.073 | 0.433 | ||||||||
| % at least a high school diploma | −0.079 | 0.924 | 0.075 | 0.291 | ||||||||
| % age 18–24 years | −0.100 | 0.905 | 0.061 | 0.104 | ||||||||
| % age 25–34 years | −0.030 | 0.970 | 0.046 | 0.504 | ||||||||
| % age 35–44 years | −0.050 | 0.951 | 0.048 | 0.291 | ||||||||
| % age 45–64 years | −0.023 | 0.977 | 0.062 | 0.709 | ||||||||
| % age 65 years and over | −0.060 | 0.942 | 0.046 | 0.199 | ||||||||
| % unemployed | −0.012 | 0.988 | 0.038 | 0.758 | ||||||||
| Fit Statistics: | ||||||||||||
| Random Intercept Variance | 0.354 | 0.359 | 0.090 | |||||||||
| AIC | 4881.400 | 4637.900 | 4485.600 |
IRR = Incidence Rate Ratio = Exp(β); SE = Standard Error; MMP = medical marijuana patient; AIC = Akaike Information Criterion
Table 3.
Poisson random effect analyses of hits per day in the past 90 days and individual- and ZIP code-level measures for all participants (N=329; 150 ZIP Codes)
| Model 1 | Model 2 | Model 3 | ||||||||||
|---|---|---|---|---|---|---|---|---|---|---|---|---|
| β | IRR | SE | p | β | IRR | SE | p | β | IRR | SE | p | |
| Individual Level: | ||||||||||||
| Intercept | −8.145 | 0.000 | 0.121 | <0.001 | −7.846 | 0.000 | 0.120 | <0.001 | 2.680 | 14.590 | 0.117 | <0.001 |
| Male | 0.436 | 1.546 | 0.039 | <0.001 | 0.274 | 1.315 | 0.041 | <0.001 | 0.270 | 1.309 | 0.041 | <0.001 |
| Age (reference: > 24 years) | ||||||||||||
| 21–23 years | 0.042 | 1.043 | 0.051 | 0.411 | −0.107 | 0.898 | 0.052 | 0.040 | −0.103 | 0.902 | 0.052 | 0.047 |
| 20 years and younger | 0.110 | 1.116 | 0.054 | 0.041 | −0.011 | 0.989 | 0.054 | 0.838 | 0.000 | 1.000 | 0.054 | 0.998 |
| Race/Ethnicity (reference: White, non-Hispanic) | ||||||||||||
| African American, non-Hispanic | 0.724 | 2.063 | 0.055 | <0.001 | 0.484 | 1.623 | 0.058 | <0.001 | 0.476 | 1.610 | 0.058 | <0.001 |
| Other (Asian Pacific Islander, non-Hispanic + Multi-racial) | −0.389 | 0.678 | 0.069 | <0.001 | −0.443 | 0.642 | 0.069 | <0.001 | −0.447 | 0.640 | 0.069 | <0.001 |
| Hispanic | −0.009 | 0.991 | 0.043 | 0.838 | −0.129 | 0.879 | 0.046 | 0.005 | −0.120 | 0.886 | 0.046 | 0.008 |
| Education: At least some college | −0.067 | 0.935 | 0.044 | 0.125 | 0.039 | 1.040 | 0.046 | 0.394 | 0.031 | 1.032 | 0.045 | 0.491 |
| Relationship status: single | 0.086 | 1.090 | 0.036 | 0.017 | 0.099 | 1.104 | 0.037 | 0.007 | 0.098 | 1.103 | 0.037 | 0.008 |
| Employed | −0.101 | 0.904 | 0.035 | 0.004 | −0.119 | 0.888 | 0.036 | 0.001 | −0.114 | 0.892 | 0.036 | 0.002 |
| Mode of transportation: driving (past 90 days) | −0.048 | 0.953 | 0.041 | 0.240 | −0.057 | 0.944 | 0.042 | 0.176 | −0.069 | 0.934 | 0.042 | 0.104 |
| MMP | 0.140 | 1.151 | 0.034 | <0.001 | −0.080 | 0.924 | 0.062 | 0.201 | −0.088 | 0.915 | 0.062 | 0.154 |
| Purchase MJ products from storefront (past 90 days) | 0.096 | 1.101 | 0.063 | 0.125 | 0.099 | 1.104 | 0.063 | 0.113 | ||||
| Money spent on MJ products (past 90 days) | 0.294 | 1.342 | 0.015 | <0.001 | 0.289 | 1.335 | 0.015 | <0.001 | ||||
| Number of difference sources to obtain MJ products (past 90 days) | 0.078 | 1.081 | 0.015 | <0.001 | 0.081 | 1.084 | 0.015 | <0.001 | ||||
| ZIP Code Level: | ||||||||||||
| Density of marijuana dispensaries (per square mile) | 0.095 | 1.099 | 0.078 | 0.224 | ||||||||
| % non-Hispanic white | 0.053 | 1.055 | 0.119 | 0.654 | ||||||||
| % non-Hispanic African American | 0.078 | 1.081 | 0.137 | 0.567 | ||||||||
| % Hispanic | 0.007 | 1.008 | 0.193 | 0.969 | ||||||||
| % at least a high school diploma | −0.018 | 0.982 | 0.197 | 0.928 | ||||||||
| % age 18–24 years | −0.330 | 0.719 | 0.164 | 0.045 | ||||||||
| % age 25–34 years | −0.041 | 0.960 | 0.121 | 0.735 | ||||||||
| % age 35–44 years | −0.147 | 0.863 | 0.127 | 0.245 | ||||||||
| % age 45–64 years | −0.228 | 0.796 | 0.165 | 0.168 | ||||||||
| % age 65 years and over | −0.014 | 0.986 | 0.123 | 0.911 | ||||||||
| % unemployed | −0.067 | 0.935 | 0.101 | 0.508 | ||||||||
| Fit Statistics: | ||||||||||||
| AIC | 2133.400 | 2118.700 | 1942.000 | |||||||||
| Random Intercept Variance | 0.433 | 0.390 | 0.115 |
IRR = Incidence Rate Ratio = Exp(β); SE = Standard Error; MMP = medical marijuana patient; AIC = Akaike Information Criterion
Results
Table 1 presents demographic and descriptive characteristics for key variables in this analysis as well as unadjusted odds ratios and t-tests comparing MMP and NPU. Overall, the sample was typically early 20s, male, Hispanic, college educated, employed, single, and drove a car in the past 90 days (no significant differences between MMP and NPU among these variables). Regarding recent marijuana behavior variables, MMP reported significantly greater odds of purchasing marijuana products from a storefront than NPU as well as significantly greater money spent and number of marijuana sources in the past 90 days compared to NPU. Regarding the outcome variable of interest – 90-day marijuana use – MMP reported significantly greater days of use compared to NPU. MMP also reported significant greater hits per day in the past 90 days than NPU.
Table 2 displays the results of the Poisson random effect analyses for all MMPs and NPUs (N=329; 150 ZIP codes), which included individual as well as ZIP code-level characteristics and how these relate to days of marijuana use in the past 90 days. The estimated β’s, incidence rate ratios (IRR), calculated as Exp(β), standard errors (SE), and p-values for three models are presented. The AIC is also presented, where Model 3 resulted in the smallest AIC (4485.600). Model 3 emerged as having the best tradeoff between model fit and model complexity. Also, we found that the ZIP code-level random intercept variance component noticeably decreased as we sequentially included not only individual-level measures, but also ZIP code-level measures; therefore, our final model of interest is Model 3. MMPs reported greater days of marijuana use in the past 90 days, such that they were 12% (IRP = 1.116; p = 0.002) more likely to have greater days, compared to NPUs. Those participants who were single (p < 0.001) and employed (p < 0.001) also reported greater days of marijuana use. Participants who purchased marijuana products from a storefront dispensary, spent more money on marijuana products, and obtained marijuana from a greater number of different sources reported more days of marijuana use in the past 90 days. Specifically, participants who purchased marijuana products from a storefront were 7% (IRP = 1.116; p = 0.002) more likely to report greater days compared to participants who purchase by other means such as delivery services, friends/family, drug sellers, etc. Each additional dollar spent on marijuana products resulted in a 10% (IRP = 1.074; p = 0.051)increase in the average number of days of marijuana use in the past 90 days. Each additional source used to obtain marijuana products also related to a 9% (IRP = 1.104; p = 0.001) increase in the average number of days of marijuana use. Participants that were younger (21–23 years and 20 years or younger; p < 0.001), non-Hispanic Asian Pacific Islander or multi-racial (p = 0.030), described having at least some college background (p = 0.001), and listed driving as their primary mode of transportation (p = 0.001) reported significantly less days of marijuana usage. None of the ZIP code-level characteristics, including density of medical marijuana dispensaries per square mile, were significantly related to 90-day use of marijuana. Model 4 (results not shown) did not significantly change from those of Model 3, and the interaction term between MMP vs. NPU and marijuana dispensary density was not statistically significant.
Our secondary analyses using hits per day in the past 90 days as the outcome is presented in Table 3. Similar trends were found, however there were some additional findings. Participants who were male (p < 0.001), African American (p = 0.001), single (p = 0.008), in addition to those who spent more money on marijuana products (p < 0.001), and obtained marijuana from a greater number of different sources (p < 0.001) also reported significantly more hits of marijuana per day in the past 90 days. Participants who were 21–23 years (p = 0.047), non-Hispanic Asian Pacific Islander or multi-racial (p < 0.001), Hispanic (p = 0.008), employed (p = 0.002), as well as those living in ZIP codes with greater percentages of 18–24 year old’s (p = 0.045) reported significantly fewer hits per days. Model 4 (results not shown) did not significantly change from those of Model 3; however, the interaction term between MMP vs. NPU and marijuana dispensary density was marginally statistically significant (p = 0.059), although both the main effects of MMP status and marijuana dispensary density were not statistically significant (p = 0.109 and p = 0.089, respectively).
We also examined the same models above, but with marijuana dispensary density defined two different ways: relative to the population in 2015, and relative to roadway mileage (data not shown). Sensitivity analyses did not result in significant differences from the findings presented in Tables 2 or 3, where most notably, dispensary density did not significantly predict marijuana use in the past 90 days (days or hits per day)– even after adjusting for individual- and other ZIP code-level characteristics.
Discussion
This is the first study to analyze the relationship between density of medical marijuana dispensaries and recent marijuana use among a sample of young adult MMP and NPU. Our analyses revealed that density of medical marijuana dispensaries per square mile in Los Angeles ZIP code areas was not associated with 90-day use of marijuana (days of use or hits per day) for MMP or NPU in this sample. In other words, the concentration of medical marijuana dispensaries – the retail marijuana environment - surrounding participants in our sample was unrelated to frequency of marijuana use irrespective of having a medical marijuana recommendation or not.
Our findings are in contrast to statewide results in 50 mid-sized California cities (Freisthler & Gruenwald, 2014), which found greater dispensary density was associated with greater number of days of marijuana use in the past year among adults. The data for this other analysis, however, did not capture whether respondents were medical marijuana patients or not, nor did it include cities with a population greater than 500,000, such as Los Angeles. Also, our results are in contrast to overall trends in research on tobacco (e.g., Henriksen et al., 2008; Lipperman-Kreda et al., 2012) and alcohol use (Rowland et al., 2016; Shih et al., 2015) among young adults, which found that rates of alcohol or tobacco use were higher in locations where density of alcohol or tobacco outlets was greater. However, those studies often use prevalence rather than frequency or quantity of tobacco or alcohol consumption as an outcome (Rowland et al., 2016, Shih et al., 2015) or report results among lifetime rather than current users of tobacco or alcohol (Lipperman-Kreda, 2012).
Rather, our results extend the results of a study of adolescents in 18 medical marijuana states, which found no relationship between proximity to medical marijuana dispensaries and current use of marijuana (Shi, 2016). Our results are also consistent with a California-based study of high school students (Henriksen et al, 2008) that did not find an association between retailer density and the quantity of cigarettes smoked in the past month among smokers, and a study of adult alcohol users in Los Angeles, which found no relationship between density and quantity of alcohol consumed (Schonlau et al., 2008). As in this alcohol study, one possible explanation for the lack of relationship is that a high proportion of Los Angeles residents drive cars, which could make the immediate proximal environment less impactful on marijuana use. In our sample of young adults, over three-quarters had driven a car in the past 90 days while recent driving was negatively associated with days of use. This suggests that having the ability to drive to dispensaries outside one’s neighborhood did not result in greater days of use. Related, rather than choosing a dispensary based upon geographic proximity, MMP more often decide to patronize a medical marijuana dispensary based upon factors such as knowledgeable staff, price, and quality (Kioumarsi et al. 2018). Furthermore, other research on MMP in Los Angeles report that patients often travel to dispensaries outside of their neighborhood or community (Cooke, Freisthler, & Mulholland, 2018).
Medical marijuana dispensaries are a source of diverted marijuana for NPU (Boyd, Veliz, & McCabe, 2015; Lankenau et al., 2017; Reed et al., in press; Thurstone, Lieberman, & Schmiege, 2011). In the current analysis, we reported that 16.0% of NPU reported buying marijuana products from a dispensary in the past 90 days. It is notable that density of medical marijuana dispensaries was not related to 90-day use of marijuana among NPU. This suggests that the presence of medical marijuana dispensaries did not result in greater use of marijuana either due to the availability of diverted marijuana or other factors that may normalize marijuana use, such as seeing dispensaries in a neighborhood.
MMP report greater days of marijuana use and spend more money on marijuana products than NPU (Lankenau et al., 2017). In addition to buying from dispensaries, other sources of marijuana include delivery services, friends/family, drug sellers, etc. MMP (averaging 6.6 marijuana sources) were found to have a significantly greater number of sources compared to NPU (averaging 3.9 marijuana sources) (Lankenau et al., 2017). A greater number of marijuana sources was associated with significantly greater days of marijuana use for this sample. Neither MMP or NPU rely primarily on storefront dispensaries for marijuana (Reed et al., in press), which made the immediate marijuana environment less impactful on days of use.
Including hits per day in the past 90 days as a secondary outcome confirmed the lack of association between density and days marijuana use in the past 90 days. Hits per day is an approximate indicator of intensity of use (including number of using events) since marijuana is not typically consumed in standardized quantities compared to alcohol or tobacco, e.g., 12 ounce beer, cigarette. Recent marijuana practices, such as purchasing marijuana products from a dispensary storefront, money spent, and number of different sources, were positively associated with 90 day marijuana use in both analyses. However, MMP did not consume more hits per day than NPU in the full model, which is in contrast results pertaining to the days of use. This suggest that MMP use on more days than NPU but intensity of use is no different between the two groups. Also, racial/ethnic differences emerged that were not found the days of use analysis: African Americans reported significant greater hits per day compared to whites, while Hispanics reported significantly fewer hits compared to non-Hispanics. These results could reflect the fact that blunts, which typically contain more marijuana than joints or other modes, are a common way of consuming marijuana among African American young adults (Sifaneck, Johnson, & Dunlap, 2005). Some studies suggest lower acceptability of marijuana use among Hispanic communities compared to non-Hispanic communities (Brook et al. 2001; Brownell, 1988), which could explain less frequent use in the sample.
As states continue to legalize marijuana for medical and personal use, marijuana will increasingly become available to adult and young adult users via dispensaries that sell marijuana for medical and/or personal use (Freisthler & Gruenewald, 2014). With greater availability of marijuana sold via storefronts, the possibility of diversion of marijuana to NPU or underage adults also increases (Thurstone et al., 2011; Boyd et al., 2015; Reed et al., in press). The results of our analysis suggest that the proximity between locations of medical marijuana dispensaries and residential locations of young adult marijuana users is not related to recent use of marijuana regardless of status as a medical marijuana patient. Based upon these results, one could infer that the arrival of new marijuana dispensaries into neighborhoods and subsequent concentration of dispensaries in particular locations will not impact use of marijuana use among current marijuana users who live in areas with the greatest density of dispensaries – including those who cannot legally purchase marijuana from nearby dispensaries. Moreover, the trending importance of home delivery for a variety of household products, including marijuana, may render storefront locations or concentrations of marijuana storefronts less impactful on recent marijuana use.
This study has several limitations. First, all data on marijuana use is based upon self-report among current young adult marijuana users and subject to recall and social desirability biases. Second, due to missing observations, 10.1% of the original sample was excluded from the final analysis. However, a subsequent analysis determined that missing cases were not significantly different from cases retained in the final analysis along key dimensions. Third, the marijuana environment described in this analysis - hundreds of dispensaries spread out across an urban area that is heavily automobile dependent – may be unique to Los Angeles and difficult to generalize to other settings. However, as dispensaries begin to proliferate across communities as marijuana continues to be legalized for personal use, Los Angeles may be viewed as less of an outlier overtime. Fourth, participants’ residence is based upon their residence ZIP code and not their full address as we did not collect their full address due to prospect confidentially issues. Finally, due to the lack of a national or state level data on medical marijuana dispensaries’ information, our approach to gather dispensaries data through popular websites available in the internet might be considered as a limitation to the collection and presentation of an accurate number of medical marijuana dispensaries operating within the City of Los Angeles.
Conclusion
Density of medical marijuana dispensaries was not associated with recent use of marijuana for either MMP or NPU in this sample of young adult marijuana users in Los Angeles. These results are in contrast to other studies which more commonly find a relationship between density of an outlet, e.g., alcohol, tobacco, medical marijuana, and recent substance use. Rather, individual factors related to consumer choices and behaviors were more important in determining recent marijuana use among this sample of MMP and NPU.
Supplementary Material
Acknowledgements
The authors would like to acknowledge the following individuals who supported the development of this manuscript: Miles McNeely, Meghan Treese, Ali Johnson, Chaka Dodson, Maral Shahinian, Megan Reed, and Ekaterina Fedorova. Also, the authors would like to acknowledge input provided by the project’s Community Advisory Board. The research presented in this manuscript is that of the authors and does not reflect the official policy of the NIH. Development of this manuscript was supported by grants from the National Institute on Drug Abuse (NIDA): DA034067 and DA034067-S1.
Footnotes
No conflicts of interest were reported by the authors.
References
- 1.Agresti A, & Kateri M (2011). Categorical data analysis. In Lovric M (Ed.), International encyclopedia of statistical science (pp. 206–208). Berlin, Germany: Springer-Verlag. [Google Scholar]
- 2.Azofeifa A, Mattson ME, Schauer G, McAfee T, Grant A, & Lyerla R (2016). National estimates of marijuana use and related indicators — National Survey on Drug Use and Health, United States, 2002–2014. MMWR Surveillance Summaries, 65(11), 1–25. doi: 10.15585/mmwr.ss6511a [DOI] [PubMed] [Google Scholar]
- 3.Berg CJ, Henriksen L, Cavazos-Rehg P, Haardoerfer R, & Freisthler B (2018). The emerging marijuana retail environment: Key lessons learned from tobacco and alcohol retail research. Addictive Behaviors, 81, 26–31. [DOI] [PMC free article] [PubMed] [Google Scholar]
- 4.Biernacki P, & Waldorf D (1981). Snowball sampling: problems, techniques and chain-referral sampling. Sociological Methods and Research, 10(2), 141–163. [Google Scholar]
- 5.Boyd CJ, Veliz PT, & McCabe SE (2015). Adolescents’ use of medical marijuana: A secondary analysis of Monitoring the Future data. Journal of Adolescent Health, 57(2), 241–244. [DOI] [PMC free article] [PubMed] [Google Scholar]
- 6.Brook JS, Brook DW, Arencibia-Mireles O, Richter L, & Whiteman M (2001). Risk factors for adolescent marijuana use across cultures and across time. J Genet Psychol, 162(3), 357–374. [DOI] [PubMed] [Google Scholar]
- 7.Brownell GS (1988). Marijuana and the law in California: A historical and political overview. Journal of Psychoactive Drugs, 20(1), 71–74. [DOI] [PubMed] [Google Scholar]
- 8.Cameron MP, Cochrane W, Gordon C, & Livingston M (2016). Alcohol outlet density and violence: a geographically weighted regression approach. Drug and Alcohol Review, 35(3), 280–288. [DOI] [PubMed] [Google Scholar]
- 9.Cantrell J, Pearson JL, Anesetti-Rothermel A, Xiao H, Kirchner TR, & Vallone D (2016). Tobacco retail outlet density and young adult tobacco initiation. Nicotine & Tobacco Research, 18(2), 130–137. [DOI] [PMC free article] [PubMed] [Google Scholar]
- 10.Center for Behavioral Health Statistics and Quality (2017). Results from the 2016 National Survey on Drug Use and Health: Detailed Tables Rockville, MD: Substance Abuse and Mental Health Services Administration; Retrieved from https://www.samhsa.gov/data/sites/default/files/NSDUH-DetTabs-2016/NSDUH-DetTabs-2016.pdf [Google Scholar]
- 11.Chatterjee S, & Hadi AS (2012). Regression analysis by example (5th ed.). Hoboken, NJ: John Wiley & Sons. [Google Scholar]
- 12.Contreras C (2017). A Block-Level Analysis of Medical Marijuana Dispensaries and Crime in the City of Los Angeles. Justice Quarterly, 34(6), 1069–1095. [Google Scholar]
- 13.Cooke A, Freisthler B & Mulholland E (2018). Examination of market segmentation among medical marijuana dispensaries. Substance Use & Misuse, 53(9), 1463–1467. [DOI] [PMC free article] [PubMed] [Google Scholar]
- 14.DiMaggio C, Mooney S, Frangos S, & Wall S (2016). Spatial analysis of the association of alcohol outlets and alcohol-related pedestrian/bicyclist injuries in New York City. Injury Epidemiology, 3(1), 1–10. doi: 10.1186/s40621-016-0076-5 [DOI] [PMC free article] [PubMed] [Google Scholar]
- 15.Finan LJ, Lipperman-Kreda S, Abadi M, Grube JW, Kaner E, Balassone A, & Gaidus A (2018). Tobacco outlet density and adolescents’ cigarette smoking: a meta-analysis. Tobacco Control Advance online publication. doi: 10.1136/tobaccocontrol-2017-054065 [DOI] [PMC free article] [PubMed] [Google Scholar]
- 16.Freisthler B, Gaidus A, Tam C, Ponicki WR, & Gruenewald PJ (2017). From medical to recreational marijuana sales: Marijuana outlets and crime in an era of changing marijuana legislation. The Journal of Primary Prevention, 38(3), 249–263. [DOI] [PMC free article] [PubMed] [Google Scholar]
- 17.Freisthler B, & Gruenewald PJ (2014). Examining the relationship between the physical availability of medical marijuana and marijuana use across fifty California cities. Drug and Alcohol Dependence, 143, 244–250. [DOI] [PMC free article] [PubMed] [Google Scholar]
- 18.Freisthler B, Ponicki WR, Gaidus A, & Gruenewald PJ (2016). A micro-temporal geospatial analysis of medical marijuana dispensaries and crime in Long Beach, California. Addiction, 111(6), 1027–1035. [DOI] [PMC free article] [PubMed] [Google Scholar]
- 19.Furr-Holden CDM, Milam AJ, Nesoff ED, Johnson RM, Fakunle DO, Jennings JM, & Thorpe RJ Jr (2016). Not in my back yard: a comparative analysis of crime around publicly funded drug treatment centers, liquor stores, convenience stores, and corner stores in one mid-Atlantic city. Journal of Studies on Alcohol and Drugs, 77(1), 17–24. [DOI] [PMC free article] [PubMed] [Google Scholar]
- 20.Gorman DM, Ponicki WR, Zheng Q, Han D, Gruenewald PJ, & Gaidus AJ (2018). Violent crime redistribution in a city following a substantial increase in the number of off-sale alcohol outlets: A Bayesian analysis. Drug and Alcohol Review, 37(3), 348–355. [DOI] [PMC free article] [PubMed] [Google Scholar]
- 21.Harris PA, Taylor R, Thielke R, Payne J, Gonzalez N, & Conde JG (2009). Research electronic data capture (REDCap)—a metadata-driven methodology and workflow process for providing translational research informatics support. Journal of Biomedical Informatics, 42(2), 377–381. [DOI] [PMC free article] [PubMed] [Google Scholar]
- 22.Henriksen L, Feighery EC, Schleicher NC, Cowling DW, Kline RS, & Fortmann SP (2008). Is adolescent smoking related to the density and proximity of tobacco outlets and retail cigarette advertising near schools? Preventive Medicine, 47(2), 210–214. [DOI] [PubMed] [Google Scholar]
- 23.Kann L, McManus T, Harris WA, Shanklin SL, Flint KH, Hawkins J, … Zaza S (2016). Youth Risk Behavior Surveillance - United States, 2015. MMWR Surveillance Summaries, 65(6), 1–174. doi: 10.15585/mmwr.ss6506a1. [DOI] [PubMed] [Google Scholar]
- 24.Kepple NJ, & Freisthler B (2012). Exploring the ecological association between crime and medical marijuana dispensaries. Journal of Studies on Alcohol and Drugs, 73(4), 523–530. [DOI] [PMC free article] [PubMed] [Google Scholar]
- 25.Kioumarsi A, Massey PM, Roth AM, Wong CF, Iverson E, & Lankenau SE (2018). Medical marijuana dispensaries in Los Angeles: Access and service among young adults Manuscript submitted for publication.
- 26.Kypri K, Bell ML, Hay GC, & Baxter J (2008). Alcohol outlet density and university student drinking: A national study. Addiction, 103, 1131–1138. [DOI] [PubMed] [Google Scholar]
- 27.Lankenau SE, Schrager S, Silva K, Kecojevic A, Jackson Bloom J, Wong C, & Iverson E (2012). Prescription and illicit drug use among high-risk young adults in Los Angeles and New York. Journal of Public Health Research, 1,1–9. [DOI] [PMC free article] [PubMed] [Google Scholar]
- 28.Lankenau SE, Fedorova EV, Reed M, Schrager SM, Iverson E, & Wong CF (2017). Marijuana practices and patterns of use among young adult medical marijuana patients and non-patient marijuana users. Drug and Alcohol Dependence, 170, 181–188. [DOI] [PMC free article] [PubMed] [Google Scholar]
- 29.Larsen K, To T, Irving HM, Boak A, Hamilton HA, Mann RE, …& Faulkner GE (2017). Smoking and binge-drinking among adolescents, Ontario, Canada: Does the school neighbourhood matter? Health & Place, 47, 108–114. [DOI] [PubMed] [Google Scholar]
- 30.Lipperman-Kreda S, Grube JW, & Friend KB (2012). Local tobacco policy and tobacco outlet density: associations with youth smoking. Journal of Adolescent Health, 50(6), 547–552. [DOI] [PMC free article] [PubMed] [Google Scholar]
- 31.Lipperman-Kreda S, Grube JW, Friend KB, & Mair C (2015). Tobacco outlet density, retailer cigarette sales without ID checks and enforcement of underage tobacco laws: associations with youths’ cigarette smoking and beliefs. Addiction, 111(3), 525–532. [DOI] [PMC free article] [PubMed] [Google Scholar]
- 32.Lipperman-Kreda S, Lee JP, Morrison C, & Freisthler B (2014). Availability of tobacco products associated with use of marijuana cigars (blunts). Drug and Alcohol Dependence, 134, 337–342. [DOI] [PMC free article] [PubMed] [Google Scholar]
- 33.Mair C, Freisthler B, Ponicki WR, & Gaidus A (2015). The impacts of marijuana dispensary density and neighborhood ecology on marijuana abuse and dependence. Drug and Alcohol Dependence, 154, 111–116. [DOI] [PMC free article] [PubMed] [Google Scholar]
- 34.McCarthy WJ, Mistry R, Lu Y, Patel M, Zheng H, & Dietsch B (2009). Density of tobacco retailers near schools: effects on tobacco use among students. American Journal of Public Health, 99, 2006–2013. [DOI] [PMC free article] [PubMed] [Google Scholar]
- 35.Mennis J, & Mason M (2016). Tobacco outlet density and attitudes towards smoking among urban adolescent smokers. Substance Abuse, 37(4), 521–525. [DOI] [PubMed] [Google Scholar]
- 36.Mennis J, Mason M, Way T, & Zaharakis N (2016). The role of tobacco outlet density in a smoking cessation intervention for urban youth. Health & Place, 38, 39–47. [DOI] [PubMed] [Google Scholar]
- 37.Nesoff ED, Milam AJ, Pollack KM, Curriero FC, Bowie JV, Knowlton AR, … & Furr-Holden DM (2018). Neighbourhood alcohol environment and injury risk: a spatial analysis of pedestrian injury in Baltimore City. Injury Prevention Advance online publication. doi: 10.1136/injuryprev-2018-042736 [DOI] [PMC free article] [PubMed] [Google Scholar]
- 38.R Core Team (2015). R: A language and environment for statistical computing Vienna, Austria: R Foundation for Statistical Computing; Retrieved from https://www.R-project.org/ [Google Scholar]
- 39.Reed M, Kioumarsi A, Ataiants J, Fedorova E, Iverson E, Wong CF, & Lankenau SE (2018). Marijuana sources among a cohort of young adult marijuana users in Los Angeles, California Manuscript submitted for publication. [DOI] [PMC free article] [PubMed]
- 40.Register CA, & Williams DR (1992). Labor market effects of marijuana and cocaine use among young men. Industrial and Labor Relations Review, 45(3), 435–448. [Google Scholar]
- 41.Rowland B, Evans-Whipp T, Hemphill S, Leung R, Livingston M, & Toumbourou JW (2016). The density of alcohol outlets and adolescent alcohol consumption: An Australian longitudinal analysis. Health & Place, 37, 43–49. [DOI] [PubMed] [Google Scholar]
- 42.Sakamoto Y, Ishiguro M, & Kitagawa G (1986). Akaike information criterion statistics Dordrecht, the Netherlands: D. Reidel Publishing Company. [Google Scholar]
- 43.Schleicher NC, Johnson TO, Fortmann SP, & Henriksen L (2016). Tobacco outlet density near home and school: Associations with smoking and norms among US teens. Preventive Medicine, 91, 287–293. [DOI] [PMC free article] [PubMed] [Google Scholar]
- 44.Schonlau M, Scribner R, Farley TA, Theall KP, Bluthenthal RN, Scott M, & Cohen DA (2008). Alcohol outlet density and alcohol consumption in Los Angeles County and Southern Louisiana. Geospatial Health, 3(1), 91–101. [DOI] [PMC free article] [PubMed] [Google Scholar]
- 45.Shi Y (2016). The availability of medical marijuana dispensary and adolescent marijuana use. Preventive Medicine, 91, 1–7. [DOI] [PubMed] [Google Scholar]
- 46.Shih RA, Mullins L, Ewing BA, Miyashiro L, Tucker JS, Pedersen ER, … & D’Amico EJ (2015). Associations between neighborhood alcohol availability and young adolescent alcohol use. Psychology of Addictive Behaviors, 29(4), 950–959. [DOI] [PMC free article] [PubMed] [Google Scholar]
- 47.Sifaneck SJ, Johnson BD, & Dunlap E (2005). Cigars-for-blunts: choice of tobacco products by blunt smokers. Journal of Ethnicity and Substance Abuse, 4, 23–42. [DOI] [PubMed] [Google Scholar]
- 48.Snowden AJ (2016). Alcohol outlet density and intimate partner violence in a nonmetropolitan college town: accounting for neighborhood characteristics and alcohol outlet types. Violence and Victims, 31(1), 111–123. [DOI] [PubMed] [Google Scholar]
- 49.Subica AM, Douglas JA, Kepple NJ, Villanueva S, & Grills CT (2018). The geography of crime and violence surrounding tobacco shops, medical marijuana dispensaries, and off-sale alcohol outlets in a large, urban low-income community of color. Preventive Medicine, 108, 8–16. [DOI] [PubMed] [Google Scholar]
- 50.Substance Abuse and Mental Health Services Administration (2017). Key substance use and mental health indicators in the United States: Results from the 2016 National Survey on Drug Use and Health (HHS Publication No. SMA 17–5044, NSDUH Series H-52) Rockville, MD: Center for Behavioral Health Statistics and Quality, Substance Abuse and Mental Health Services Administration. Retrieved from https://www.samhsa.gov/data/sites/default/files/NSDUH-FFR1-2016/NSDUH-FFR1-2016.htm [Google Scholar]
- 51.Thomas C, & Freisthler B (2016). Examining the locations of medical marijuana dispensaries in Los Angeles. Drug and Alcohol Review, 35, 334–337. [DOI] [PMC free article] [PubMed] [Google Scholar]
- 52.Thurstone C, Lieberman SA, & Schmiege SJ (2011). Medical marijuana diversion and associated problems in adolescent substance treatment. Drug and Alcohol Dependence, 118(2–3), 489–492. [DOI] [PMC free article] [PubMed] [Google Scholar]
- 53.Tice P (2013). Substance Use among 12th Grade Aged Youths by Dropout Status (The CBHSQ Report) Rockville, MD: Substance Abuse and Mental Health Services Administration; Retrieved from https://www.ncbi.nlm.nih.gov/books/NBK384679/ [PubMed] [Google Scholar]
- 54.Troung KD, & Sturm R (2009). Alcohol environments and disparities in exposure associated with adolescent drinking in California. American Journal of Public Health, 99, 264–270. [DOI] [PMC free article] [PubMed] [Google Scholar]
- 55.UCLA Medical Marijuana Research (2015). Distribution of medical marijuana dispensaries from 2007 to 2014, Los Angeles, CA (Research Brief 2015 – 01) Retrieved from http://www.uclamedicalmarijuanaresearch.com/sites/default/files/MMD_ResearchBrief1v5.pdf
- 56.U.S. Census Bureau (2014). 2010–2014 American Community Survey 5-Year Estimates Retrieved from https://factfinder.census.gov/faces/tableservices/jsf/pages/productview.xhtml?src=bkmk
- 57.Watters JK, & Biernacki P (1989). Targeted sampling: options for the study of hidden populations. Social Problems, 36(4), 416–430. [Google Scholar]
- 58.Zakrzewski WJ, Wheeler AP & Thompson AJ (2019) Cannabis in the capital: exploring the spatial association between medical marijuana dispensaries and crime, Journal of Crime and Justice, DOI: 10.1080/0735648X.2019.1582351 [DOI] [Google Scholar]
Associated Data
This section collects any data citations, data availability statements, or supplementary materials included in this article.