Significance
Chronic obstructive pulmonary disease (COPD) is an inflammatory disease characterized by limitation of expiratory airflow. Cellular and molecular pathways involved in disease pathogenesis are not completely defined. Our study reveals that metabolism and immune response cooperate in COPD pathogenesis and progression. COPD subjects with different disease stages showed progressive increase of systemic leptin, an adipose tissue-derived proinflammatory molecule, that, at high concentrations, impaired the capacity of T cells to engage in glycolysis and to generate regulatory T cells. Thus, the loss of these immunoregulatory circuits during COPD determined the hyperactivation of effector T cells that amplified inflammation, leading to progressive decline of lung function. Understanding these immunometabolic mechanisms can have important implications for monitoring COPD progression and for disease treatment.
Keywords: COPD, immunometabolism, leptin, regulatory T cells
Abstract
Chronic obstructive pulmonary disease (COPD) is an inflammatory condition associated with abnormal immune responses, leading to airflow obstruction. Lungs of COPD subjects show accumulation of proinflammatory T helper (Th) 1 and Th17 cells resembling that of autoreactive immune responses. As regulatory T (Treg) cells play a central role in the control of autoimmune responses and their generation and function are controlled by the adipocytokine leptin, we herein investigated the association among systemic leptin overproduction, reduced engagement of glycolysis in T cells, and reduced peripheral frequency of Treg cells in different COPD stages. These phenomena were also associated with an impaired capacity to generate inducible Treg (iTreg) cells from conventional T (Tconv) cells. At the molecular level, we found that leptin inhibited the expression of forkhead-boxP3 (FoxP3) and its splicing variants containing the exon 2 (FoxP3-E2) that correlated inversely with inflammation and weakened lung function during COPD progression. Our data reveal that the immunometabolic pathomechanism leading to COPD progression is characterized by leptin overproduction, a decline in the expression of FoxP3 splicing forms, and an impairment in Treg cell generation and function. These results have potential implications for better understanding the autoimmune-like nature of COPD and the pathogenic events leading to lung damage.
Chronic obstructive pulmonary disease (COPD) is a chronic inflammatory disease of the lung that causes airflow obstruction. The main cause of COPD in developed countries is tobacco smoking; however, genetic and environmental factors have also been implicated recently in its pathogenesis (1). Quantitative and qualitative alterations of B cells, cluster of differentiation 4+ (CD4+) T cells, and CD8+ T cells have been observed in both airways and blood of COPD subjects (1, 2). Recent experimental evidence corroborates the hypothesis that tobacco smoking can generate new self- and foreign epitopes may lead to the activation of an aberrant “autoreactive” immune response. These events lead to generation of proinflammatory T helper 1 (Th1) and Th17 CD4+ T cells in the lung of COPD subjects, resembling that of “proper” autoimmune diseases (3–6). In this context, immunopathogenesis of chronic inflammatory diseases and autoimmunity has been associated with both a hyperactivity of autoreactive T cells and the failure of local regulatory mechanisms mainly mediated by regulatory T (Treg) cells (7, 8). Treg cells are a subset of CD4+ T cells that express the transcription factor forkhead-box-P3 (FoxP3) and are involved in the maintenance of tolerance to self-antigens and abrogation of autoimmune responses (9). Compelling experimental evidence suggests that differentiation of Treg cells relies on multiple signals, such as those derived from cytokines (i.e., interleukin 2 [IL-2], transforming growth factor-β [TGF-β]), and signal strength from engagement of the T cell antigen receptor (TCR) and from the costimulatory molecules. Classically, the presence of TGF-β can induce the expression of FoxP3 in CD4+CD25− conventional T (Tconv) cells stimulated via strong TCR signaling, which leads to their conversion into inducible Treg (iTreg) cells (10, 11). However, cytokines can be dispensable in the generation of human iTreg cells, as fully suppressive iTreg cells can also be generated in vitro by suboptimal/low TCR stimulation of Tconv cells in a cytokine-independent manner (12–14). In this context, it has been shown that different cellular immunometabolic pathways are able to induce effector or regulatory responses, since distinct metabolic programs are required for the commitment of either effector or Treg cell responses (15, 16). Indeed, while Treg cells generated in vitro in the presence of TGF-β were shown to rely mainly on lipid oxidation (17), recent reports have also shown a major role for glycolysis in the induction and suppressive function of human and mouse Treg cells, given the capacity of the glycolytic enzyme enolase-1 to control the expression of specific FoxP3 splicing variants in human Treg cells (so-called “moon-lighting” functions) (14). Interestingly, in human autoimmunity (i.e., multiple sclerosis, type 1 diabetes), an impaired engagement of glycolysis upon suboptimal TCR stimulation of Tconv cells has been observed, and this is associated with a reduced suppressive function and generation of Treg cells (14). These data suggest that glycolysis also plays an unexplored role in Treg cell induction and function, and that its impairment leads to an unbalanced immune response leading to loss of self-immunological tolerance.
Among environmental factors linked with COPD, nutritional state and overweight have recently been taken into account as promoters of disease pathogenesis (18). Indeed, adipose tissue-derived proinflammatory cytokines could further contribute to the development of the disease, but the molecular mechanisms underlying these events are elusive. Indeed, leptin, whose circulating levels are proportional to body mass index (BMI) and adiposity, are able to boost Th1 and Th17, on the one side, and to reduce proliferation and expansion of antiinflammatory Treg cells, on the other (19–21). Leptin is a strong regulator of intracellular glucose metabolism and glycolysis, being among the top-ranked circulating factors, together with insulin, able to increase glucose entrance into the cells, thus suggesting a possible role for immunometabolism of Treg cells in the pathogenesis of COPD (22, 23). Further, it has recently been shown that plasma leptin concentrations exhibit an inverse correlation with lung function in COPD subjects (24, 25).
Building on the evidence that a strong relationship among FoxP3 expression, Treg cell induction, and glucose metabolism exists in human immune cells, we aimed at investigating the immunometabolic mechanisms linking leptin overproduction, reduced glucose utilization by T cells with loss of immunological self-tolerance, and chronic inflammation in COPD patients at different disease stages.
Results
Immunometabolic Profiling of COPD Patients Reveals an Increased Systemic Secretion of the Proinflammatory Adipocytokine Leptin That Is Linked with COPD Severity and Deteriorated Lung Function.
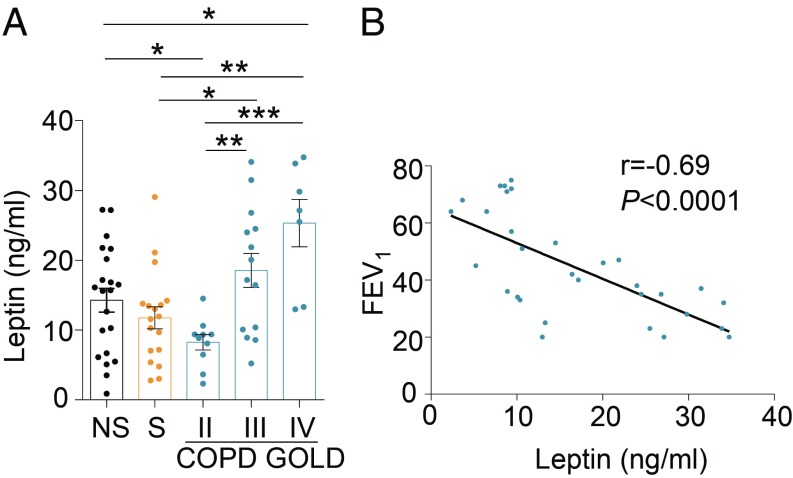
To depict the circulating immunometabolic asset and its link with circulating immune cells of COPD subjects, we analyzed several immune cell populations in the peripheral blood of COPD patients staged with parameters of the Global Initiative on Obstructive Lung Disease (GOLD; stages II to IV) and compared them with both never-smoker (NS) and smoker (S) healthy controls. Multiparametric cytofluorimetric analysis showed no statistically significant differences in circulating cellular subsets between control populations and COPD subjects at different GOLD stages (SI Appendix, Table S1). This peripheral immunophenotyping was paralleled by measurement of plasma levels of several immunometabolic molecules, such as leptin, resistin, myeloperoxidase (MPO), soluble CD40L (sCD40L), monocyte chemoattractant protein-1 (MCP-1), soluble intercellular adhesion molecule-1 (sICAM-1), and soluble tumor necrosis factor receptor (sTNFr). We found that subjects with moderate COPD (GOLD stage II) had lower plasma leptin (Fig. 1A and SI Appendix, Table S2), which increased progressively in GOLD stages III and IV, and that these changes were not linked to differences in BMI and adipocyte mass in COPD stages (Fig. 1A and SI Appendix, Table S2). Also, plasma levels of resistin, MPO, sCD40L, and MCP-1 had a similar trend, increasing in parallel with disease severity, although to a lesser extent compared with leptin (SI Appendix, Fig. S1 and Table S2). Further, sTNFr plasma levels were higher in subjects with severe COPD (GOLD stage III) compared with healthy controls and subjects with COPD at GOLD II and IV stages (SI Appendix, Fig. S1 and Table S2). Finally, sICAM was higher in COPD subjects than in NS healthy subjects and comparable with that observed in S healthy subjects (SI Appendix, Fig. S1 and Table S2). In all, the above data reveal peculiar biphasic and oscillatory changes in classical immunometabolic parameters, particularly with leptin concentrations that were reduced at early disease stages compared with different controls and that progressively increased in advanced stages of disease (Fig. 1A and SI Appendix, Table S2). To assess the clinical relevance of plasma leptin changes on lung function in COPD subjects, we correlated its circulating levels with residual forced expiratory volume in 1 s (FEV1), a clinical parameter estimating lung capacity. Interestingly, plasma leptin levels correlated inversely with FEV1 (Fig. 1B), as well as resistin and MPO associated with lung function (SI Appendix, Fig. S2), while no significant correlation was observed among sCD40L, MCP-1, sTNFr, sICAM-1, and lung function (SI Appendix, Fig. S2). Our results suggest the negative impact of proinflammatory adipocytokines on lung function, with particular emphasis on circulating leptin levels.
Fig. 1.
Biphasic progression of leptin levels during COPD and its inverse correlation with lung function. (A) Plasma levels of leptin in NS healthy subjects, S healthy subjects, and COPD subjects at different GOLD stages. Data are from at least n = 7 subjects, data are expressed as mean ± SEM, and each symbol represents an individual healthy control or COPD subject as indicated. *P < 0.05; **P < 0.01; ***P < 0.001 by 2-tailed Mann–Whitney test. (B) Statistical correlation between plasma leptin levels and FEV1 as a measure of lung function. Data are from n = 31 subjects with COPD, and each symbol represents an individual COPD subject. r = −0.69, P < 0.0001 by Pearson’s correlation.
High Plasma Leptin Levels Correlate with a Defective Engagement of T Cell Glycolysis and with COPD Severity.
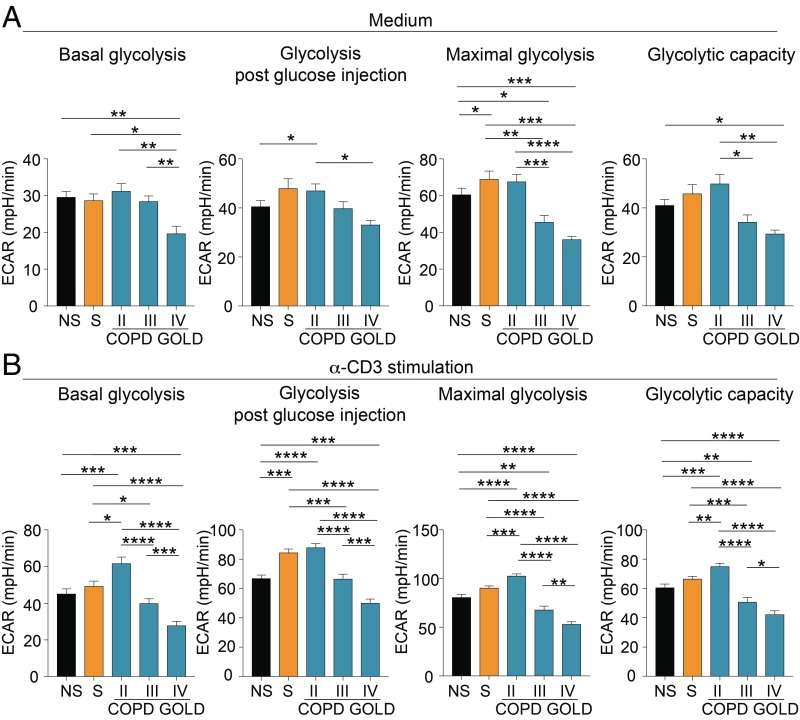
T cells engage in glycolysis upon TCR stimulation to sustain proliferation and effector functions, on the one side, but also to induce Treg cells and immune regulation, on the other (14, 26, 27). To measure the capacity to engage in glycolysis by T cells of COPD subjects, freshly isolated peripheral blood mononuclear cells (PBMCs) from NS healthy control, S healthy control, and COPD subjects at different disease stages were analyzed in the presence or absence of anti-CD3 stimulation in RPMI medium supplemented with 5% plasma from autologous subjects so as to preserve each subject’s microenvironmental conditions. Both unstimulated and TCR-stimulated T cells from patients with moderate disease (GOLD stage II) had higher basal, post-glucose injection, maximal glycolysis and glycolytic capacity, compared with GOLD III and IV stages (Fig. 2). Interestingly, the glycolytic rate progressively decreased in COPD subjects at GOLD stage III and GOLD stage IV (Fig. 2 and SI Appendix, Fig. S3). We also measured oxygen consumption rate (OCR) as a measure of mitochondrial respiration in the basal condition and during TCR stimulation of PBMCs from NS healthy controls, S healthy controls, and COPD subjects (SI Appendix, Fig. S4). OCR was generally impaired in COPD subjects compared with healthy controls, and its trend did not reflect the progressive decline of lung function as per extracellular acidification rate (ECAR) (SI Appendix, Fig. S4).
Fig. 2.
Impaired engagement of glycolysis of T cells from COPD subjects during disease progression. (A) Parameters of the glycolytic pathway in unstimulated PBMCs from NS healthy subjects, S healthy subjects, and COPD subjects at different GOLD stages. (B) Parameters of the glycolytic pathway of PBMCs upon 12 h of α-CD3 stimulation from NS, S, and COPD subjects at different GOLD stages. Parameters of the glycolytic pathway (in A and B) were calculated from the ECAR profile: basal glycolysis, glycolysis after glucose injection, maximal glycolysis (after oligomycin addition), and glycolytic capacity (calculated as the difference of oligomycin-induced ECAR and 2-deoxy-d-glucose (2DG)–induced ECAR). For A and B, data are from n = 7 independent experiments (at least n = 2 subjects in 3 technical replicates), and are expressed as mean ± SEM. *P < 0.05; **P < 0.01; ***P < 0.001; ****P < 0.0001 by 2-tailed Mann–Whitney test.
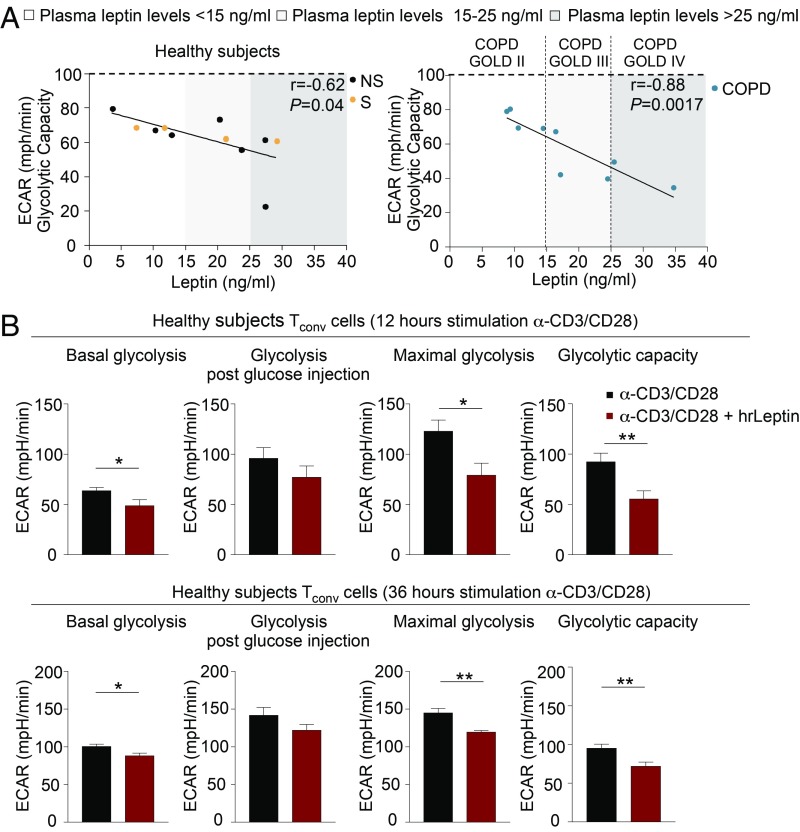
All together, these findings indicate that T cell glycolysis declines progressively in advanced phases of disease. To relate these findings to the capacity of leptin to control glucose metabolism, we linked the glycolytic capacity of T cells with plasma leptin concentrations in the different control groups and in COPD subjects. Strikingly, we observed a tendency toward an inverse correlation between glycolytic activity and plasma leptin levels, suggesting that high leptin is linked with a progressive decline in T cell glycolytic capacity (Fig. 3 A, Left and Right). Of note, this inverse correlation was more evident and highly statistical significant in COPD subjects (Fig. 3 A, Left and Right): Specifically, in GOLD stage II, where plasma leptin concentrations were <15 ng/mL, we observed higher glycolytic capacity, while COPD subjects at GOLD III and IV stages had plasma leptin levels (15 to 25 ng/mL and >25 ng/mL, respectively) higher than those of the other groups and glycolytic capacity progressively declined (Fig. 3 A, Right). Thus, high plasma leptin typical of advanced COPD stages impacted negatively on the capacity of T cells to engage in glycolysis.
Fig. 3.
Leptin reduces glycolysis of T cells in COPD and healthy subjects. (A) Statistical correlation between plasma leptin levels and glycolytic capacity of TCR-stimulated PBMCs from NS and S healthy subjects (Left) and COPD individuals at different GOLD stages (Right). Different ranges of plasma leptin are indicated: white (<15 ng/mL), light gray (15 to 25 ng/mL), and dark gray (>25 ng/mL) boxes. Data are from n = 7 NS healthy subjects, n = 4 S healthy subjects, and n = 9 COPD subjects; each symbol represents an individual healthy or COPD subject as indicated. r = −0.62, P = 0.04 and r = −0.88, P = 0.0017 by Pearson’s correlation. (B) Parameters of the glycolytic pathway calculated from the ECAR profile in CD4+CD25− (Tconv) cells from healthy subjects stimulated for 12 h (Upper) or 36 h (Lower) with α-CD3/CD28 alone or in presence of hrLeptin. Data are from n = 2 independent experiments at least in 2 technical replicates, and are expressed as mean ± SEM. *P < 0.05; **P < 0.01 by 2-tailed Mann–Whitney test.
To ascertain the molecular immunometabolic basis for these findings, we measured glycolysis in healthy individuals during Tconv cell activation in the presence of exogenous human recombinant leptin (hrLeptin) to recapitulate in vitro the high leptin levels typical of COPD advanced stages (GOLD III and IV). We found that hrLeptin reduced significantly the engagement of glycolysis in T cells in terms of basal, maximal, and glycolytic capacity (Fig. 3B and SI Appendix, Fig. S5). These data suggest that high leptin concentrations are able to reduce the engagement of glycolysis during T cell activation with anti-CD3/CD28 stimulation (Fig. 3B and SI Appendix, Fig. S5).
Inverse Correlation Among Plasma Leptin, FoxP3 Splicing Variants, and the Frequency of Peripheral Treg Cells in COPD.
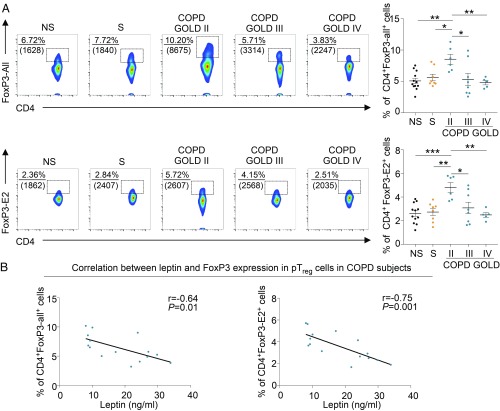
We analyzed circulating peripheral Treg (pTreg) cells in NS healthy subjects, S healthy subjects, and COPD subjects at different stages of disease. We stained pTreg cells by using 2 specific FoxP3 monoclonal antibodies (mAbs): one that recognizes FoxP3 protein containing all splicing variants of FoxP3 (defined as CD4+FoxP3-all+ Treg cells) and the other specific for the variants containing exon2 (CD4+FoxP3-E2+ Treg cells), a splicing form recently discovered as pivotal in conferring suppressive ability to Treg cells (14, 28–30). Cytofluorimetric analysis revealed that COPD subjects at GOLD stage II had a higher number of both CD4+FoxP3-all+ and CD4+FoxP3-E2+ pTreg cells compared with healthy subjects (Fig. 4 A, Upper and Lower); however, the frequency of both CD4+FoxP3+ Treg cell subsets progressively decreased in patients with COPD at GOLD stages III and IV (Fig. 4 A, Upper and Lower). At a clinical level, the frequency of CD4+FoxP3-all+ and CD4+FoxP3-E2+ pTreg cells in the blood of COPD subjects positively correlated with lung function, measured as FEV1 (SI Appendix, Fig. S6). These data were also corroborated by the presence of both FoxP3-all+ and FoxP3-E2+ cells in biopsies from lung tissue of COPD and control subjects (SI Appendix, Fig. S7). Furthermore, in COPD subjects, frequency in the blood of CD4+FoxP3-all+ and CD4+FoxP3-E2+ pTreg cells was negatively associated with plasma leptin levels (Fig. 4 B, Left and Right). Among the additional circulating molecules analyzed in COPD subjects, we found that only sTNFr had a significant inverse correlation with the frequency of CD4+FoxP3-E2+ pTreg cells (SI Appendix, Table S3).
Fig. 4.
Peripheral (p)Treg cells expressing different FoxP3 splicing variants are reduced in different GOLD stages, and this reduction correlates with leptin levels in COPD. (A, Left) Representative flow cytometry plots show the percentage of CD4+FoxP3-all+ (Upper) and CD4+FoxP3-E2+ (Lower) cells in PBMCs from NS healthy subjects, S healthy subjects, and COPD subjects at different disease stages. Numbers in plots indicate the percentage of positive cells, and numbers in parentheses represent mean fluorescence intensity. (A, Right) Cumulative data of CD4+FoxP3-all+ (Upper) and CD4+FoxP3-E2+ (Lower) cells in PBMCs from NS, S, and COPD subjects at different GOLD stages. Data are from at least n = 5 subjects, and are expressed as mean ± SEM. Each symbol represents an individual healthy or COPD subject as indicated. *P < 0.05; **P < 0.01; ***P < 0.001 by 2-tailed Mann–Whitney test. (B, Left) Negative statistical correlation between frequency of circulating CD4+FoxP3-all+ cells and plasma leptin. (B, Right) Negative statistical correlation between frequency of circulating CD4+FoxP3-E2+ cells and plasma leptin. Data are from n = 15 COPD subjects. r = −0.64, P = 0.01 and r = −0.75, P = 0.001 by Pearson’s correlation.
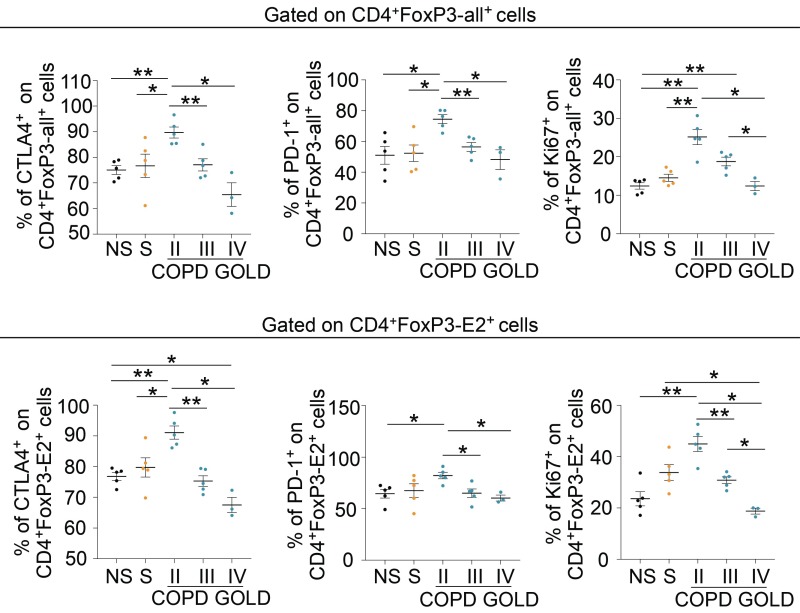
In addition, we measured the expression of the main Treg cell-associated suppressive markers (i.e., CTLA-4, PD-1) and proliferative rate (as Ki-67 staining) in both CD4+FoxP3-all+ and CD4+FoxP3-E2+ cells (Fig. 5 and SI Appendix, Fig. S8). We found that both CD4+FoxP3-all+ and CD4+FoxP3-E2+ pTreg cells from COPD subjects had a different behavior according to GOLD stage classification: Patients with COPD at GOLD stage II expressed higher levels of CTLA-4, PD-1, and Ki-67 compared with healthy subjects, patients with COPD at GOLD stage III, and patients with COPD at GOLD stage IV (Fig. 5, Upper and Lower and SI Appendix, Fig. S8). All together, these findings indicate that the frequency of pTreg cells and the expression of their regulatory markers are higher in COPD subjects in the initial stage and progressively decline during disease progression; this decline correlated inversely with plasma leptin concentrations, thus linking leptin secretion and Treg cell frequency and phenotype in COPD.
Fig. 5.
Progressive reduction of Treg cell-specific markers in pTreg cells of COPD subjects at different GOLD stages. Cumulative data of the expression of Treg cell-specific markers (CTLA-4 and PD-1) and Ki-67 in peripheral CD4+FoxP3-all+ (Upper) and CD4+FoxP3-E2+ (Lower) cells in NS healthy subjects; S healthy subjects; and COPD subjects at GOLD II, GOLD III, and GOLD IV stages. Data are from at least n = 3 subjects, and are expressed as mean ± SEM. Each symbol represents an individual healthy or COPD subject as indicated. *P < 0.05; **P < 0.01 by 2-tailed Mann–Whitney test.
Leptin Inhibits Induction of iTreg Cells and Negatively Impacts COPD Progression.
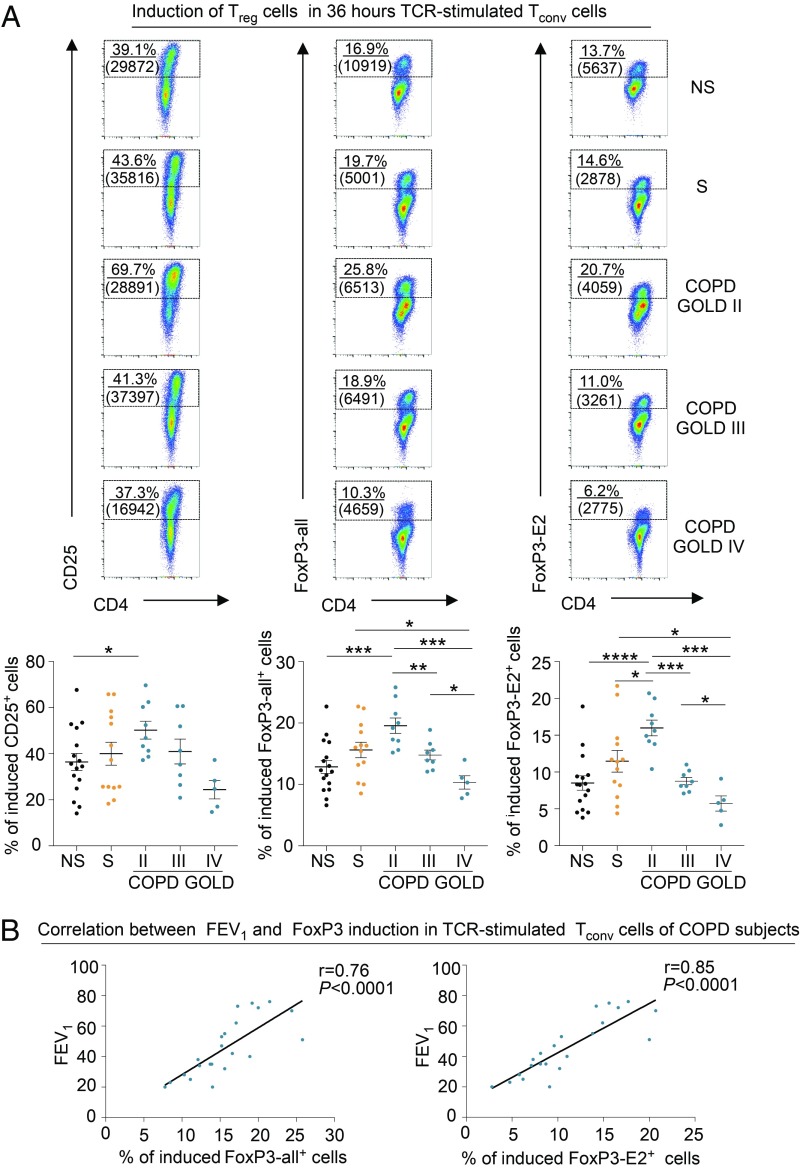
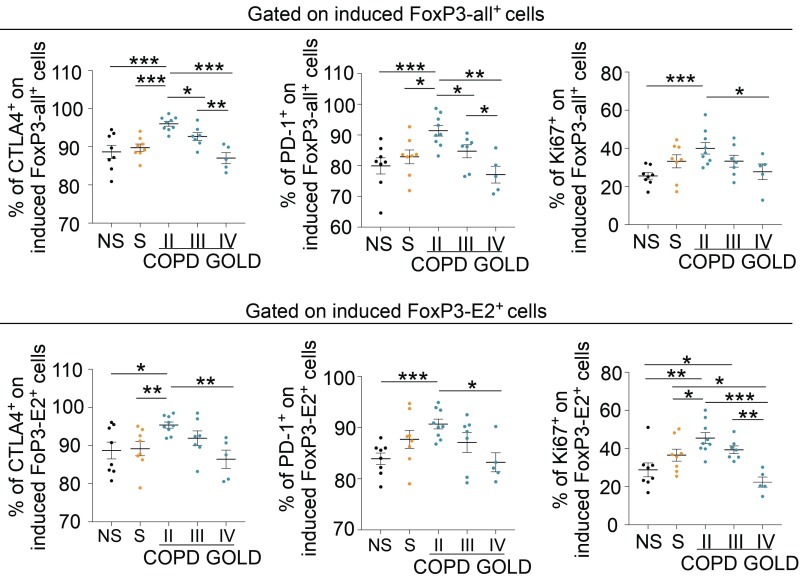
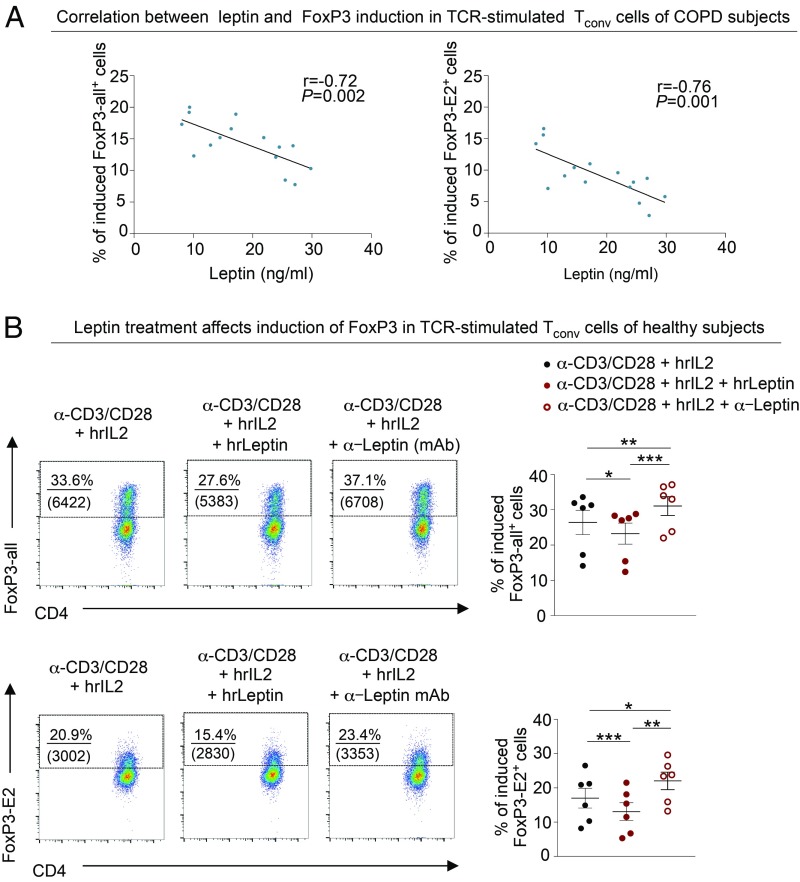
We explored the efficiency of induction and the suppressive capacity of iTreg cells in healthy and COPD subjects. Flow-sorted CD4+ Tconv cells from healthy and COPD subjects were stimulated in vitro to obtain iTreg cells, as previously described (14) (also shown in the schematic model in SI Appendix, Fig. S9). We found that the capacity to differentiate into iTreg cells was higher in subjects at GOLD stage II compared with the other groups analyzed (Fig. 6 A, Upper and Lower). On the contrary, the frequency of induction of iTreg cells in the late stages of the disease (GOLD stages III and IV) was lower compared with that of healthy controls (Fig. 6 A, Upper and Lower). Also, FoxP3-all and FoxP3-E2 induction in iTreg cells of COPD subjects correlated with a measure of preserved lung function, such as FEV1 (Fig. 6 B, Left and Right). Finally, iTreg cell-associated markers (CTLA-4 and PD-1) and Ki-67 on both induced FoxP3-all+ and FoxP3-E2+ cells were higher in moderate COPD (GOLD stage II), while they were significantly decreased in COPD at GOLD stages III and IV (Fig. 7 and SI Appendix, Fig. S10). Parallel measurement of cytokines and chemokines released during induction of iTreg cells from TCR-stimulated Tconv cells revealed that COPD subjects secreted significantly higher amounts of proinflammatory cytokines, such as granulocyte/macrophage colony-stimulating factor, interferon-γ, IL-2, IL-8, IL-17A, tumor necrosis factor-α, interferon-gamma-inducible protein-10, MCP-1, and monokine induced by gamma interferon, compared with healthy subjects (SI Appendix, Fig. S11), while macrophage inflammatory protein 1-α levels were reduced in COPD subjects (SI Appendix, Fig. S11). To link these findings with leptin overproduction during COPD progression, and given the negative correlation among plasma leptin, lung function (measured as FEV1), and pTreg cell frequency (Figs. 1B and 4B, respectively), we also correlated plasma leptin concentrations with the frequency of FoxP3-all and FoxP3-E2 induction in iTreg cells from COPD subjects. Once again, we confirmed that there was an inverse correlation between plasma leptin levels and efficiency in induction of iTreg cells in COPD (Fig. 8A). Among the other circulating molecules, we found that plasma levels of resistin and MCP-1 had an inverse correlation with the percentage of FoxP3-E2+ and FoxP3-all/E2+ iTreg cells, respectively (SI Appendix, Table S4). On the contrary, sICAM-1 had a significant positive correlation with the percentage of both FoxP3-all+ and FoxP3-E2+ iTreg cells (SI Appendix, Table S4).
Fig. 6.
Defective induction of iTreg cells in COPD subjects is associated with GOLD stages and deterioration of lung function. (A, Upper) Flow cytometry plots show the expression of CD25 (Left), FoxP3-all (Center), and FoxP3-E2 (Right) as a measure of iTreg cell induction from TCR-stimulated Tconv cells (also SI Appendix, Fig. S9). Numbers in plots indicate the percentage of positive cells, and numbers in parentheses indicate mean fluorescence intensity. (A, Lower) Cumulative data of the percentage of induced CD25+ (Left), FoxP3-all+ (Center), and FoxP3-E2+ (Right) cells from TCR-stimulated Tconv cells in NS healthy subjects; S healthy subjects; and COPD subjects at GOLD II, GOLD III, and GOLD IV stages as indicated. Data are from at least n = 5 subjects, and are expressed as mean ± SEM. Each dot plot represents a single COPD or healthy subject as indicated. *P < 0.05; **P < 0.01; ***P < 0.001; ****P < 0.0001 by 2-tailed Mann–Whitney test. (B) Positive correlation between the percentage of either induced FoxP3-all+ (Left) or FoxP3-E2+ (Right) cells from TCR-stimulated Tconv cells with FEV1 in COPD subjects. Data are from n = 22 COPD subjects. Each dot plot represents a single COPD subject. r = 0.76, P < 0.0001 and r = 0.85, P < 0.0001 by Pearson’s correlation.
Fig. 7.
Progressive reduction of Treg cell-specific markers in induced Foxp3+ iTreg cells of COPD subjects at different GOLD stages. Cumulative data of the expression of Treg cell-specific markers (CTLA-4 and PD-1) and Ki-67 in induced FoxP3-all+ (Upper) and FoxP3-E2+ (Lower) cells from NS healthy subjects; S healthy subjects; and COPD subjects at GOLD stage II, GOLD stage III, and GOLD stage IV, as indicated, are shown. Data are from at least n = 5 subjects, and are expressed as mean ± SEM. Each symbol represents an individual healthy or COPD subject as indicated. *P < 0.05; **P < 0.01; ***P < 0.001 by 2-tailed Mann–Whitney test.
Fig. 8.
Leptin inversely correlates with FoxP3 expression and inhibits its induction in vitro. (A) Negative correlation between induction of FoxP3-all (Left) or FoxP3-E2 (Right) in TCR-stimulated Tconv cells and leptin levels. Data are from n = 15 COPD subjects. r = −0.72, P = 0.002 and r = −0.76, P = 0.001 by Pearson’s correlation. (B, Left) Representative flow cytometry plots show the percentage of induced FoxP3-all+ (Upper) and FoxP3-E2+ (Lower) cells, generated from Tconv cells of healthy subjects (in autologous donors, 5% plasma) stimulated for 10 d with α-CD3/CD28 plus human recombinant IL-2 (hrIL-2), in the presence of exogenous chronic hrLeptin (200 ng/mL) or in the presence of neutralizing α-Leptin (20 ng/mL) mAb. Numbers in the plots indicate the percentage of positive cells, and numbers in parentheses indicate mean fluorescence intensity of the marker. (B, Right) Cumulative data of percentage of induced FoxP3-all+ (Upper) and FoxP3-E2+ (Lower) cells, generated as above. Data are from n = 6 healthy subjects, and each point represents an individual healthy subject. *P < 0.05; **P < 0.01; ***P < 0.001 by paired repeated-measure 1-way ANOVA corrected for multiple comparisons Tukey test.
To prove a direct link between leptin and FoxP3 induction, we cultured Tconv cells from healthy controls in the presence of exogenous hrLeptin or in the presence of neutralizing antileptin mAb. Interestingly, we found that while hrLeptin impaired the induction of both FoxP3-all and FoxP3-E2 proteins, leptin neutralization, with leptin mAbs, increased their expression (Fig. 8B). Further, hrLeptin treatment induced a down-regulation of Treg cell-associated markers in iTreg cells, such as CTLA-4 and PD-1, which was associated with a reduced proliferation of iTreg cells expressed as Ki-67 staining (SI Appendix, Fig. S12). Conversely, leptin neutralization (by antileptin mAb) during iTreg cell differentiation increased the expression of the above markers, particularly in FoxP3-E2+ iTreg cells (SI Appendix, Fig. S12).
In all, these results suggest that leptin directly affects iTreg cell induction in vitro, thus contributing to a deteriorated lung function in COPD subjects.
Progressive Decline of Suppressive Function of iTreg Cells during COPD Progression.
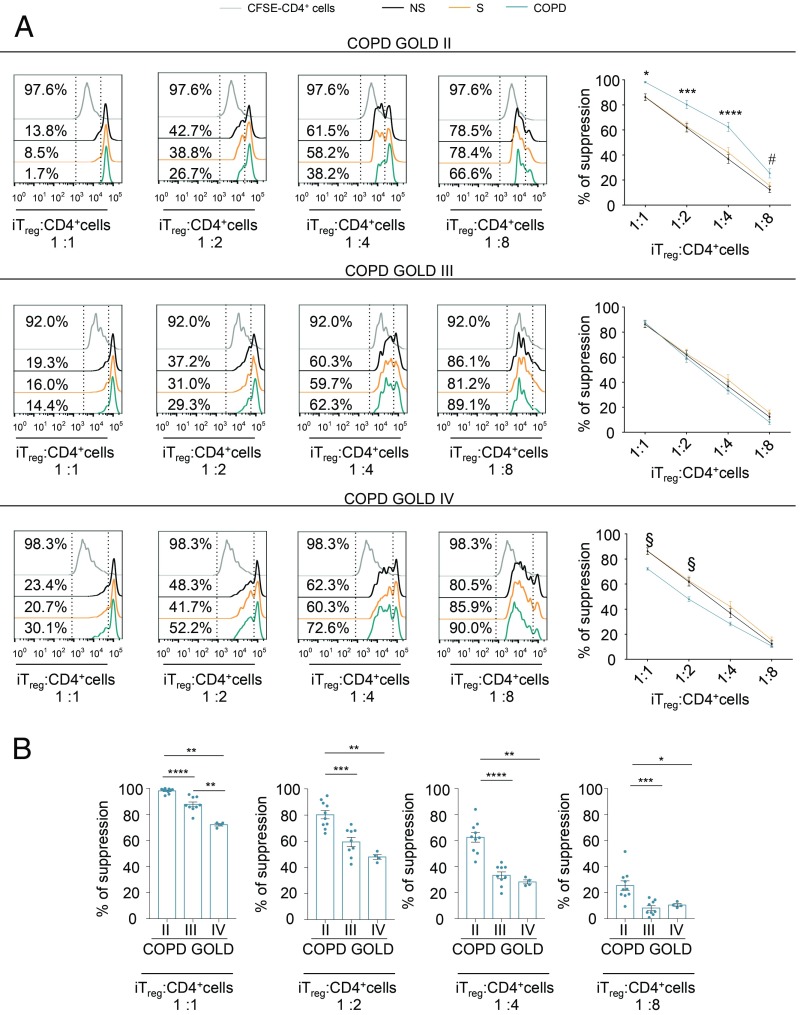
Next, we examined whether an impaired induction of iTreg cells observed in COPD subjects was also associated with a deteriorated suppressive function in vitro. The iTreg cells were flow-sorted on the basis of cell surface expression of the T cell activation marker CD25 (a schematic model of experimental procedures is shown in SI Appendix, Fig. S13). In 5% autologous plasma, we assessed the ability of iTreg cells from both control and COPD subjects to suppress proliferation of activated CD4+ T cells labeled with the division-tracking dye 5,6-carboxyfluorescein-diacetate-succinimidyl ester (CFSE) in vitro. According to FoxP3-all and FoxP3-E2 amount and leptin levels, flow-sorted iTreg cells from COPD subjects at GOLD stage II showed higher suppressive activity compared with healthy subjects, GOLD stage III subjects, and GOLD stage IV subjects (Fig. 9A), while iTreg cells from COPD subjects at GOLD stage IV had the lowest suppressive capacity in vitro compared with the controls and the subjects with other GOLD stages (Fig. 9). This decline of iTreg cell function paralleled disease progression (Fig. 9B). In all, our data reveal that not only the efficiency in iTreg cell induction but also the suppressive function of iTreg cells is impaired in COPD subjects, and both phenomena are linked with high leptin production in advanced COPD stages.
Fig. 9.
Suppressive function of iTreg cells declines with disease severity in COPD subjects. (A, Left) Flow cytometry histograms show proliferation of CFSE-labeled CD4+ T cells (from healthy donors) stimulated for 72 h in vitro with α-CD3/CD28 and cultured alone (gray curves) or in the presence of various numbers of flow-sorted iTreg cells (ratio from 1:1 to 1:8) from NS healthy subjects, S healthy subjects, and COPD patients at different disease stages. Numbers in plots indicate the percentage of CFSE dilution in CD4+ T cells cultured alone (Upper) or in the presence of iTreg cells from NS, S, and COPD subjects at different disease stages. The iTreg cells were flow-sorted as reported in the experimental procedure (SI Appendix, Fig. S13). (A, Right) Percentage of suppression exerted by iTreg cells in the above conditions. Data are from n = 3 independent experiments (at least n = 2 subjects in 2 technical replicates), and are expressed as mean ± SEM. *P < 0.05; ***P < 0.001; ****P < 0.0001 statistical significance between COPD at GOLD stage II and healthy (NS and S) controls. #P < 0.05 statistical significance between COPD patients at GOLD stage II and NS subjects by 2-way ANOVA corrected for multiple comparisons Tukey test. §P < 0.05 statistical significance between COPD patients at GOLD stage IV and S subjects by 2-way ANOVA corrected for multiple comparisons Tukey test. (B) Scatter plots with bar histograms show comparison of suppression ability exerted by iTreg cells (at the indicated ratio) isolated from COPD subjects on proliferation of CFSE-labeled CD4+ T cells stimulated for 72 h in vitro with α-CD3/CD28. Data are from n = 3 independent experiments (at least n = 2 COPD subjects in 2 technical replicates), and are expressed as mean ± SEM. *P < 0.05; **P < 0.01; ***P < 0.001; ****P < 0.0001 by 2-tailed Mann–Whitney test.
Discussion
In this study, we linked systemic metabolic status, through leptin overproduction, with a reduced frequency of pTreg cells and an impaired capacity of Tconv cells to differentiate into iTreg cells in subjects with different disease stages of COPD. Unbalanced leptin overproduction was independent of an increased BMI and adipocyte mass, and correlated with a progressive loss of lung function. Interestingly, leptin secretion was biphasic over time throughout COPD GOLD stages; indeed, a significant reduction in plasma leptin production occurred at the moderate disease stage (GOLD II), followed by a consistent increase at the late severe disease stages (GOLD III to IV). These events correlated negatively not only with pTreg cell frequency but also with reduced surface expression of Treg cell-specific antiinflammatory markers, such as PD-1 and CTLA-4. We also associated these findings with deteriorated lung function in terms of FEV1, typical of advanced COPD stages. Mechanistically, our results were secondary to a reduced capacity of T cells from COPD subjects to engage in glycolysis during TCR stimulation, similar to what has been observed in other chronic inflammatory disorders, such as multiple sclerosis, type 1 diabetes, and glycogen storage disease-1b (14, 30, 31). The key factor leading to progressive deterioration of T cell glycolytic function was induced by leptin itself. Indeed, while at physiological concentrations (between 5 and 15 ng/mL), leptin increases glucose uptake by T cells (22), and in conditions in which its levels rise particularly high (>25 ng/mL), it is able to significantly inhibit engagement of glycolysis and consequently reduce the capacity of Tconv cells to differentiate into iTreg cells; these effects were also associated with a direct inhibition of FoxP3 gene expression by leptin (Fig. 8B). These results fit with our COPD model (SI Appendix, Fig. S14) and unveil an immunometabolic determinant leading to progressive loss of lung function during COPD. Specifically, when leptin levels were lower in moderate GOLD stage II (<15 ng/mL), engagement of glycolysis was maintained and the frequency and induction of Treg cells were preserved. On the contrary, when leptin levels reached high concentrations, like in GOLD III and IV advanced stages (15 to 25 ng/mL and >25 ng/mL, respectively), glycolysis progressively deteriorated, and the frequency and induction of Treg cells were also reduced significantly. These events might induce lung damage, exacerbation of inflammation, and loss of lung function as a consequence of dysregulated CD4+ effector functions (SI Appendix, Fig. S14). Further, our comprehensive analysis of FoxP3 splicing variants expressed by Treg cells revealed that Treg cell regulatory activities are also impaired during progression of COPD, and are linked inversely with leptin secretion. Interestingly, leptin secretion in this context is disjoined from the adipocyte mass, as BMI did not differ significantly in our COPD study populations, despite the increase in plasma leptin in advanced COPD stages. This evidence suggests that the increased leptin secretion relied mainly on the inflammatory state, determining the loss of its direct correlation with BMI typical of normal-weight healthy subjects. We hypothesize intralung leptin production by inflammatory immune cells (i.e., produced by activated T cells), which have been shown to be capable of producing leptin in inflammatory lesions (21). This hypothesis clearly needs further investigation, despite the obvious difficulties in obtaining biopsies from COPD subjects at different GOLD stages.
Building on the above evidence that a strong relationship among glucose metabolism, FoxP3 induction, and regulatory function exists in human T cells, we aimed at investigating the molecular mechanisms linking the pathogenesis of COPD, reduced glucose utilization by T cells, and chronic proinflammatory exposure to cigarette smoke (CS). In this context, leptin, a cytokine-like hormone mainly secreted by adipocytes, has been shown to play a significant role in the pathogenesis of several autoimmune disorders, as it boosts Th1/Th17 proinflammatory responses and inhibits proliferation of Treg cells (19, 32). It has also been reported that increased leptin levels show an inverse correlation with Treg cell frequency in multiple sclerosis, a chronic inflammatory disease of the central nervous system (32). We show herein a direct capacity of leptin to inhibit FoxP3 induction and iTreg cell differentiation also in the context of a chronic inflammatory disease such as COPD. These results are in agreement with a recent report showing that microenvironmental stimuli produced by the release of cytokines during COPD progression lead to a Th17/Treg cell imbalance in a mouse model of CS-induced disease (33). However, additional investigations are required to unveil whether leptin is able to affect FoxP3 splicing variants and the epigenetic landscape in human Tconv cells, thus modifying their capability to differentiate into iTreg cells. Unfortunately, available mouse models of CS-induced disease have several limitations due to the reduced genetic variability of the inbred strains; the lack of FoxP3 splicing isoforms; and the reduced exposure to other pathogenic determinants, such as pollutants, organic dust, lifestyle, and infections (34, 35).
Our results also show biphasic behavior in the axis linking leptin secretion-Treg cell frequency/induction and lung function (a schematic model is shown in SI Appendix, Fig. S14). In agreement with our model, it has been shown that plasma leptin inversely correlated with lung function in COPD subjects (24, 25). Moreover, increased numbers and functions of iTreg cells observed in subjects at the moderate stage (GOLD II) of disease may represent an early compensatory mechanism that counteracts the immune dysregulation induced by inflammatory stimuli (CS or other lung irritants) in the first phase of disease. Both CD4+FoxP3-all+ and CD4+FoxP3-E2+ Treg cells of COPD patients at the GOLD II stage showed higher proliferative rate measured as Ki-67 staining, compared with other groups analyzed. These findings could also explain the impairment of the T cell-mediated immune response against nontypeable Haemophilus influenzae observed in patients affected by moderate COPD (36). In agreement with this evidence, the up-regulation of Treg cell subsets observed in S healthy subjects with normal lung function (compared with NS healthy subjects) may be interpreted as an early challenge to regulate the inflammatory response elicited by tobacco smoking. Consistent with this idea, the presence of excessive and prolonged inflammatory stimuli may determine a transitory hyperactivity of Treg cells followed by an “exhaustion” of suppressive activity that relied on a reduced expression of FoxP3-E2 variants as observed in the late stages of disease. The loss of these regulatory mechanisms leads to hyperactivation of CD4+ Tconv cell effector functions (a schematic model is shown in SI Appendix, Fig. S14) associated with leptin overproduction that amplifies inflammation in COPD, thus determining the progressive decline of lung function and emphysematous condition. Also, these findings are in line with experimental evidence indicating that subjects affected by COPD exhibit many of the characteristics of a classical autoimmune-like response, suggesting that COPD is a multifactorial disorder with a strong autoimmune component (6, 37, 38).
In summary, impaired Treg cell properties and FoxP3 splicing form expression during COPD progression underscore the relevance of these molecular determinants in disease pathogenesis. These factors find their pathomechanism in a progressive and biphasic increase of systemic leptin secretion that impairs the capacity of T cells to engage in glycolysis after suboptimal TCR stimulation. These phenomena are associated with a reduced pTreg cell frequency in the periphery and an impaired capacity of Tconv cells to induce expression of FoxP3. These data also reveal the immunometabolic cues leading to the inflammatory status and the deteriorated lung function that characterize COPD progression. A better understanding of these cellular and molecular mechanisms can provide novel means for immunometabolic treatments during COPD, as well as the identification of biomarkers that might have the potential to monitor and anticipate disease progression over time.
Methods
Additional methods are provided in SI Appendix, Supplementary Materials and Methods.
Study Population.
COPD patients were clinically stable with no exacerbation in the previous 3 mo from the blood draw. All of them were being treated with inhaled long-acting bronchodilators, with 51% of patients receiving an association of long-acting muscarinic antagonists and long-acting beta-agonists, and 20% of patients also receiving an inhaled steroid. No patients were using oral steroids. Subjects with atopy-related respiratory disorders (allergic rhinitis or asthma) and those taking oral cholesterol or statins or suffering from decompensated diabetes were excluded from the study. Most prevalent comorbidities included systemic arterial hypertension (56%), chronic ischemic heart disease (21%), and type II diabetes (14%). Age- and sex-related healthy volunteers with normal lung function were included as a control group. Blood samples from COPD and healthy subjects were collected at 8:00 AM into heparinized Vacutainer tubes (BD Biosciences) and were processed within the following 4 h. Demographic and clinical features of the study population are reported in SI Appendix, Table S5.
iTreg Cell Induction.
For the generation of iTreg cells, after Ficoll-Hypaque gradient centrifugation (GE Healthcare), Tconv cells were isolated from PBMCs by negative selection with a human CD4+CD25+ T cell kit (Invitrogen; cell purity > 98%), and cells were cultured (2 × 10⁶ cells per milliliter) in 6-well plates (Falcon; BD Biosciences) with RPMI-1640 medium supplemented with 100 international units (IU)/mL penicillin, 100 μg/mL streptomycin (Life Technologies), and either 5% autologous plasma or 5% AB human serum (Euroclone). Cells were stimulated for 36 h with Dynabeads coated with mAb to CD3 plus mAb to CD28 (Invitrogen) at a density of 0.1 bead per cell. Then, stimulated Tconv cells were stained with the following mAbs: phycoerythrin-Cy7 anti-human CD25 and allophycocyanin-H7 anti-human CD4. Cells were sorted by flow cytometry on the basis of their cell surface expression of CD25 (purity > 98%) with a BD FACSJazz instrument (BD Biosciences) (14).
For the induction of Treg cells in the presence of hrLeptin (200 ng/mL) or antileptin mAb (20 μg/mL), CD4+ Tconv cells in 5% autologous plasma were stimulated for 10 d with mAb to CD3 plus mAb to CD28 (0.1 bead per cell) and human recombinant IL-2 (50 IU/mL; Roche).
Suppression Assays.
For the assessment of iTreg cell suppression, CD4+ T cells (from healthy donors) were labeled with the fluorescent dye CFSE (Thermo Fischer Scientific). Then CFSE+CD4+ T cells were stimulated for 72 h with microbeads coated with mAb to CD3 plus mAb to CD28 (0.2 bead per cell) alone or with different numbers of iTreg cells (ratios from 1:1 to 8:1; CFSE+CD4+ T cells/iTreg cells) in round-bottomed, 96-well plates (all from Becton Dickinson) (14). All tests were performed in the presence of RPMI-1640 medium supplemented with 100 IU/mL penicillin, 100 μg/mL streptomycin (Life Technologies), and heat-inactivated 5% autologous plasma. CFSE dilution analysis was performed by gating on CFSE+CD4+ T cells using a BD FACSCanto II system (BD Biosciences) and FlowJo software.
Seahorse Analyses.
Metabolic profile was evaluated in PBMCs stimulated for 12 h in the absence or presence of anti-CD3 (clone OKT3). ECAR and OCR were measured with an XFe-96 Analyzer (Seahorse Bioscience). Specifically, cells were plated in XFe-96 plates (Seahorse Bioscience) at a concentration of 4 × 10⁵ cells per well and cultured with RPMI-1640 medium supplemented with 5% autologous plasma. ECAR was measured in XF media (nonbuffered Dulbecco’s modified Eagle’s medium containing 10 mM glucose and 1 mM sodium pyruvate) under basal conditions and in response to 10 mM glucose, 5 μM oligomycin, and 100 mM 2-deoxy-d-glucose (all from Sigma–Aldrich). OCR was measured in XF media under basal conditions and in response to 5 μM oligomycin, 1.5 μM carbonylcyanide-4-(trifluoromethoxy)-phenylhydrazone, and 1 μM antimycin A and rotenone (Sigma–Aldrich). Experiments with the Seahorse were done with the following assay conditions: 3-min mixture, 3-min wait, and 3-min measurement. ECAR was also measured on Tconv cells stimulated with anti-CD3/CD28 (0.2 bead per cell) in the presence or not of hrLeptin (300 ng/mL) at indicated time points.
Statistics.
Statistical evaluation of data by InStat 6.0 software (GraphPad Software, Inc.) was performed by Mann–Whitney test, Student’s t test, 1-way or 2-way ANOVA modified for Tukey’s multiple comparisons test, and Pearson’s correlation test as indicated. All biological correlations were analyzed using multivariate linear regression, adjusted for age, sex, BMI, and smoking status. For all analyses, a 2-sided test with a P value less than 0.05 was considered statistically significant.
Study Approval.
The study was approved by the Institutional Review Board of the University of Naples “Federico II.” Healthy and COPD subjects were recruited at the Dipartimento di Medicina Clinica e Chirurgia, Università degli Studi di Napoli “Federico II,” and written informed consent was received from participants before inclusion in the study.
Supplementary Material
Acknowledgments
We thank Mrs. M. Montagna for technical assistance, Mrs. G. Ippolito and Mrs. G. Speranza for administrative support, and all members of the Laboratory of Immunology at Istituto per l’Endocrinologia e l’Oncologia Sperimentale, Consiglio Nazionale delle Ricerche. This paper was supported by grants from the Juvenile Diabetes Research Foundation (Grant 2-SRA-2018-479-S-B to M.G.), National Multiple Sclerosis Society (Grant PP-1804-30725 to M.G.), Fondazione Italiana Sclerosi Multipla (Grant 2016/R/18), European Research Council (Grant 310496 “menTORingTregs” to G.M.), Telethon (Grant GGP 17086 to G.M.), Fondazione Italiana Sclerosi Multipla (Grant 2018/R/4), Univerisità degli Studi di Napoli “Federico II” (Sostegno Territoriale alle Attività di Ricerca Program Linea 1–2018 to V.D.R.), and Ministero della Salute (Grant GR-2016-02363725 to V.D.R.).
Footnotes
The authors declare no conflict of interest.
This article is a PNAS Direct Submission.
This article contains supporting information online at www.pnas.org/lookup/suppl/doi:10.1073/pnas.1906303116/-/DCSupplemental.
References
- 1.Barnes P. J., et al. , Chronic obstructive pulmonary disease. Nat. Rev. Dis. Primers 1, 15076 (2015). [DOI] [PubMed] [Google Scholar]
- 2.Caramori G., et al. , COPD immunopathology. Semin. Immunopathol. 38, 497–515 (2016). [DOI] [PMC free article] [PubMed] [Google Scholar]
- 3.Cerami C., et al. , Tobacco smoke is a source of toxic reactive glycation products. Proc. Natl. Acad. Sci. U.S.A. 94, 13915–13920 (1997). [DOI] [PMC free article] [PubMed] [Google Scholar]
- 4.Cosio M. G., Saetta M., Agusti A., Immunologic aspects of chronic obstructive pulmonary disease. N. Engl. J. Med. 360, 2445–2454 (2009). [DOI] [PubMed] [Google Scholar]
- 5.Rahman I., Adcock I. M., Oxidative stress and redox regulation of lung inflammation in COPD. Eur. Respir. J. 28, 219–242 (2006). [DOI] [PubMed] [Google Scholar]
- 6.Agustí A., MacNee W., Donaldson K., Cosio M., Hypothesis: Does COPD have an autoimmune component? Thorax 58, 832–834 (2003). [DOI] [PMC free article] [PubMed] [Google Scholar]
- 7.Bluestone J. A., Bour-Jordan H., Cheng M., Anderson M., T cells in the control of organ-specific autoimmunity. J. Clin. Invest. 125, 2250–2260 (2015). [DOI] [PMC free article] [PubMed] [Google Scholar]
- 8.Littman D. R., Rudensky A. Y., Th17 and regulatory T cells in mediating and restraining inflammation. Cell 140, 845–858 (2010). [DOI] [PubMed] [Google Scholar]
- 9.Williams L. M., Rudensky A. Y., Maintenance of the Foxp3-dependent developmental program in mature regulatory T cells requires continued expression of Foxp3. Nat. Immunol. 8, 277–284 (2007). [DOI] [PubMed] [Google Scholar]
- 10.Chen W., et al. , Conversion of peripheral CD4+CD25- naive T cells to CD4+CD25+ regulatory T cells by TGF-beta induction of transcription factor Foxp3. J. Exp. Med. 198, 1875–1886 (2003). [DOI] [PMC free article] [PubMed] [Google Scholar]
- 11.Zheng S. G., Gray J. D., Ohtsuka K., Yamagiwa S., Horwitz D. A., Generation ex vivo of TGF-beta-producing regulatory T cells from CD4+CD25- precursors. J. Immunol. 169, 4183–4189 (2002). [DOI] [PubMed] [Google Scholar]
- 12.Walker M. R., et al. , Induction of FoxP3 and acquisition of T regulatory activity by stimulated human CD4+CD25- T cells. J. Clin. Invest. 112, 1437–1443 (2003). [DOI] [PMC free article] [PubMed] [Google Scholar]
- 13.Walker M. R., Carson B. D., Nepom G. T., Ziegler S. F., Buckner J. H., De novo generation of antigen-specific CD4+CD25+ regulatory T cells from human CD4+CD25- cells. Proc. Natl. Acad. Sci. U.S.A. 102, 4103–4108 (2005). [DOI] [PMC free article] [PubMed] [Google Scholar]
- 14.De Rosa V., et al. , Glycolysis controls the induction of human regulatory T cells by modulating the expression of FOXP3 exon 2 splicing variants. Nat. Immunol. 16, 1174–1184 (2015). [DOI] [PMC free article] [PubMed] [Google Scholar]
- 15.Pearce E. L., Pearce E. J., Metabolic pathways in immune cell activation and quiescence. Immunity 38, 633–643 (2013). [DOI] [PMC free article] [PubMed] [Google Scholar]
- 16.De Rosa V., La Cava A., Matarese G., Metabolic pressure and the breach of immunological self-tolerance. Nat. Immunol. 18, 1190–1196 (2017). [DOI] [PubMed] [Google Scholar]
- 17.Michalek R. D., et al. , Cutting edge: Distinct glycolytic and lipid oxidative metabolic programs are essential for effector and regulatory CD4+ T cell subsets. J. Immunol. 186, 3299–3303 (2011). [DOI] [PMC free article] [PubMed] [Google Scholar]
- 18.van den Bemt L., van Wayenburg C. A., Smeele I. J., Schermer T. R., Obesity in patients with COPD, an undervalued problem? Thorax 64, 640, author reply 640–641 (2009). [DOI] [PubMed] [Google Scholar]
- 19.Yu Y., et al. , Cutting edge: Leptin-induced RORγt expression in CD4+ T cells promotes Th17 responses in systemic lupus erythematosus. J. Immunol. 190, 3054–3058 (2013). [DOI] [PMC free article] [PubMed] [Google Scholar]
- 20.Procaccini C., et al. , Role of adipokines signaling in the modulation of T cells function. Front. Immunol. 4, 332 (2013). [DOI] [PMC free article] [PubMed] [Google Scholar]
- 21.De Rosa V., et al. , A key role of leptin in the control of regulatory T cell proliferation. Immunity 26, 241–255 (2007). [DOI] [PubMed] [Google Scholar]
- 22.Saucillo D. C., Gerriets V. A., Sheng J., Rathmell J. C., Maciver N. J., Leptin metabolically licenses T cells for activation to link nutrition and immunity. J. Immunol. 192, 136–144 (2014). [DOI] [PMC free article] [PubMed] [Google Scholar]
- 23.Gerriets V. A., et al. , Leptin directly promotes T-cell glycolytic metabolism to drive effector T-cell differentiation in a mouse model of autoimmunity. Eur. J. Immunol. 46, 1970–1983 (2016). [DOI] [PMC free article] [PubMed] [Google Scholar]
- 24.Oh Y. M., et al. ; KOLD Study Group , Association of plasma adipokines with chronic obstructive pulmonary disease severity and progression. Ann. Am. Thorac. Soc. 12, 1005–1012 (2015). [DOI] [PubMed] [Google Scholar]
- 25.Suzuki M., et al. , Lower leptin/adiponectin ratio and risk of rapid lung function decline in chronic obstructive pulmonary disease. Ann. Am. Thorac. Soc. 11, 1511–1519 (2014). [DOI] [PubMed] [Google Scholar]
- 26.Menk A. V., et al. , Early TCR signaling induces rapid aerobic glycolysis enabling distinct acute T cell effector functions. Cell Rep. 22, 1509–1521 (2018). [DOI] [PMC free article] [PubMed] [Google Scholar]
- 27.Almeida L., Lochner M., Berod L., Sparwasser T., Metabolic pathways in T cell activation and lineage differentiation. Semin. Immunol. 28, 514–524 (2016). [DOI] [PubMed] [Google Scholar]
- 28.Allan S. E., et al. , The role of 2 FOXP3 isoforms in the generation of human CD4+ Tregs. J. Clin. Invest. 115, 3276–3284 (2005). [DOI] [PMC free article] [PubMed] [Google Scholar]
- 29.Smith E. L., Finney H. M., Nesbitt A. M., Ramsdell F., Robinson M. K., Splice variants of human FOXP3 are functional inhibitors of human CD4+ T-cell activation. Immunology 119, 203–211 (2006). [DOI] [PMC free article] [PubMed] [Google Scholar]
- 30.Melis D., et al. , Cutting edge: Increased autoimmunity risk in glycogen storage disease type 1b is associated with a reduced engagement of glycolysis in T cells and an impaired regulatory T cell function. J. Immunol. 198, 3803–3808 (2017). [DOI] [PMC free article] [PubMed] [Google Scholar]
- 31.Procaccini C., et al. , An oscillatory switch in mTOR kinase activity sets regulatory T cell responsiveness. Immunity 33, 929–941 (2010). [DOI] [PMC free article] [PubMed] [Google Scholar]
- 32.Matarese G., et al. , Leptin increase in multiple sclerosis associates with reduced number of CD4(+)CD25+ regulatory T cells. Proc. Natl. Acad. Sci. U.S.A. 102, 5150–5155 (2005). [DOI] [PMC free article] [PubMed] [Google Scholar]
- 33.Ito J. T., et al. , Th17/Treg imbalance in COPD progression: A temporal analysis using a CS-induced model. PLoS One 14, e0209351 (2019). [DOI] [PMC free article] [PubMed] [Google Scholar]
- 34.Wright J. L., Cosio M., Churg A., Animal models of chronic obstructive pulmonary disease. Am. J. Physiol. Lung Cell. Mol. Physiol. 295, L1–L15 (2008). [DOI] [PMC free article] [PubMed] [Google Scholar]
- 35.Dawkins P. A., Stockley R. A., Animal models of chronic obstructive pulmonary disease. Thorax 56, 972–977 (2001). [DOI] [PMC free article] [PubMed] [Google Scholar]
- 36.Kalathil S. G., et al. , T-regulatory cells and programmed death 1+ T cells contribute to effector T-cell dysfunction in patients with chronic obstructive pulmonary disease. Am. J. Respir. Crit. Care Med. 190, 40–50 (2014). [DOI] [PMC free article] [PubMed] [Google Scholar]
- 37.Caramori G., et al. , Autoimmunity and COPD: Clinical implications. Chest 153, 1424–1431 (2018). [DOI] [PubMed] [Google Scholar]
- 38.Cosio M. G., Autoimmunity, T-cells and STAT-4 in the pathogenesis of chronic obstructive pulmonary disease. Eur. Respir. J. 24, 3–5 (2004). [DOI] [PubMed] [Google Scholar]
Associated Data
This section collects any data citations, data availability statements, or supplementary materials included in this article.


