ABSTRACT
We aimed to assess the roles of small nucleolar RNA host gene 6 (SNHG6) in hepatocellular carcinoma (HCC) progression, and establish the lncRNA-miRNA-mRNA regulation mechanism for HCC therapy. SNHG6 is one of the host genes in small nucleolar RNAs (snoRNAs), which make a difference in the development of human cancers. SERPINH1 is a gene encoding a member of the serpin superfamily of serine proteinase inhibitors with miRNA predicted by TargetScan and DIANA Tools. SNHG6, serpin family H member 1 (SERPINH1) and miR-139-5p expression levels in HCC tissues and cells were determined by quantitative real-time PCR (qRT-PCR). Migration and invasion of HCC cells were measured by transwell assay. Cell cycle analysis was determined by using flow cytometry. 3-(4,5-dimethyl-2-thiazolyl)-2,5-diphenyl-2-H-tetrazolium bromide (MTT) assay and colony formation assay were performed for cell viability analysis. The expression of SERPINH1 was detected by qRT-PCR and western blot. Dual-luciferase reporter gene assay was conducted to identify the targeted relationship between miR-139-5p and SNHG6, as well as SERPINH1 and miR-139-5p. The positive regulation between SNHG6 and SERPINH1 was demonstrated in this study. In contrast, miR-139-5p was significantly down-regulated in HCC cells, the inhibition of miR-139-5p promotes the proliferation of HCC cells, and accelerated the cell cycle of HCC cells. Our study demonstrated the co-expression of SNHG6 and SERPINH1 in HCC cells for the first time, which revealed that SNHG6 could serve as a novel oncogene for the HCC therapy by its regulation.
KEYWORDS: Hepatocellular carcinoma, SNHG6, SERPINH1, miR-139-5p
Introduction
Hepatocellular carcinoma (HCC) is an aggressive malignancy, which is also the leading cause of cancer-related deaths in some African and Asian countries [1,2]. HCC is characterized by high and increasing incidence, low resectability rate, high recurrence after a curative-intent surgery, poor response to medical treatments, and poor prognosis [3]. Current therapies for treating HCC have control over sizes and numbers of the nodules in HCC patients, including locoregional treatments, radiofrequency ablation and chemotherapies [4]. However, these therapies are insufficient in the control of large and numerous nodules. Therefore, it is crucial to develop promising therapies with higher anti-tumor effects, and the novel diagnostic biomarkers identification was one of the solutions. The exploration of novel molecular targets and regulation mechanism is needed for HCC treatment [4].
Increasing evidences have identified that the essential roles of non-coding RNAs in physiological processes in vivo[5]. Non-coding RNAs can be divided into two main groups, long noncoding RNAs (lncRNAs) and short noncoding RNAs (miRNAs). LncRNAs are DNA molecules longer than 200 nucleotides, they currently get high attention in cancer therapies, and the critical role of them in tumorigenesis has been recognized [6]. LncRNAs are highly heterogeneous, they possess a wide range of cellular functions, including chemical RNA modification, alternative splicing control and pre-RNA processing [7]. According to previous studies, it has been studied that the abnormal regulation of lncRNAs can contribute to the carcinogenesis [8]. Furthermore, previous studies have indicated that lncRNAs can induce the pathogenesis and progression of HCC [9]. SNHG6 is one of lncRNAs, it was located in chromosome 8q13.1 (commonly amplified in HCC) and has found to be up-regulated in HCC tissues [10].
MicroRNAs (miRNAs) are a subset of ncRNAs in length of less than 200 nucleotides [11]. Based on the previous studies that related to human malignancies, miRNAs are reported to mainly regulate gene expression post-transcriptionally [12]. The aberrant expression of miRNAs highly associated with the tumor oncogenesis and metastasis, and miRNAs are critical for metabolism in tumor cells [8]. MiR-139, located on chromosome 11q13.4, is down-regulated in several tumor cells, and its anti-oncogenic activity has been identified in humans [13,14]. What is more, the aberrantly expressed miRNA will suppress the expression of mRNA in normal cells, following by cancer occurrence[15]. Therefore, it is hypothesized that the demonstration of abnormally expressed miR-139-5p in HCC cells is crucial in elucidating molecular targets, contributing to the treatment of HCC patients [16].
SERPINH1 is located at 11q13.5 and encodes heat shock protein 47 (HSP47), which is a 418-amino-acid protein and belongs to the serpin superfamily [17,18]. The overexpression of SERPINH1 in HCC was presented by Naboulsi et al. for the first time [19]. Although the expression of HSP47 in different types of cancer has different effects, in some types of cancer, such as glioblastoma and breast cancer, HSP47 is associated with invasiveness [20]. SERPHIH1 and its protein HSP47 act as potential biomarkers in cancer research [21]. Hence, further exploration of the roles of SERPINH1 and its up-stream factors were needed in HCC progression.
Our study compared the expression of SNHG6 in HCC tissues with several HCC cells, and the abnormal expression of SNHG6 was found to be closely related to the development and progression of HCC. Additionally, co-expression of SNHG6 and SERPINH1 were determined in this study that SNHG6 could regulate SERPINH1 expression by competitively binding miR-139-5p. Therefore, SNHG6 is expected to serve as a novel biomarker for HCC.
Materials and methods
HCC tissue samples and cell lines preparation
Twelve pairs of HCC tissue samples and adjacent normal tissues were obtained from surgical specimens at Sichuan Provincial People’s Hospital, University of Electronic Science and Technology of China after informed consent. After excision, all these surgical specimens were snap-frozen at liquid nitrogen. The protocols used in the present study have been approved by Human Subjects Committee of the Sichuan Provincial People’s Hospital, University of Electronic Science and Technology of China.
Normal hepatic cell line HL-7702 and HCC cell lines including HepG2, Hep3b, HLE and Huh-7 were obtained from the cell bank of Type Culture Collection (Chinese Academy of Sciences, Shanghai, China). All the cells were cultured in DMEM (Gibco, Carlsbad, CA, USA) with 10% FBS (Gibco) and incubated at 37°C with5% CO2.
Cell transfection
Seventy percent confluent cells were transfected via Lipofectamine2000 (Invitrogen, Carlsbad, CA, USA) in line with the standard protocol. All the transfected cells were harvested at days 2. The group of transfected cells was shown as below: (1) negative control (NC) group; (2) si-SNHG6 group: cells transfected with si-SNHG6 sequence; (3) pcDNA3.1-SNHG6 group: cell transfected with over-expression SNHG6; (4) miR-139-5p inhibitor (inhibitor) group: Cells were transfected with miR-139-5p inhibitor; (5) miR-139-5p mimics (mimics) group: cells were transfected with chemically modified miR-139-5p mimics; (6) miR-139-5p inhibitor + si-SNHG6 group: miR-139-5p inhibitor modified cells were transfected with si-SHNG6 sequences. (7) si-SERPINH1 group: cells were transfected with si-SERPINH1 sequences. All the agents were purchased from FulenGen Co., Ltd (Shanghai, China).
Animal models
Female BALB/c mice (Guangdong Medical Laboratory Animal Center, Guangzhou, China) at 4 to 6 weeks old was selected as animal models. The average weight of mice was 25 g. They were raised in pathogen-free conditions under the feeding temperature of about 25°C. Mice in good physical health condition were selected for the experiments. HepG2 cells transfected with miR-139-5p mimics, miR-139-5p inhibitor or miR-139-5p inhibitor+si-SNHG6 were harvested from 6 well plates and suspended at 5 × 10⁶cells/mL. Then, we subcutaneously injected 100μl suspended cells into the armpits of mice. The mice were sacrificed 5 weeks after the injection with visible tumors taken for further analysis. All the experiment procedures were in line with the standard instruction guidelines for the use of laboratory animals and approved by the Animal Care and Use Committee in Sichuan Provincial People’s Hospital, University of Electronic Science and Technology of China.
Microarray analysis and target prediction
Gene expression profiles were obtained from Gene Expression Omnibus (GEO, https://www.ncbi.nlm.nih.gov/geo/) with the accession number GSE54238. Twelve normal liver samples and 12 HCC samples were selected for analysis. Differentially expressed lncRNAs and mRNAs were filtered by R version 3.4.1 (https://www.r-project.org/) with Limma. The criteria for DEGs were based on |fold change|>2 combined with adjusted P value less than 0.05 and results were exhibited in heatmaps. The target miRNAs screening and prediction of lncRNA&miRNA/miRNA&mRNA binding sites were carried out using miRcode (http://www.mircode.org/) and TargetScan (http://www.targetscan.org/vert_71/) and DIANA Tools (http://diana.imis.athena-innovation.gr/DianaTools).
Weighted gene co-expression network analysis (WGCNA)
WGCNA R package was utilized to identify the hub genes of every significant module, and the data was from GSE54238 microarray analysis result. Clusters of highly correlated genes were identified and summarized using the module eigengene or the intramodular hub gene. The adjacency matrix was transferred to the topological overlap matrix (TOM), modules were visualized by heatmap plots of gene-gene connectivity that were shown in TOMplot. To obtain modules with highly co-expressed genes, they were identified by hierarchical clustering, which separated individual cluster into hub-clusters and formed gene clustering trees. To determine the conservative of modules, we assessed modules by their Z scores. By performing Z summary statistics method, permutation Z scores were obtained to determine whether the module is better than a random sample of genes. Z summary was the summary of individual Z scores (the lower the Z summary, the more the module presentation). We could demonstrate the preservation of connectivity by performing this assay.
Establishment of co-expression network
To construct lncRNAs/mRNAs (hub genes) co-expression networks, “pearson” in “psych” package was applied to determine the correlations among DEGs in the selected hub genes and lncRNAs. The networks were adjusted by “BH”. Then, they were graphed using Cytoscape software. In these networks, nodes represented DEGs and the edges represented the existence of co-expression.
Dual luciferase reporter gene assay
The potential binding sites of miR-139-5p were predicted using TargetScan and miRanda websites. The predicted sequence of the miR-139-5p binding site was 3ʹ-UGACAUC-5ʹ. The wild types and mutant seed regions of SERPINH1 and SNHG6 were synthesized and cloned into two pET vectors. 5 × 10⁴ cells/well were added in 24-well plates. MiR-139-5p mimic or control mimic, pET-SERPINH1 3ʹUTR-WT vector or pET-SERPINH1 3ʹUTR-MUT vector, pET-SNHG6 3ʹUTR-WT vector or pET-SNHG6 3ʹUTR-MUT vector containing firefly luciferase reporter gene and 3ʹUTR of SERPINH1/SNHG6 gene (Promega, Madison, WI) were co-transfected by using Lipofectamine 2000. Forty-eight hours after the transfection, the luciferase activity was measured by Dual Luciferase Reporter Assay System (Promega).
RNA isolation and qRT-PCR
Total RNA was extracted using TRIzol reagent (Invitrogen, Carlsbad, CA, USA). Reverse transcription of mRNA and lncRNA was conducted with PrimeScriptTM RT Master Mix Kit (TaKaRa, Osaka, Japan). As for the detection of miRNA, the reverse transcription was performed using miRNA cDNA Synthesis Kit (ABM, Canada). QRT-PCR was carried out using the SYBR Green PCR Kit (Toyobo) under the standard instrument. Results were analyzed by an iQ5 quantitative RCR system (Bio-Rad, California, USA). β-actin or U6 was served as a control, 2−ΔΔCT values were normalized to β-actin levels. Each sample was measured in triplicate. Primers involved in this study were shown in Table 1.
Table 1.
Primer sequences for qRT-PCR.
| Genes | Sequences |
|---|---|
| SERPINH1 | F: 5’-CAGAAGTTTCTCGGGACGGG-3’ |
| R: 5’-GCCTGCCTTTTTCATTCTGGG-3’ | |
| MiR-139-5p | F: 5’- TCTACAGTGCACGTGTC -3’ |
| R: 5’- CAGGGTCCGAGGTATTC -3’ | |
| SNHG6 | F: 5’-TTAGTCATGCCGGTGTGGTG-3’ |
| R: 5’-ACCTATATGCTCAATACATGCCG-3’ | |
| U6 | F: 5’-GGAGCGAGATCCCTCCAAAAT-3’ |
| R: 5’-GGCTGTTGTCATACTTCTCATGG-3’ | |
| β-actin | F: 5’-CACCATTGGCAATGAGCGGTTC-3’ |
| R: 5’-AGGTCTTTGCGGATGTCCACGT-3’ |
Western blot assay
Total protein was extracted, and protein lysate was then obtained using RIPA buffer (Beyotime, China). The lysate was centrifuged at 14,000 rpm to obtain the supernatant about 20 μL for western blotting. Initially, protein samples were analyzed with SDS-PAGE then transferred to polyvinylidene difluoride membranes (Sigma, Germany). The membranes were washed with TBST, fixed in 5% BSA buffer, and incubated with primary antibodies: anti-SERPINH1 antibody (1/5000; ab109117; Abcam) and anti-β-actin antibody (1/2000; ab8226; Abcam). The secondary antibody was goat anti-rabbit IgG H&L (1/5000; ab6721; Abcam). Results of the immune reactions were obtained and visualized by using Pierce ECL-plus (Invitrogen, Carlsbad, CA).
Transwell assay
In cell migration assay, tissue culture inserts in 8-mm pore size were placed into the 24-well culture plates, which were separated into the upper and lower chambers (Corning, USA). Subsequently, 1 × 10⁵ cells/well were added into the upper chamber, 600 μL DMEM (10% FBS) was placed into the lower chamber. Cells that migrated cross the transwell membrane were fixed in 4% paraformaldehyde and stained with crystal violet 24 h after the incubation under humidified condition. The numbers of migrated cells were counted with a microscope (×100 magnification). The experiment was performed in triplicate. Cell invasion assay was almost the same as migration, except chambers were wrapped in Matrigel (BD Biosciences, San Jose, CA, USA) for invasion assays.
Cell cycle analysis
The cell cycle analysis was performed as the following description [22]. Briefly, 1 × 10⁶ HepG2 or Hep3b cells were collected and washed with PBS. The cells were stored in the freezer overnight after fixing with 70% pre-chilled ethanol. The cells were stained with propidium iodide (Sigma) after RNaseA treatment and analyzed with flow cytometry (Calibur; Becton Dickinson, Franklin Lakes, USA). The distribution of the cell cycle status was re-analyzed with FlowJo software (FlowJo LLC, Ashland, USA).
RNA immunoprecipitation (RIP) assay
RIP assays were conducted by using EZ-Magna RIP RNA-binding Protein Immunoprecipitation Kit (Millipore, USA) in accordance with standard protocol. HepG2 cells were lysed using RIP lysis buffer, then the cell lysates were incubated with RIP buffer including magnetic beads conjugated to a human anti-Ago2 antibody (Abcam), mouse IgG (Beyotime, China) was served as a control group. The co-precipitated RNAs were isolated using TRIzol reagent (TaKaRa, China), Ago-IPs were detected in triplicate.
Cell viability assay
Total of 1 × 10⁵ cells per well were placed into 96-well plates and inoculated for 12 h before treatment 24 h after cells transfection. The proliferation of HCC cells was analyzed 5 days after the treatment by MTS (Promega, Madison, WI). Twenty microliter of the reaction solution was supplemented into cultured cells and incubated at 37°C for 2 h, and the absorbance of the supernatant was detected at 24 h, 48 h and 72 h. The optical density was detected at 490 nm. Each assay was performed in triplicate.
Colony formation assay
Cells were made into single-cell suspensions with trypsin after transfection and incubated in 24-well plates with a density of 1 × 10³ cells per well. Cells were cultured for two weeks under the condition of 37°C with 5% CO2. 4% paraformaldehyde was prepared to fix cells. Images were captured and the visible colonies were counted using Image J software.
Statistical analysis
All the data was shown as mean value ± standard deviation (mean ± SD) in this study. Statistical comparison was conducted by analysis variance, and the analysis was performed using GraphPad Prism 6.0 (GraphPad Software, Inc. San Diego, CA). Statistical comparison between two experimental groups was conducted using Mann–Whitney U test. In addition, Kruskal–Wallis test was used for the comparison among more than two groups with Dunn’s multiple comparison test as a post-hoc test. P< 0.05 was considered to be statistically significant.
Results
Expression profiles of mRNAs and lncrnas in HCC
Fold-change (tumor compared with normal controls) and P value were calculated by normalized expression. By using microarray assays, DEGs were screened out (FC ≥ 2.0, P < 0.05). After microarray analysis, 20 most differentially expressed genes (DEGs) were shown in the heat map (Figure 1a) and SERPINH1 was obviously up-regulated in HCC cells among these DEGs. Above all, we concluded that the regulation of SERPINH1 may exert some influences on the occurrence and progression of HCC.
Figure 1.
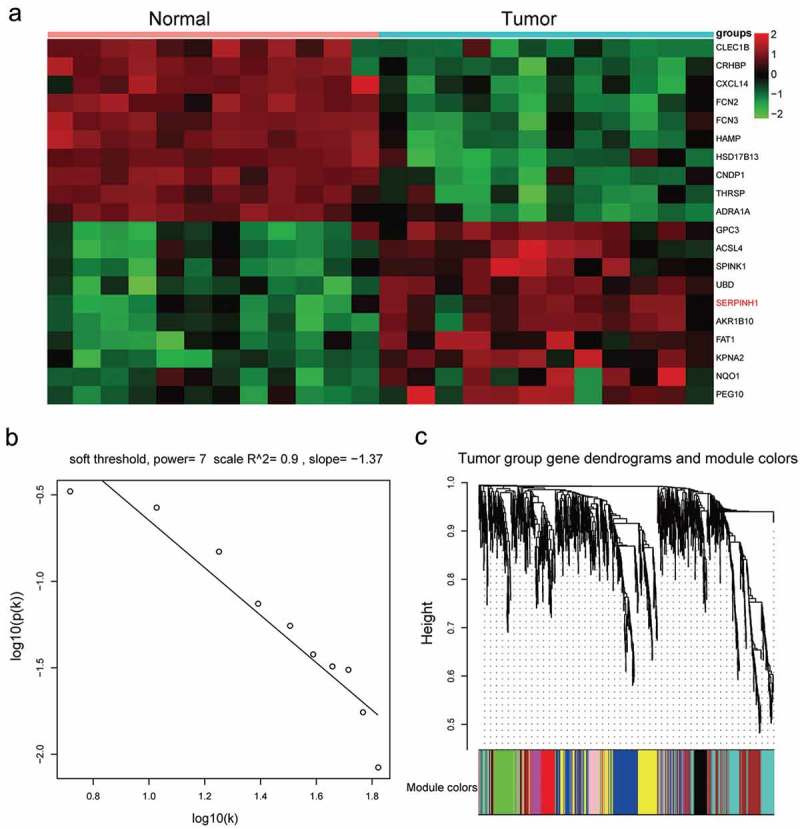
SERPINH1 was up-regulated in HCC tissues. (a) Heatmap diagram generated by unsupervised clustering analysis with differentially expressed mRNAs in 12 paired HCC tissues and adjacent normal tissues. (b) Log-log plot of whole-network connectivity distribution. The x-axis showed the logarithm of whole network connectivity, y-axis showed the logarithm of the corresponding frequency distribution. On this plot, the distribution approximately followed a straight line, which is referred to an approximately scale-free topology. (c) Hierarchical cluster dendrogram derived from all the differentially expressed genes (DEGs) defined nine modules. Different colors below the diagram represented different modules.
Construction of co-expression modules of HCC
The co-expression module was constructed by using the WGCNA package tool. Based on soft power value was 7, the relevant independence degree of modules was 0.9 (Figure 1b). The power value was used to construct a co-expression module. The results of gene dendrograms showed that there were nine distinct gene co-expression modules in HCC. These distinct modules of co-expressed mRNAs were shown in different colors (Figure 1c). Branches of gene dendrograms illustrated different groups of genes. The interactions of the nine co-expression modules were visualized in Figure 2a-B. By using MDS plot with two dimensions, the analyzed modules tended to correspond to “fingers”, and the intramodular hubs were shown in the fingertips. Genes in magenta and yellow modules showed significance in HCC, especially the genes in the magenta module (Figure 2c,d). The flashClust tools package was utilized to analyze the cluster on these modules to obtain the tree, the results were shown in Figure 2e. According to the Z scores of all modules (Figure 2f), only five modules got Z summary <10, which suggested that these modules were significantly better than a random sample of genes. All the hub genes corresponding to these five modules were identified in Figure 3a, and SERPINH1 was the hub gene in the magenta module. Weighted gene co-expression network of the magenta module was illustrated in Figure 3b, and the results showed that the mRNA SERPINH1 was in the center of the network. In addition, details of weighted gene co-expression network of the magenta module were shown in Supplementary Table S1. Hence, it was determined that SERPINH1 was highly expressed hub gene in HCC.
Figure 2.
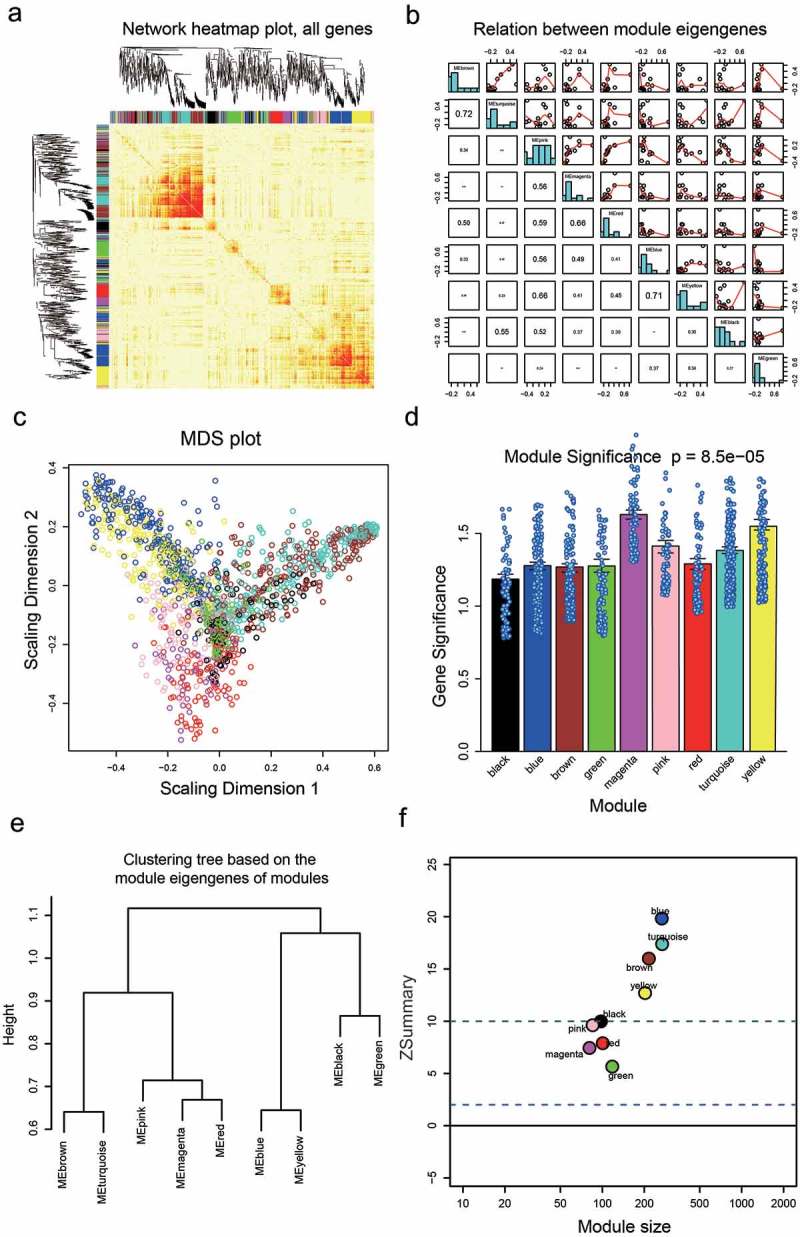
Network visualization plots. (a) Visualization of the gene network using a heat map plot. The heat map depicted the Topological Overlap Matrix (TOM) among all genes in the analysis. Light color represented low overlap and progressively darker red color represents higher overlap. Blocks of dark colors along the diagonal are the modules. The gene dendrogram and module assignment were also shown along the left side and the top. (b) Pairwise scatterplots of module eigengenes and the trait y. (c) Multi-dimensional scaling plot in which modules tend to correspond to “fingers”. Intramodular hubs are in the fingertips. (d) Barplot of mean gene significance across modules. The higher the mean gene significance in a module, the more significantly relative the module is to the clinical trait of interest. (e) Hierarchical clustering dendrogram of module eigengenes. The brown and turquoise, the blue and yellow, the magenta and red are highly related, as evidenced by their low merging height. (f) Corresponding Z summary scores and module size of different modules reflect the preservation of modules.
Figure 3.
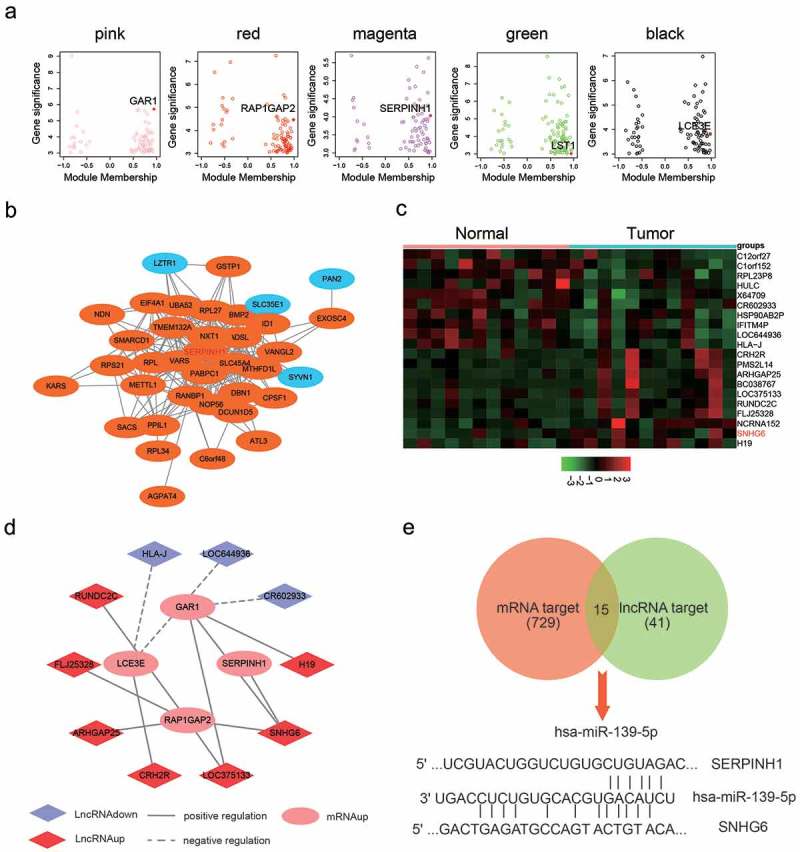
Co-expression network between mRNAs and lncRNAs. (a) The hub genes corresponding to each module were identified, especially SERPINH1 is the hub gene in the magenta module. (b) PPI of genes in the magenta module, red color one represents the high expression, blue one represented a low expression. (c) Heat map diagram generated by unsupervised clustering analysis with 12 pairs differentially expressed lncRNAs in HCC tissues and adjacent normal tissues. (d) Co-expression of SNHG6 and SERPINH1. Up-regulated mRNA was indicated to pink circle, up-regulated lncRNA was indicated to red Rhombus and down-regulated lncRNA was indicated to light purple Rhombus. (e) 15 miRNAs that possessed possibly targeted relationships with mRNAs and lncRNAs were determined by Venn diagram.
Co-expression network between lncRNAs and mRNAs in HCC
Next, we intended to screen an appropriate lncRNA with microarray analysis, differentially expressed lncRNAs were filtered under the condition of |log2fold change|>1 and P< 0.05, and 20 most differentially expressed lncRNAs were shown in the heat map (Figure 3c). Co-expression network was constructed based on hub genes and lncRNAs, which were shown in Figure 3d. Both SERPINH1 and SNHG6 were up-regulated in HCC cells, and there was a positive association between them. Using miRCode, TargetScan and DIANA Tools, we analyzed the target miRNAs of SERPINH1 and SNHG6 in HCC cells, and the results were shown in the Venn diagram (Figure 3e). As a result, 15 miRNAs that existed possible targeted relationship with mRNAs and lncRNAs were determined. Therefore, miR-139-5p selected for the following studies.
Expression level of SNHG6 in HCC tissues and cell lines
The expression level of SNHG6 in HCC samples was significantly higher than in the control group (**P = 0.0038, Figure 4a). In addition, SNHG6 expression level in five cultured cell lines, including the normal liver cell line, HL-7702, and four HCC cell lines (HepG2, Hep3b, HLE, Huh7) was compared. Based on the results of qRT-PCR, the SNHG6 expression level was up-regulated in all four HCC cell lines, especially in HepG2 HCC cell line compared with HL-7702 cell line (**PHepG2 = 0.0093, *PHep3b = 0.018, *PHLE = 0.030, *PHuh-7 = 0.044, Figure 4b). Besides, the results of QRT-PCR showed that SNHG6 expression was remarkably down-regulated by si-SNHG6 (**P = 0.0022, **P = 0.0049, Figure 4c), while SNHG6 expression was increased with transfection of pcDNA3.1-SNHG6 (**P = 0.0014, **P = 0.0036, Figure 4e). MTT assay was performed to assess cell viability activity in different transfection groups, and the results exhibited cell viability was conspicuously weakened by si-SNHG6, while enhanced by pcDNA3.1-SNHG6 (*P = 0.040, *P = 0.026, *P = 0.019, *P = 0.011; **P = 0.0031, **P = 0.0057, *P = 0.019, **P = 0.0079, Figure 4d,f). MiR-139-5p was significantly up-regulated by si-SNHG6, while down-regulated by pcDNA3.1-SNHG6. On the contrary, SERPINH1 was down-regulated in the si-SNHG6 group and highly expressed in pcDNA3.1-SNHG6 group (**P = 0.0044, **P = 0.0013, **P = 0.0043, **P = 0.0024; **P = 0.0092, **P = 0.0065, **P = 0.0086, **P = 0.0038, Figure 4g).
Figure 4.
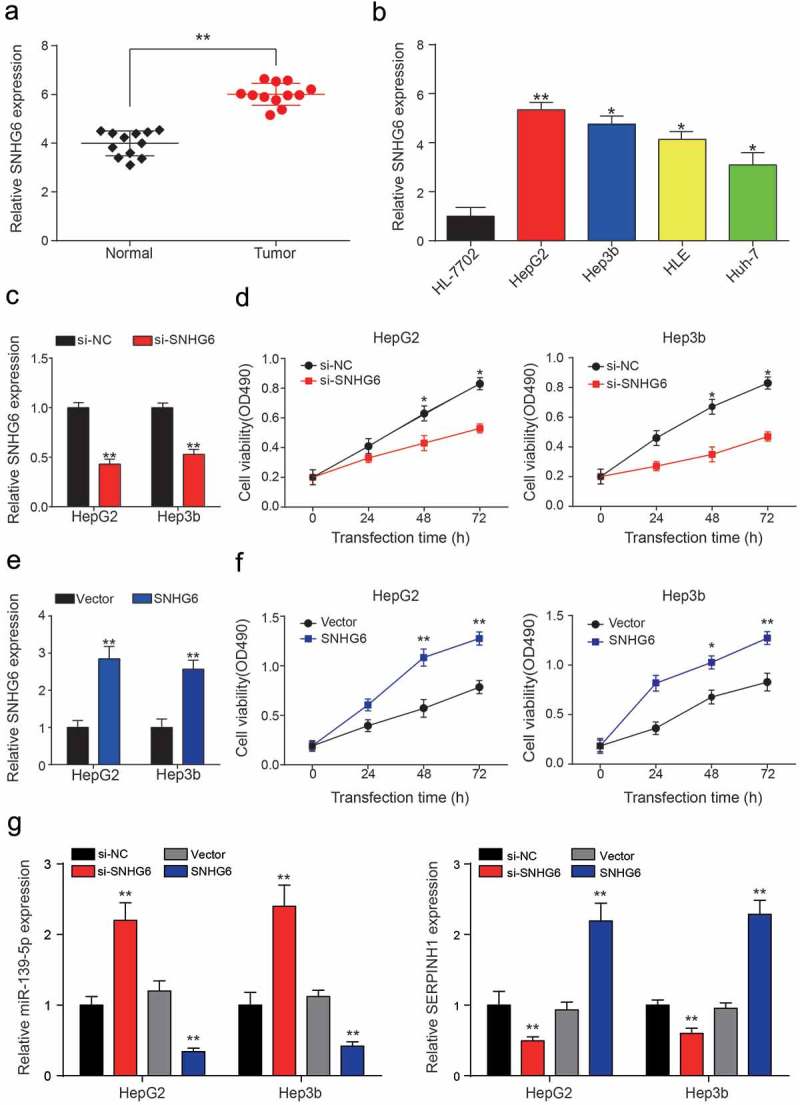
SNHG6 was highly expressed in HCC cells. (a) SNHG6 was significantly higher expressed in HCC tissues compared with adjacent normal tissues, expression levels were calculated from the gene/β-actin expression ratio (**P< 0.01, compared with a normal group). (b) SNHG6 expression level in one normal liver cell line: HL-7702 and four HCC cell lines: HepG2, Hep3b, HLE and Huh7. (*P< 0.05, **P< 0.01, compared with HL-7702 group) (c) QRT-PCR showed SNHG6 expression levels in HepG2 and Hep3b cell lines were down-regulated by si-SNHG6. (**P< 0.01, compared with a si-NC group, respectively) (d) Cell viability of two HCC cell lines was analyzed by MTT assay. The inhibition of SNHG6 can significantly decrease the cell viability compared with the NC group. (*P< 0.05, compared with a si-NC group, respectively) (e) QRT-PCR showed SNHG6 expression levels in HepG2 and Hep3b cell lines were up-regulated by pcDNA3.1-SNHG6. (**P< 0.01, compared with Vector group, respectively) (f) MTT assay exhibited pcDNA3.1-SNHG6 can significantly increase the cell viability compared with the vector group. (*P< 0.05, **P< 0.01, compared with Vector group, respectively) (g) Down-stream miR-139-5p and SERPINH1 expressions in different transcription groups were detected by QRT-PCR (**P< 0.01, compared with si-NC or Vector group, respectively). Every experiment was performed for 3 times at least.
Stimulative effects of SNHG6 on cell migration and invasion in HCC cells
Based on the observation results in the si-SNHG6 group, colony number in HepG2 and Hep3b cells was significantly decreased compared with si-NC group (**P = 0.0049, **P = 0.0026, Figure 5a). Up-regulation of SNHG6 in HCC cell lines encouraged us to study whether the inhibition of SNHG6 would suppress HCC migration and invasion. HepG2 and Hep3b cell lines were also selected because they possessed the highest expression level of SNHG6 expression among the four HCC cell lines. In cell migration assay, inhibition of SNHG6 significantly suppressed the numbers of migrating cells in both HepG2 and Hep3b cell lines (*P = 0.047, *P = 0.025; *P = 0.040, *P = 0.033, Figure 5b). Cell invasion assay showed the similar results with cell migration assay. To further demonstrate the up-regulation of SNHG6 in HCC cell lines, the cell cycle was analyzed by flow cytometry, and the results were shown in Figure 5c. We observed that the percentage of G0/G1 of two cell lines showed an increase from si-NC group to si-SNHG6 group (*P = 0.038, *P = 0.050), which suggested that the inhibition of SNHG6 expression can block the cell cycle of HCC cell lines. Overexpression of SNHG6 in liver cancer cell lines was conducted. Colony formation assay showed cell proliferation ability was boosted with the over-expression of SNHG6 (**P = 0.0057, **P = 0.0009, Figure 6a). Similarly, cell migration and invasion capability were enhanced by pcDNA3.1-SNHG6 (**P = 0.0066, **P = 0.0089; **P = 0.082, P = **0.099, Figure 6b). The percentage of G0/G1 of two cell lines significantly decreased in the pcDNA3.1-SNHG6 group (*P = 0.021, **P = 0.010, Figure 6c). In summary, these results demonstrated that SNHG6 played a significant role in HCC progression.
Figure 5.
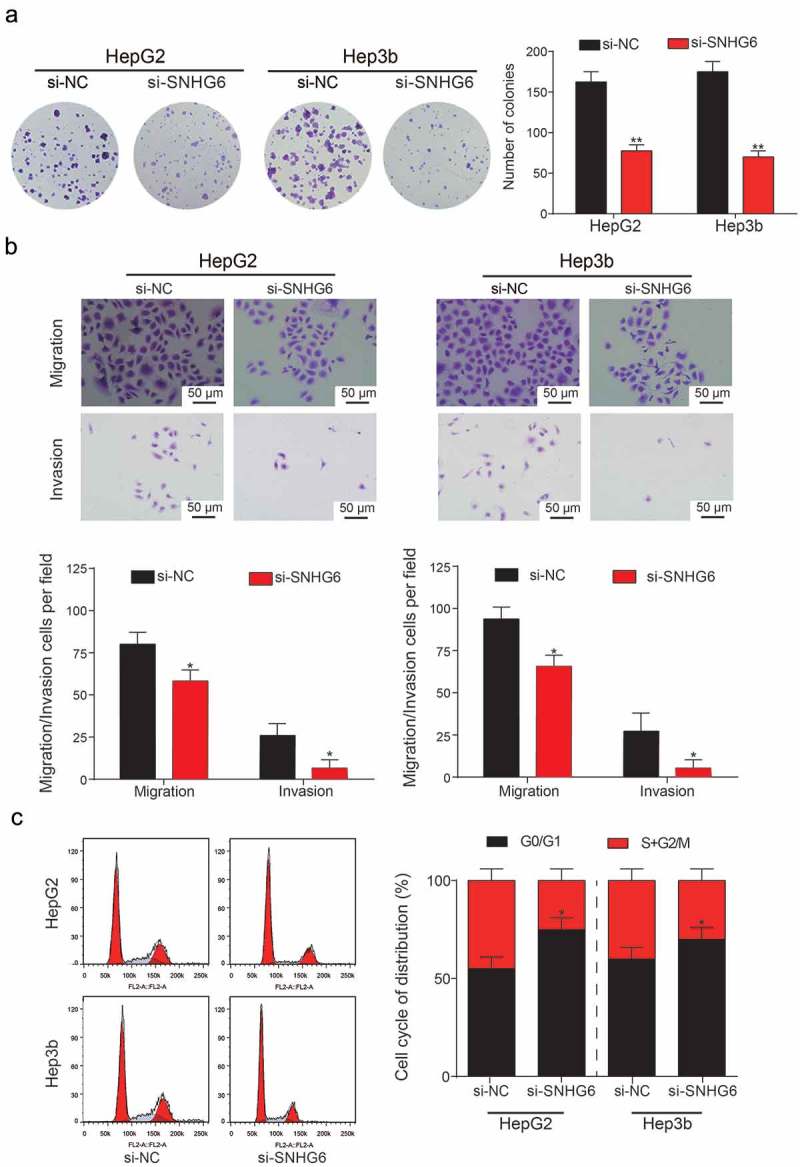
Si-SNHG6 inhibited the proliferation and viability of HCC cells. (a) Colony numbers in the si-SNHG6 group and the si-NC group were counted and compared. Knockdown of SNHG6 showed a significant decrease in the number of HCC cells. (**P< 0.01, compared with the si-NC group) (b) Migration and invasion rate of HepG2 and Hep3b cells in different transfection groups, the migration cells and invasion cells per field suggest the migration and invasion rate of cells. (*P< 0.05, compared with a si-NC group) (c) Flow cytometry analysis of the cell cycle phase distribution. Representative cell cycle analysis (left panel). Results are represented as mean ± SD (*P< 0.05, compared with a si-NC group). Every experiment was performed for 3 times at least.
Figure 6.
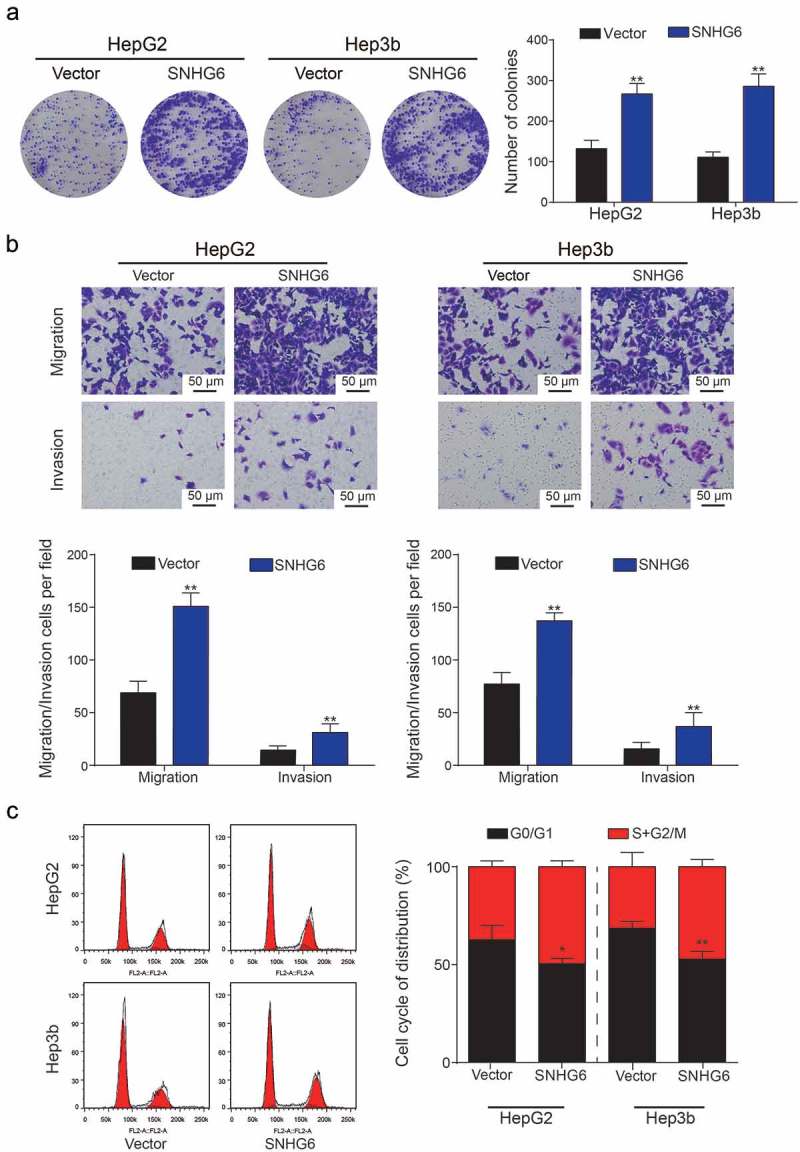
SNHG6 promoted the proliferation and viability of HCC cells. (a) Colony numbers in SNHG6 group and vector group were counted and compared. Overexpression of SNHG6 showed a significant increase in the number of hepatoma cells. (**P< 0.01, compared with Vector group) (b) Migration and invasion rate of HepG2 and Hep3b cells in different transfection groups, the migration cells and invasion cells per field suggested the migration and invasion rate of cells. (**P< 0.01, compared with Vector group) (c) Cell cycle analysis showed cell cycle was activated by SNHG6 (*P< 0.05, **P< 0.01, compared with Vector group). Every experiment was performed for 3 times at least.
Targeted relationship between SNHG6 and miR-139-5p
MiR-139-5p was screened out previously by using a Venn diagram. We performed luciferase reporter assay to determine the targeted relationship between miR-139-5p and SNHG6, the binding sites were shown in Figure 7a. After binding to the miR-139-5p by SNHG6, the luciferase activity in SNHG6-wt group was significantly decreased compared with the SNHG6-mut group (**P = 0.0028, Figure 7b). In Figure 7c, as expected, RNAs were significantly more enriched in the Ago-IP fractions of HepG2 cells compared with IgG-IP group (***P< 0.001). Besides, miR-139-5p expression levels in HCC tissues and normal tissues were detected by qRT-PCR, the results showed that miR-139-5p expression was significantly decreased in tumor group compared with normal group (**P = 0.0049, Figure 7d). We also indicated that the miR-139-5p expression levels in five cell lines (HepG2, Hep3b, HLE, Huh-7 and the normal cell line HL-7702). It showed that miR-139-5p expression was obviously down-regulated in all four HCC cell lines compared with HL-7702 cell line (**P = 0.0062, **P = 0.0032, *P = 0.020, **P = 0.0048, Figure 7e).
Figure 7.
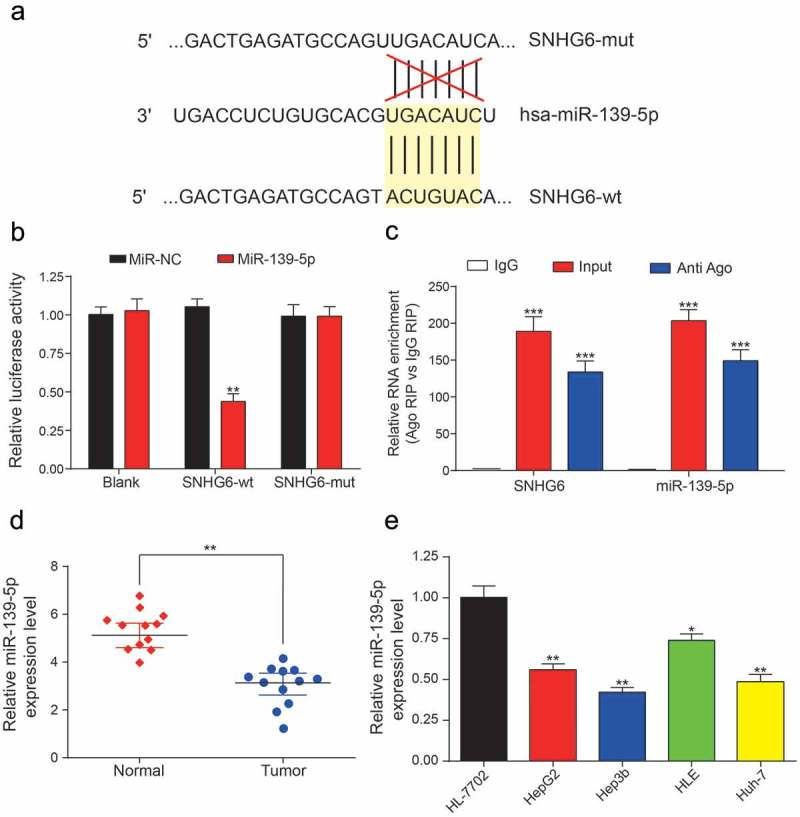
Direct targeted relationship between SNHG6 and miR-139-5p. (a) The binding sites between wild type SNHG6/mutant SNHG6 and miR-139-5p. (b) Dual luciferase reporter gene assay verified that miR-139-5p could be targeted by SNHG6-wt rather than SNHG6-mut (*P< 0.05, compared with the miR-NC group) (c) MiR-139-5p and SNHG6 abundance in Ago-RIP fractions as measured by qRT-PCR. (d-e) MiR-139-5p expression was significantly lower in HCC tissues and cell lines compared with adjacent normal tissues and normal liver cell line, respectively. Expression levels were calculated from the gene/β-actin expression ratio (*P< 0.05, **P< 0.01, compared with the normal group or HL-7702 group). Every experiment was performed for 3 times at least.
Inhibition of miR-139-5p can induce the viability and proliferation of HCC cells
QRT-PCR and western blot assays were conducted to verify the direct targeted relationship between SNHG6 and miR-139-5p (**P = 0.0014, **P = 0.0052, Figure 8a). Dy-regulation of miR-139-5p was observed to have no influence on SNHG6 expression, which suggested that miR-139-5p could not influence the expression of SNHG6. MTT assay was conducted again to analyze cell viability before and after the transfection of miR-139-5p inhibitor/mimics (Figure 8b), the inhibitor transfection group showed significantly higher cell viability compared with NC group (*P = 0.048) while the miR-139-5p mimics group showed significantly lower cell viability than NC group (**P = 0.0035). In addition, we found that the inhibition of miR-139-5p can significantly increase the number of colonies in HCC cell lines (*P = 0.042, *P = 0.031, Figure 8c). While this increase can be neutralized by the inhibition of SNHG6 since colony numbers in Inhibitor+si-SNHG6 group was found similar to the NC group.
Figure 8.
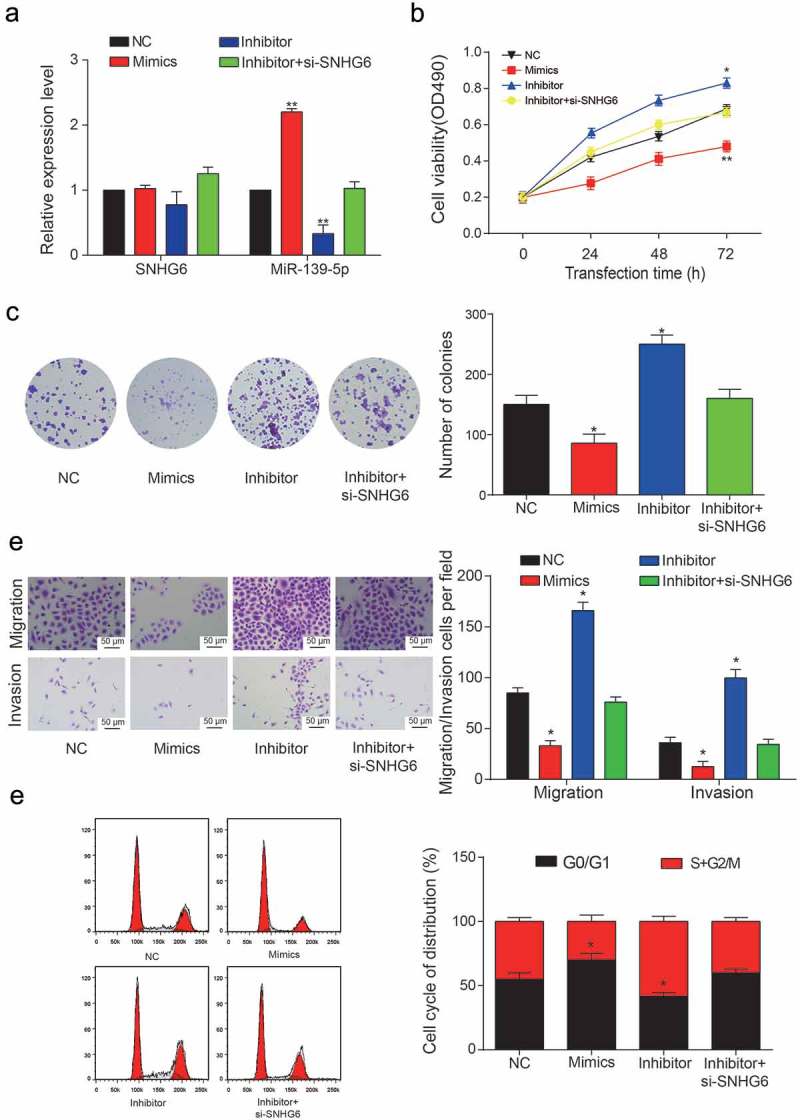
miR-139-5p inhibited the proliferation and viability of HCC cells. (a) Relative expression levels of SNHG6 and miR-139-5p in four transfection groups. (**P< 0.01, compared with NC group) (b) Cell viability of HepG2 cells was analyzed by MTT assay. OD value measurement was carried out in four transfection groups under 490 nm. (*P< 0.05, **P< 0.01, compared with NC group) (c) Colony numbers in four transfection groups were counted and compared. The inhibition of miR-139-5p showed a significant increase in the number of HCC cells. (*P< 0.05, compared with NC group) (d) Migration and invasion rate of HepG2 cells in different transfection groups, the migration cells and invasion cells per field suggested the migration and invasion rate of cells. (*P< 0.05, compared with NC group) (e) Cell cycle analysis of the cell cycle phase distribution. Representative cell cycle analysis (left panel). (*P< 0.05, compared with NC group). One-way ANOVA was used in Figure 8B. Student’s two-tailed t-test was used in the remaining figures. Every experiment was performed for 3 times at least.
In migration and invasion assay, the inhibition of miR-139-5p can significantly increase both migration and invasion rate of HCC cells, while the miR-139-5p mimics can significantly suppress HCC cells migration and invasion rate (*P = 0.033, *P = 0.016; *P = 0.046, *P = 0.022, Figure 8d). The cell cycle of HepG2 and Hep3b cell lines were analyzed by flow cytometry, the inhibition of miR-139-5p can extend the cell cycle of HCC cells because the G0/G1 stage took smaller percentage compared to the cells in NC group (*P = 0.043, *P = 0.029, Figure 8e). While the inhibition of SNHG6 can promote the expression of miR-139-5p, the cell cycle of HCC cells in the inhibitor+si-SNHG6 group was similar to that in the NC group.
miR-139-5p mediated HCC progression via targeting SERPINH1
In addition, our further studies showed that the 3ʹUTR of SERPINH1 contains a conserved binding site for miR-139-5p, and the binding sites were shown in Figure 9a. The results of luciferase reporter assay showed that miR-139-5p obviously suppressed the luciferase activity of SERPINH1-wt 3ʹUTR reporter gene (**P = 0.0076, Figure 9b). Therefore, these results suggested that SERPINH1 was the direct target of miR-139-5p in HCC. Both mRNA and protein level of SERPINH1 were down-regulated by miR-139-5p mimics or instead up-regulated by miR-139-5p inhibitor, and the results were shown in Figure 9c (*P = 0.044, *P = 0.013). Besides, the results of QRT-PCR and western blot showed that SERPINH1 was significantly up-regulated in HCC tissues and cells (**P = 0.0029; **P= 0.0087, *P = 0.023, *P = 0.050, *P = 0.046, Figure 9d,e). Similar with the results of SNHG6, overexpression of SERPINH1 can promote the cell viability dramatically, while the inhibition of SERPINH1 can suppress the cell viability dramatically (*P = 0.038, *P = 0.024; *P = 0.045, *P = 0.041, Figure 10a,b). However, the addition of miR-139-5p can inhibit SERPIN1 expression. Cell viability of SERPINH1+ miR-139-5p group was similar to the NC group. Additionally, the number of colonies in the SERPINH1 group was almost two times than the number of colonies in the NC group (*P = 0.045, *P = 0.026, Figure 10c). The results of migration and invasion assay were shown in Figure 10d, the overexpression of SERPINH1 can induce the migration and invasion of HCC cells significantly (*P = 0.024, *P = 0.019, *P = 0.033, *P = 0.010), while the results showed in SERPINH1+ miR-139-5p group were similar with the NC group. In cell cycle assay, we found the HCC cells in the si-SERPINH1 group were detained in G0/G1 stage, while the overexpression of SERPINH1 can accelerate the cell cycle of HCC cells (*P = 0.042, *P = 0.031, Figure 10e).
Figure 9.
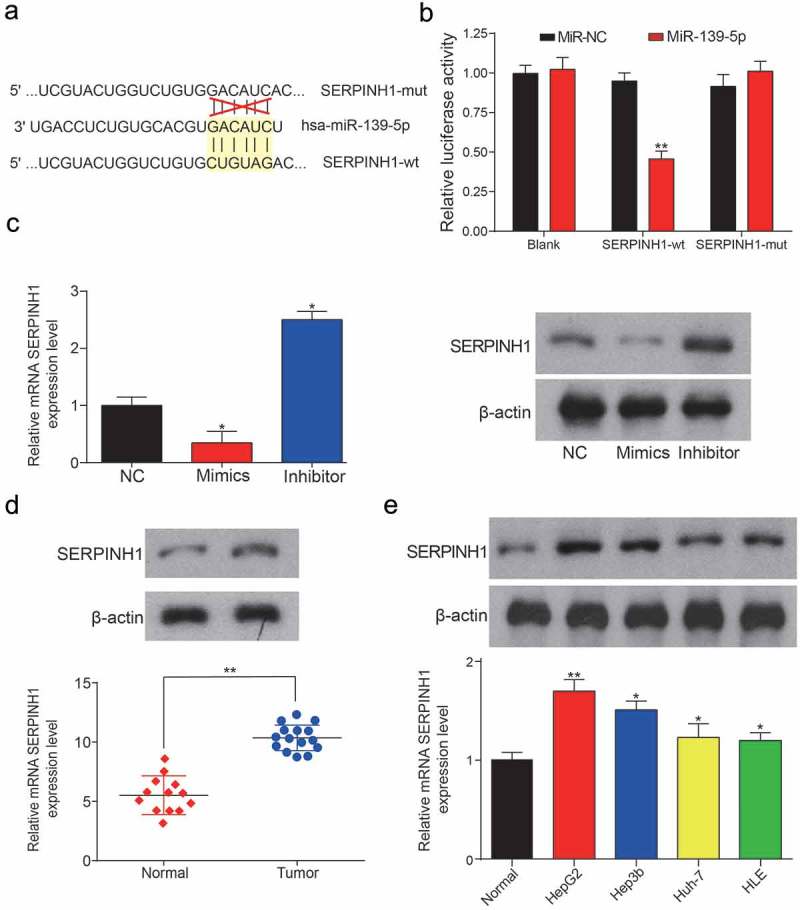
MiR-139-5p can directly target SERPINH1. (a) The binding sites between wild type SERPINH1/mutant SERPINH1 and miR-139-5p. (b) Dual luciferase reporter assay verified that miR-139-5p could target at SERPINH1-wt rather than SERPINH1-mut (**P< 0.01, compared with the miR-NC group) (c) Relative expression level of mRNA SERPINH1 in miR-139-5p mimics group, miR-139-5p inhibitor group and negative control group. The results were determined by qRT-PCR and western blot. (*P< 0.05, compared with NC group) (d) SERPINH1 was significantly higher expressed in HCC tissues compared with adjacent normal tissues, expression levels were calculated from the gene/β-actin expression ratio (**P< 0.01, compared with a normal group). (e) Relative expression level of SERPINH1 in normal liver cell line and four HCC cell lines (*P< 0.05, ** P< 0.01, compared with normal control). Every experiment was performed for 3 times at least.
Figure 10.
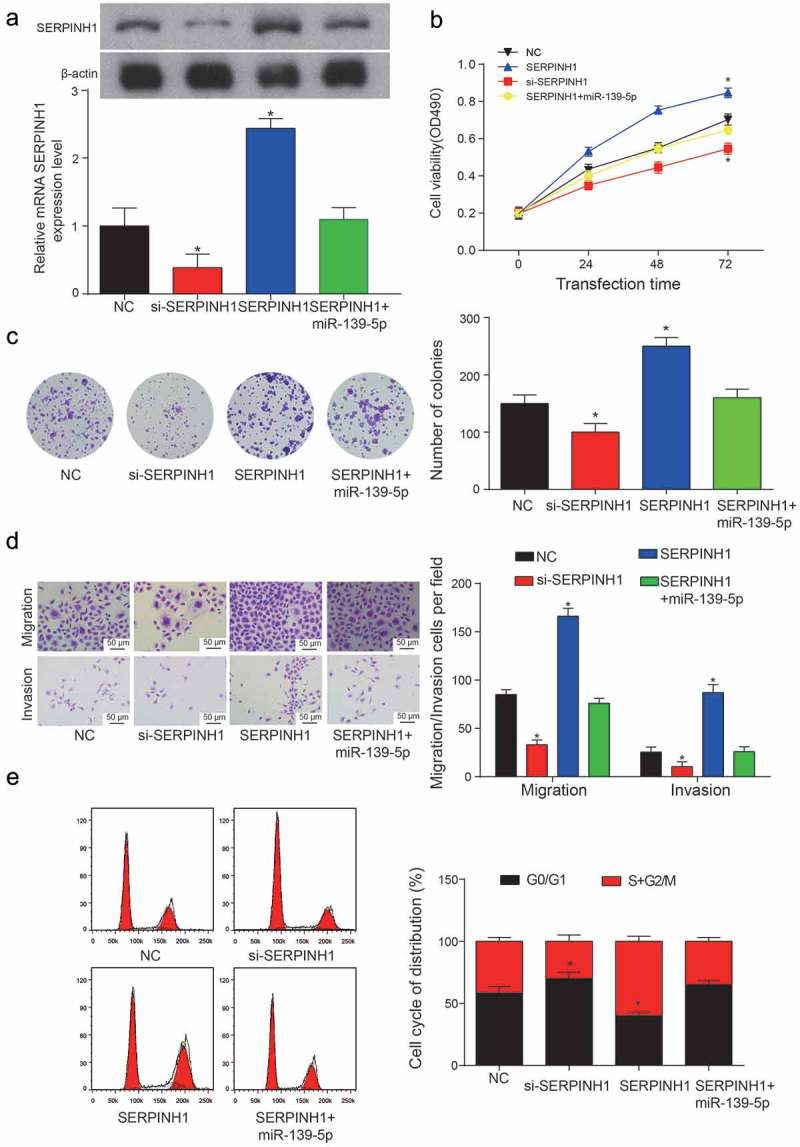
SERPINH1 promoted the proliferation and viability of HCC cells. (a) Relative expression levels of SERPINH1 in NC group, si-SERPINH1 transfection group, SERPINH1 group and SERPINH1+ miR-139-5p transfection group (*P< 0.05, compared with NC group). (b) Cell viability of HepG2 cell line was analyzed by MTT assay. (*P< 0.05, compared with NC group) (c) Colony numbers were counted and compared between three transfection groups and NC group. The inhibition of SERPINH1 showed a significant decrease in the number of HepG2 cells. (*P< 0.05, compared with NC group) (d) Migration and invasion rate of HepG2 cells in different transfection groups, the migration cells and invasion cells per field suggest the migration and invasion rate of cells. (*P< 0.05, compared with NC group) (e) Cell cycle analysis of the cell cycle phase distribution was represented as mean ± SD (* means P< 0.05 compared to NC group). Every experiment was performed for 3 times at least.
miR-139-5p can inhibit HCC tumorigenesis in vivo
Transfected efficiency was identified through analyzing the expression levels of miR-139-5p and mRNA SERPINH1 (***P < 0.0001, **P = 0.0057; *P = 0.031, *P = 0.022, Figure 11a-B), and results suggested that the overexpression of miR-139-5p can significantly suppress mRNA SERPINH1 expression, while inhibition of miR-139-5p can significantly induce the level of SERPINH1 mRNA, which also suggested the transfection was successful. Additionally, the function of miR-139-5p was validated in vivo. The subcutaneous tumors in mouse models were obtained, and the volume and weight of tumors were measured after inoculation, and all the results were shown in Figure 11c. Besides, the inhibition of miR-139-5p can dramatically increase the tumor volume and weight (**P = 0.0076; *P = 0.029), while overexpression of miR-139-5p can significantly inhibit the volume and weight of subcutaneous tumors (**P = 0.0065; **P = 0.046). The volume and weight of tumor in the inhibitor+si-SNHG6 group showed no difference from that of the NC group. The images of tumors induced by NC, mimics, inhibitor or inhibitor+si-SNHG6 were shown in Figure 11d.
Figure 11.
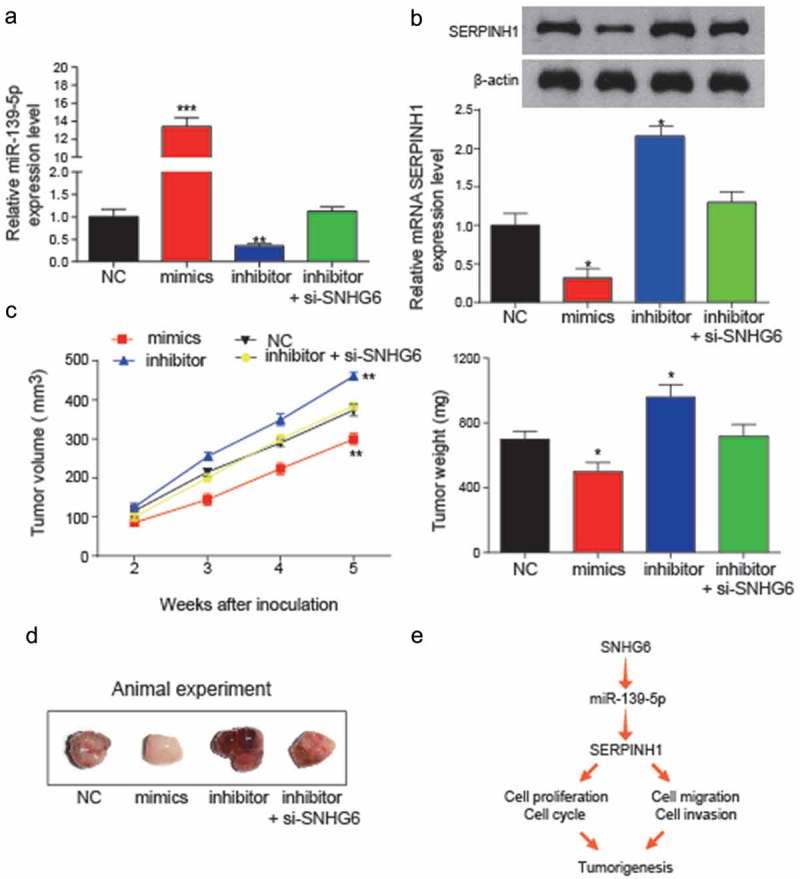
In vivo assay was used to validate the effects of miR-139-5p and SNHG6 on tumor growth. (a) Expression levels of miR-139-5p in transfection groups were analyzed to verify the transfection efficiency (**P< 0.01, compared with NC group). (b) Relative expression levels of SERPINH1 in transfection groups were detected by qRT-PCR and western blot. The inhibition of miR-139-5p could significantly induce the expression level of SERPINH1. (*P< 0.05, compared with NC group) (c) miR-139-5p inhibited HCC cell growth in vivo. Tumor growth curve of NC, mimics, miR-139-5p inhibitor, miR-139-5p inhibitor + si-SNHG6 transfected HepG2 cells in nude mice was shown as mean ± SD (left panel). The changes in tumor weight among different inoculation groups (right panel). (*P< 0.05, ** P< 0.01, compared to NC group) (d) Images of the tumors induced by NC, mimics, miR-139-5p inhibitor or miR-139-5p inhibitor+si-SNHG6 transfected were shown. (e) The conclusion of the regulation relationship among SNHG6, miR-139-5p and SERPINH1, and their regulation might influence the cell cycle, cell proliferation, cell migration and invasion and further influence the HCC tumorigenesis. Every experiment was performed for 3 times at least.
By conducting these in vitro and in vivo experiments, a flowchart was made to estimate the co-expression of SNHG6 and SERPINH1 may have a direct target relationship with miR-139-5p. Up-regulation of SNHG6 in HCC cells could inhibit miR-139-5p expression, and the inhibition of miR-139-5p could further induce SERPINH1 expression, which could promote the cell proliferation and viability of HCC cells and induce the occurrence and progression of HCC (Figure 11e).
Discussion
Currently, multiple evidences revealed that lncRNAs are aberrantly expressed in various cancers where they act as tumor suppressors or oncogenes [23,24]. In addition, a novel co-expression network between lncRNAs and mRNAs has been studied, and the regulatory mechanism is predicted to be related to their competition in binding miRNA targets [25,26]. However, the underlying functional mechanism of lncRNAs dysregulation remains to be challenging. In our study, SNHG6 was selected for comparing the expression level between HCC tissues and cells with normal controls. Based on our results, SNHG6 was up-regulated in most cases of HCC, which was consistent with the findings from Birgani et al. Besides, they also identified that the up-regulated SNHG6 was related to the poor survival rate of HCC patients with a high possibility[27].
Additionally, the co-expression of SNHG6 and SERPINH1 was determined in this study, and the target relationship between miR-139-5p and SNHG6 was also demonstrated. In many previous studies, SERPINH1 was reported to be up-regulated in cancers and fibrotic diseases [28,29]. Moreover, it has been suggested that SERPINH1 expression was regulated by miR-29a directly in lung cancer cells[15], this finding underlines the close connection between SERPINH1 dysregulation and lung cancer.
Besides the targeted relationship between miR-139-5p and SERPINH1, the regulation of SNHG6 was critical in controlling the development of HCC. The study of C Cao and T Zhang et al. reported that SNHG6-003 could function as a sponge in HCC and control the expression of miR-26 in HCC tissues [16,30]. Their study stimulated us to figure out the relationship between miR-139-5p and SERPINH1, to see if the regulatory control of SNHG6 to miR-139-5p can provide a further direct regulation on SERPINH1. The results of this study demonstrated the tumorigenic roles of SNHG6 and SERPINH1 in HCC cells, overexpression of them can induce cell progression both in vivo and in vitro. Furthermore, the positive regulation between SNHG6 and SERPINH1 was revealed.
Over-expression of miR-139-5p was found to suppress the cell migration, invasion and metastasis. According to the research of Wong CC, Wong CM et al., they investigated the expression of miR-139 and identified its significant down-regulation in advanced HCC[31]. Besides, the down-regulation of miR-139 has been reported in several studies in other cancers like head cancer and squamous cell carcinoma [32,33]. However, the biological consequences of the dysregulation of miR-139 in human cancer remain to be characterized. In this study, we identified that the up-regulated SNHG6 in HCC can directly suppress miR-139-5p expression, the inhibition of miR-139-5p can further target SERPINH1 expression and accelerate HCC migration and invasion. Further investigations to identify the biological pathway involved in the RNA regulations will enrich our understanding of the regulations of HCC progression. In conclusion, our study has identified a critical anti-metastatic miRNA, miR-139-5p, which was down-regulated in HCC. The positive regulation between SNHG6 and SERPINH1 has also been identified in this study. The inhibition of SNHG6 could induce miR-139-5p expression level in HCC. Overexpression of miR-139-5p could suppress SERPINH1 expression level and further inhibiting the progression of HCC cells. All the experiment results in this study suggested that SNHG6 could function as an oncogene in HCC. The effects of SNHG6/miR-139/SERPINH1 regulation axis on HCC progression had not been investigated before.
Funding Statement
This work was supported by grants from the National Natural Science Foundation of China (Grant No.: 81302161) and the Health and Family Planning Commission of Sichuan Province (Grant No.: 150215).
Disclosure statement
No potential conflict of interest was reported by the authors.
Ethics approval and consent to participate
This study was authorized by Sichuan Provincial People’s Hospital, University of Electronic Science and Technology of China, and obtained written informed consents from all the participants.
Supplementary Material
Supplemental data for this article can be accessed here.
Correction Statement
This article has been republished with minor changes. These changes do not impact the academic content of the article.
References
- [1].Choo SP, Tan WL, Goh BK, et al. Comparison of hepatocellular carcinoma in Eastern versus Western populations. Cancer. 2016;122(22):3430–3446. [DOI] [PubMed] [Google Scholar]
- [2].Llovet JM, Zucman-Rossi J, Pikarsky E, et al. Hepatocellular carcinoma. Nat Rev Dis Primers. 2016;2:16018. [DOI] [PubMed] [Google Scholar]
- [3].Forner A, Gilabert M, Bruix J, et al. Treatment of intermediate-stage hepatocellular carcinoma. Nat Rev Clin Oncol. 2014;11:525–535. [DOI] [PubMed] [Google Scholar]
- [4].Nakamoto Y. Promising new strategies for hepatocellular carcinoma. Hepatol Res. 2017;47:251–265. [DOI] [PubMed] [Google Scholar]
- [5].Zhu J, Liu S, Ye F, et al. The long noncoding RNA expression profile of hepatocellular carcinoma identified by microarray analysis. PLoS One. 2014;9:e101707. [DOI] [PMC free article] [PubMed] [Google Scholar]
- [6].Miranda-Castro R, de-Los-Santos-Alvarez N, Lobo-Castanon MJ. Long noncoding RNAs: from genomic junk to rising stars in the early detection of cancer. Anal Bioanal Chem. 2019. DOI: 10.1007/s00216-019-01607-6. PMID:30683966 [DOI] [PubMed] [Google Scholar]
- [7].Huarte M. The emerging role of lncRNAs in cancer. Nat Med. 2015;21:1253–1261. [DOI] [PubMed] [Google Scholar]
- [8].Prensner JR, Chinnaiyan AM. The emergence of lncRNAs in cancer biology. Cancer Discov. 2011;1:391–407. [DOI] [PMC free article] [PubMed] [Google Scholar]
- [9].Guerrieri F. Long non-coding RNAs era in liver cancer. World J Hepatol. 2015;7:1971–1973. [DOI] [PMC free article] [PubMed] [Google Scholar]
- [10].Chang L, Yuan Y, Li C, et al. Upregulation of SNHG6 regulates ZEB1 expression by competitively binding miR-101-3p and interacting with UPF1 in hepatocellular carcinoma. Cancer Lett. 2016;383:183–194. [DOI] [PubMed] [Google Scholar]
- [11].Kowalczyk MS, Higgs DR, Gingeras TR. Molecular biology: RNA discrimination. Nature. 2012;482:310–311. [DOI] [PubMed] [Google Scholar]
- [12].Hua S, Lei L, Deng L, et al. miR-139-5p inhibits aerobic glycolysis, cell proliferation, migration, and invasion in hepatocellular carcinoma via a reciprocal regulatory interaction with ETS1. Oncogene. 2018;37:1624–1636. [DOI] [PubMed] [Google Scholar]
- [13].Zhang L, Dong Y, Zhu N, et al. microRNA-139-5p exerts tumor suppressor function by targeting NOTCH1 in colorectal cancer. Mol Cancer. 2014;13:124. [DOI] [PMC free article] [PubMed] [Google Scholar]
- [14].Shen K, Liang Q, Xu K, et al. MiR-139 inhibits invasion and metastasis of colorectal cancer by targeting the type I insulin-like growth factor receptor. Biochem Pharmacol. 2012;84:320–330. [DOI] [PubMed] [Google Scholar]
- [15].Kamikawaji K, Seki N, Watanabe M, et al. Regulation of LOXL2 and SERPINH1 by antitumor microRNA-29a in lung cancer with idiopathic pulmonary fibrosis. J Hum Genet. 2016;61:985–993. [DOI] [PubMed] [Google Scholar]
- [16].Cao C, Zhang T, Zhang D, et al. The long non-coding RNA, SNHG6-003, functions as a competing endogenous RNA to promote the progression of hepatocellular carcinoma. Oncogene. 2017;36:1112–1122. [DOI] [PubMed] [Google Scholar]
- [17].Ito S, Nagata K. Biology of Hsp47 (Serpin H1), a collagen-specific molecular chaperone. Semin Cell Dev Biol. 2017;62:142–151. [DOI] [PubMed] [Google Scholar]
- [18].Kojima T, Miyaishi O, Saga S, et al. The retention of abnormal type I procollagen and correlated expression of HSP 47 in fibroblasts from a patient with lethal osteogenesis imperfecta. J Pathol. 1998;184:212–218. [DOI] [PubMed] [Google Scholar]
- [19].Naboulsi W, Megger DA, Bracht T, et al. Quantitative Tissue Proteomics Analysis Reveals Versican as Potential Biomarker for Early-Stage Hepatocellular Carcinoma. J Proteome Res. 2016;15:38–47. [DOI] [PubMed] [Google Scholar]
- [20].Zhu J, Xiong G, Fu H, et al. Chaperone Hsp47 Drives Malignant Growth and Invasion by Modulating an ECM Gene Network. Cancer Res. 2015;75:1580–1591. [DOI] [PMC free article] [PubMed] [Google Scholar]
- [21].Duarte BDP, Bonatto D. The heat shock protein 47 as a potential biomarker and a therapeutic agent in cancer research. J Cancer Res Clin Oncol. 2018;144:2319–2328. [DOI] [PMC free article] [PubMed] [Google Scholar]
- [22].Zhang X, Ma W, Cui J, et al. Regulation of p21 by TWIST2 contributes to its tumor-suppressor function in human acute myeloid leukemia. Oncogene. 2015;34:3000–3010. [DOI] [PubMed] [Google Scholar]
- [23].Chen S, Wu DD, Sang XB, et al. The lncRNA HULC functions as an oncogene by targeting ATG7 and ITGB1 in epithelial ovarian carcinoma. Cell Death Dis. 2017;8:e3118. [DOI] [PMC free article] [PubMed] [Google Scholar]
- [24].Keckesova Z, Donaher JL, De Cock J, et al. LACTB is a tumour suppressor that modulates lipid metabolism and cell state. Nature. 2017;543:681–686. [DOI] [PMC free article] [PubMed] [Google Scholar]
- [25].Liu F, Yuan JH, Huang JF, et al. Long noncoding RNA FTX inhibits hepatocellular carcinoma proliferation and metastasis by binding MCM2 and miR-374a. Oncogene. 2016;35:5422–5434. [DOI] [PubMed] [Google Scholar]
- [26].Liu XH, Sun M, Nie FQ, et al. Lnc RNA HOTAIR functions as a competing endogenous RNA to regulate HER2 expression by sponging miR-331-3p in gastric cancer. Mol Cancer. 2014;13:92. [DOI] [PMC free article] [PubMed] [Google Scholar]
- [27].Birgani MT, Hajjari M, Shahrisa A, et al. Long Non-Coding RNA SNHG6 as a Potential Biomarker for Hepatocellular Carcinoma. Pathol Oncol Res. 2018;24:329–337. [DOI] [PubMed] [Google Scholar]
- [28].Amenomori M, Mukae H, Sakamoto N, et al. HSP47 in lung fibroblasts is a predictor of survival in fibrotic nonspecific interstitial pneumonia. Respir Med. 2010;104:895–901. [DOI] [PubMed] [Google Scholar]
- [29].Hirai K, Kikuchi S, Kurita A, et al. Immunohistochemical distribution of heat shock protein 47 (HSP47) in scirrhous carcinoma of the stomach. Anticancer Res. 2006;26:71–78. [PubMed] [Google Scholar]
- [30].Tay FC, Lim JK, Zhu H, et al. Using artificial microRNA sponges to achieve microRNA loss-of-function in cancer cells. Adv Drug Deliv Rev. 2015;81:117–127. [DOI] [PubMed] [Google Scholar]
- [31].Wong CC, Wong CM, Tung EK, et al. The microRNA miR-139 suppresses metastasis and progression of hepatocellular carcinoma by down-regulating Rho-kinase 2. Gastroenterology. 2011;140:322–331. [DOI] [PubMed] [Google Scholar]
- [32].Liu X, Chen Z, Yu J, et al. MicroRNA profiling and head and neck cancer. Comp Funct Genomics. 2009. DOI: 10.1155/2009/837514. PMID: 19753298 [DOI] [PMC free article] [PubMed] [Google Scholar]
- [33].Wong TS, Liu XB, Wong BY, et al. Mature miR-184 as Potential Oncogenic microRNA of Squamous Cell Carcinoma of Tongue. Clin Cancer Res. 2008;14:2588–2592. [DOI] [PubMed] [Google Scholar]
Associated Data
This section collects any data citations, data availability statements, or supplementary materials included in this article.


