Abstract
Electron transfer reactions slow down when they become very thermodynamically favorable, a counterintuitive interplay of kinetics and thermodynamics termed the inverted region in Marcus theory. Here we report inverted region behavior for proton-coupled electron transfer (PCET). Photochemical studies of anthracene-phenol-pyridine triads give rate constants for PCET charge recombination that are slower for the more thermodynamically favorable reactions. Photoexcitation forms an anthracene excited state that undergoes PCET to create a charge-separated state. The rate constants for return charge recombination show an inverted dependence on the driving force upon changing pyridine substituents and the solvent. Calculations using vibronically nonadiabatic PCET theory yield rate constants for simultaneous tunneling of the electron and proton that account for the results.
Electron transfer (ET) and proton transfer (PT) are among the most fundamental and ubiquitous chemical reactions. An extensive range of chemical processes require intimate pairing of both electron and proton transfers (termed proton-coupled electron transfer, PCET) (1–4). PCET reactions are critical to energy conversion and storage processes in photosynthesis, respiration, combustion, fuel cells, and solar fuels, as well as many processes in catalysis, antioxidant reactivity, and chemical synthesis (1–7). PCET reactions where e– and H+ move in a single chemical step (termed concerted proton-electron transfer, CPET) are important because they can bypass high-energy intermediates formed in sequential ET and PT steps. Individual ET steps show a notable feature, predicted by Marcus theory, of an inverted region where ET rates become slower at driving forces (−∆G°) larger than the total reorganization energy (λ) (8–11). A similar inverted region for CPET should be important in natural and artificial energy conversion processes, especially those that harness solar energy, by slowing energy-wasting recombination reactions. However, there are very few reports of an inverted region for processes involving nuclear motion (12–14), as the effect is expected to be reduced by the participation of excited vibrational states (15). Here we report experimental evidence of the existence of inverted region behavior for CPET and a theoretical analysis accounting for it.
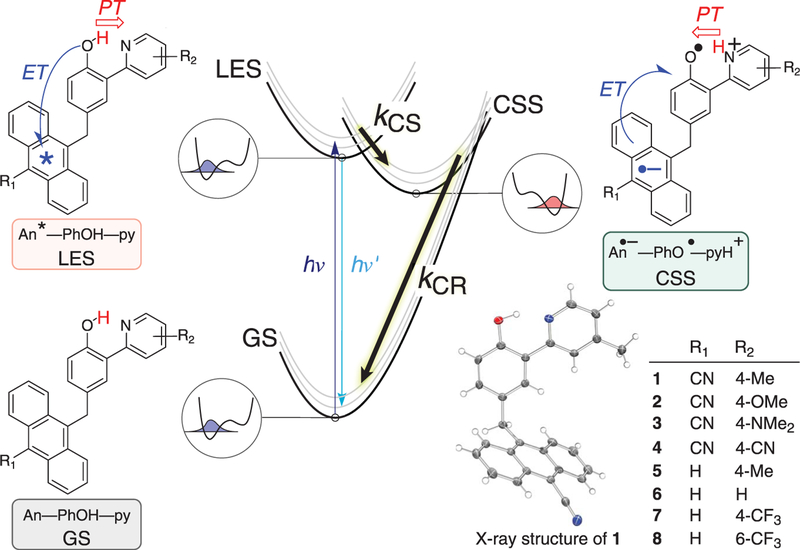
We investigate CPET reactions in a series of molecular triads containing an anthracene photo-oxidant, a phenol PCET reagent, and a pyridine base (1 to 8) (Fig. 1). As described for the unsubstituted compound 6 (16), the anthracene local excited state (LES) formed by photoexcitation is subsequently quenched by CPET from the phenol: ET to the excited anthracene concerted with PT to the pyridine. This yields a zwitterionic e–/H+ charge-separated state (CSS), with anthracene radical anion, phenoxyl radical, and pyridinium components. This CSS then returns to the ground state (GS) by charge recombination (CR) (Fig. 1). The CR reactions have extremely large driving forces and some of these, depending on their substituents, show inverted region behavior.
Fig. 1. Schematic of photochemical e–/H+ charge separation (CS) and charge recombination (CR) in anthracene-phenol-pyridine triads 1 to 8.
Photoexcitation of the ground state (GS) populates the local excited state (LES), which converts to the e–/H+ charge-separated state (CSS) and then back to the GS. Within the chemical structures of the LES and CSS, arrows indicate the direction of electron and proton transfers in LES→CSS (CS) and CSS→GS (CR) reactions. Circled diagrams show schematic proton potentials and lowest proton vibrational wave functions for O–H (blue) and N–H (red) bonds.
Compounds 1 to 8, with different anthracene and pyridine substituents (Fig. 1), were prepared via Suzuki coupling of anthracene-CH2-phenols with pyridines (17). These molecules have planar phenol-pyridine moieties with strong intramolecular hydrogen bonds, indicated by the low-field phenol resonance in their 1H nuclear magnetic resonance spectra (18) and by x-ray crystal structures of 1, 3, 5, and 6 (Fig. 1) (16, 17). The methylene spacer prevents intramolecular π-π stacking or co-planarity of the anthracene and the phenol-pyridine, keeping the two subunits close but electronically distinct.
The CPET reactions of 1 to 8 after selective photoexcitation of the anthracene unit were studied by femtosecond transient absorption (TA) spectroscopy. Spectral changes were monitored in the visible region after ultraviolet (UV) photoexcitation at 400 nm for 1 to 4 and 365 nm for 5 to 8 (compare absorption spectra in figs. S49 and S50). For 1 to 4, separate experiments monitored changes of the anthracenyl C≡N stretch in the mid-infrared (mid-IR) after photoexcitation at 410 nm. The anthracene-based LESs formed by UV photoexcitation show the expected and characteristic stimulated emission and excited state absorption signatures (see below and figs. S30 to S46). For previously reported 6, decay of the LES was shown to occur by CPET charge separation (CS), on the basis of hydrogen/deuterium (H/D) kinetic isotope effects (KIEs) and methyl substitution of the phenolic proton (16). The new compounds reported here show similar behavior with CS time constants of 1 to 22 ps, depending on the substituent and solvent (Fig. 2 and table S1).
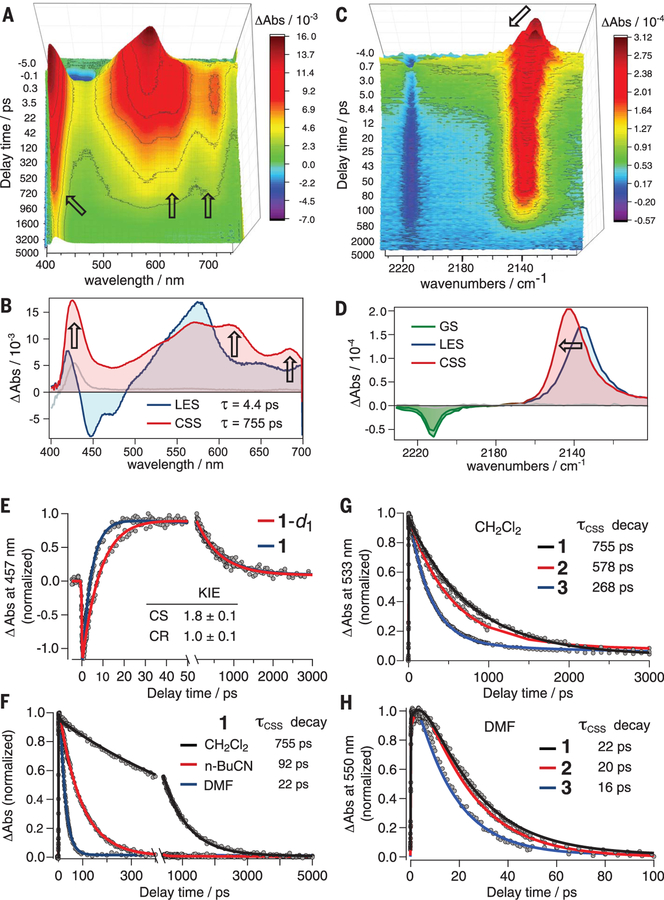
Fig. 2. TA and characterization of e–/H+ CSSs.
For 1 in CH2Cl2, global fitting of the time evolution of the visible (A) and mid-IR (C) TA spectra give the evolution-associated visible spectra (B) and mid-IR spectra (D) of the LES and CSS. In CH2Cl2 (but not in other solvents), there is a small contribution of a longer-lived transient. Arrows in (A) to (D) indicate spectral changes between the LES and CSS. In (E to H), time traces (circles) and fits from global analysis (lines) show the KIE for CS and CR of 1 in CH2Cl2 (E), the solvent polarity effect on CR time constants for 1 (F), and the relative CR time constants for 1 to 3 in CH2Cl2 (G) and DMF (H). For (F) to (H), the time traces are at wavelengths for isosbestic points for the LES and CSS spectra, so the traces only show the CSS→GS (CR) reaction in CH2Cl2 (at 533 nm) and n-BuCN and DMF (at 550 nm).
Compounds 1 to 3, which combine the most oxidizing cyanoanthracene and the most basic pyridines, yield a long-lived transient intermediate after CS (Fig. 2, A and C and figs. S30 to S39). In contrast, the LESs of 4 to 8 decay directly back to their GS without observation of the CSS (figs. S42 to S46). The intermediates from 1 to 3 were characterized as CSSs by their visible and mid-IR TA spectra. The visible spectra show a narrow absorption at 425 nm, assigned to a phenoxyl radical (19, 20), and a broad absorption between 475 and 700 nm. The mid-IR TA spectra of 1 to 3 initially show a GS bleach of ν(C≡N) at 2220 cm−1 and a LES absorption at 2130 cm−1, which then shifts (decays) to 2150 cm−1 (Fig. 2, C and D). The broad visible absorption and 2150 cm−1 ν(C≡N) band are assigned to the cyanoanthracenyl radical anion on the basis of TA and spectroelectrochemical studies of 9-cyano-10-methyl-anthracene (figs. S47 and S48). For each system, the time constants for changes in the visible and mid-IR spectra are the same within experimental uncertainty (except for CS for 1 in CH2Cl2) (table S1), indicating that the time constants and spectral changes reflect the formation of the same species independently assigned by UV/visible and UV/mid-IR TA. Replacement of the phenolic H with D gives KIEs for CS of 1.7 ± 0.2 for 1 to 3 in CH2Cl2 (Fig. 2E and table S2). These data identify the intermediates of 1 to 3 as the e–/H+ CSSs.
The CSSs for 1 to 3 decay directly to their GS (to zero in their TA spectra) by CR, without buildup of additional intermediates (Fig. 2, A to H, and figs. S30 to S39). In CH2Cl2, these decays occur over hundreds of picoseconds. The relative CR rate constant (kCR) values follow the trend: 1[4-Me] < 2[4-OMe] < 3[4-NMe2] (Fig. 2, G and H, and Table 1), with the pyridine substituents given in brackets because these are the only differences among 1 to 3. The kCR values show H/D KIEs of 1.0 ± 0.1 on H/D exchange of the phenol proton (Fig. 2E and table S2). Because the CSS→GS (CR) reactions involve PT from the pyridinium, the relative driving forces follow the acid dissociation constant (Ka) of their pyridiniums [as we have shown in a closely related system (21)]. In CH2Cl2, the pKa order [pKa = −log(Ka)] is MepyH+ (most acidic) > MeOpyH+ (∆pKa = 0.8)> Me2NpyH+ (least acidic, ∆pKa = 2.8) (22). Thus, 1, with the most acidic pyridinium, has the most favorable CR yet the slowest CR rate. The same pattern is seen in n-butyronitrile (n-BuCN) and dimethylformamide (DMF) solvents. More exoergic reactions consistently proceed more slowly. This is the hallmark of the inverted region.
Table 1. Time constants (τ), rate constants (k), and driving forces (−∆G°) for 1 to 3 CR.
τ and k (= 1/τ) from global fits of visible TA spectra. ∆Go CPET-CR from DFT and constrained DFT computations (17). Uncertainties for k and approximate uncertainties for ∆Go CPET-CR are shown in parentheses.
| Compound | Solvent | τ (ps) | k × 1010 (s−1) | ∆G° (eV) |
|---|---|---|---|---|
| 1 | CH2CI2 | 755 | 0.13(1) | −2.54(5) |
| n-BuCN | 92 | 1.1(1) | −2.48(5) | |
| DMF | 22 | 4.6(1) | −2.46(5) | |
| 2 | CH2CI2 | 578 | 0.17(2) | −2.53(5) |
| n-BuCN | 72 | 1.4(1) | −2.43(5) | |
| DMF | 20 | 5.0(1) | −2.41(5) | |
| 3 | CH2CI2 | 268 | 0.37(3) | −2.36(5) |
| DMF | 16 | 6.2(1) | −2.29(5) |
The relative CR rate constants for 1 to 3 indicate that the reaction occurs by CPET. Rate-limiting PT is inconsistent with the trend in kCR for 1 to 3 and is expected to be highly endoergic (17). Rate-limiting ET is unlikely because 1 to 3 only differ in their pyridine substituents, whose effects on a pure ET rate constant are expected to be too small to account for the observed factor of 2.8 in kCR for 1 and 3 (17). A similar factor in the kCS for 1 and 3 is observed for the forward CS (17), which supports the conclusion that differences in the PT component of the reaction must contribute to their differences in kCR. In addition, rate-limiting ET would require formation of the proton tautomer of the GS (An–PhO––XpyH+), but computations did not locate any minima on the potential energy surfaces corresponding to such species (17).
The CR rate constants for 1 to 3 vary strongly with solvent. Increasing the solvent polarity results in faster CR rate constants, with DMF > n-BuCN > CH2Cl2, spanning a factor of 34 (Fig. 2F). Higher solvent polarity makes the CR free energy less favorable (by stabilizing the zwitterionic CSS over the GS) and increases λ (23), both of which would make the reactions slower in the normal region (9, 10). For 1 to 3, however, the CR rates are faster in higher-polarity solvents. This is strong evidence that the CR reactions are in the inverted region.
More quantitative analysis of the CPET kinetics for CS and CR requires the respective driving forces −∆G°CS and −∆G°CR. The free energies of the LESs relative to the GSs were estimated spectroscopically, and the free energies of the CSSs relative to the GSs were estimated computationally using constrained density functional theory (DFT) to compute the free energies of the CSSs and standard DFT to compute the free energies of the GSs for 1 to 3 and using the Weller approximation for the other cases (17).
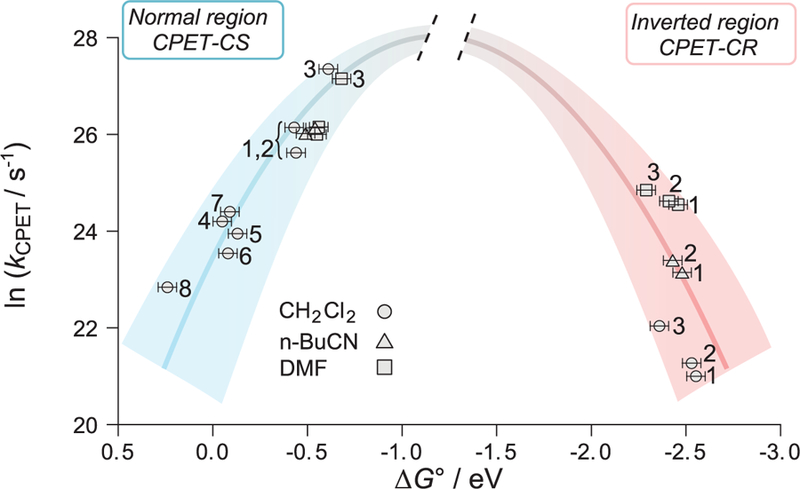
The calculated driving forces reproduce the expected trends resulting from changes in substitution and solvent polarity (17). The CS reactions are in the normal region, and kCS values roughly follow the expected quadratic dependence on ∆G°CS (Fig. 3). This dependence cannot be fitted with a single parabola because the kCS values were measured in different solvents, so there are different λ values, and because the very rapid kCS for 1 to 3 may involve LESs that are not vibrationally cooled. This range of cases is indicated by the broad blue bell-shaped parabola in Fig. 3. This plot shows that 4 to 8 have the lowest driving forces for CS, which implies very high free energies for the CSSs, which likely opens up alternative mechanisms for their decay (17).
Fig. 3. The free energy dependence of CPET rate constants showing the normal and inverted regions.

Plot of ln(kCPET) from TA versus computed ∆G° (17). Rising blue parabola: kCS (charge separation) in 1 to 8 versus ∆G°CS; falling red parabola: kCR (charge recombination) in 1 to 3 versus ∆G°CR. The uncertainties in kCPET are smaller than the data points. The uncertainties in ∆G° are estimated to be ±0.05 eV; the relative uncertainties for CPET-CR in 1 to 3 in the inverted region are smaller, as these differences arise solely from changes in the pyridine substituents.
The CR reactions of 1 to 3 are in the inverted region, as shown by the broad, descending red parabola in Fig. 3. In each of the three solvents studied, the rate constants are in the order 3 > 2 > 1, becoming slower at higher driving forces. The relative driving forces are established both from computations and from the known effects of pyridine substituents in phenol-pyridine PCET reagents (21). The red parabola is drawn with the same curvature as that for CS only as a heuristic, given that the CS and CR are different reactions and the data include different solvents. However, the small Stokes shift for anthracenes suggests that the LES and GS have similar solvation and therefore that the reorganization energy for LES→CSS is not very different than that for CSS→GS. For 1 to 3 in the same solvent, CR reactions are substantially slower than CS reactions despite their much higher exoergicity.
Previous work predicted that an inverted region for CPET should typically be inaccessible owing to the participation of proton vibrationally excited states (15). These states provide pathways for reactant-to-product nonadiabatic transitions with negligible free energy barriers, even at highly negative overall ∆G°CPET. Such pathways attenuate the inverted character, similar to the effect of participation of vibrationally excited states in pure ET (8, 24, 25). The relative kCR for 1 and 3 were analyzed by theoretical modeling to better understand the observation of CPET inverted region behavior, especially the involvement of proton vibrational excited states. The rate constants for the CR reactions of 1 and 3 were calculated using the expression for kCPET from vibronically nonadiabatic CPET theory (2, 26).
The expression for the nonadiabatic rate constant, kCPET, of PCET used in all calculations is as follows (26)
| (1) |
where R is the proton donor-acceptor (N and O, respectively) distance; the summations are over reactant and product vibronic states (i.e., proton vibrational states); Pμ is the Boltzmann population for reactant state π; ħ is Planck’s constant h divided by 2π; Vel is the electronic coupling; Sμν is the overlap integral between the proton vibrational wave functions of reactant state μ and product state ν; λ is the total reorganization energy; kB is the Boltzmann constant; is the reaction free energy for reactant and product states μ and ν, respectively; and T is the temperature. The rate constants are weighted by the probability of sampling a given proton donor-acceptor distance by thermal averaging
| (2) |
where P(R) is the probability distribution function of the proton donor-acceptor distance.
The reaction free energy ∆G° for the ground proton vibrational states, the reorganization energy λ, and the proton potentials were calculated using DFT methods (17). The inverted region was observed for the range of λ values computed with different methods, and the experimental ratio of kCR for 1 and 3 in CH2Cl2 (2.8) was reproduced with λ = 1.40 eV, assuming equal electronic couplings for 1 and 3. With λ = 1.40 eV, the KIEs were calculated to be approximately unity, in agreement with experiment. The computed CPET kCR and ∆G°CR corroborate the observation of a Marcus inverted region: kCR is slower for 1 over 3 by a factor of 2.8 even though its ∆G°CR is more favorable by 0.18 eV.
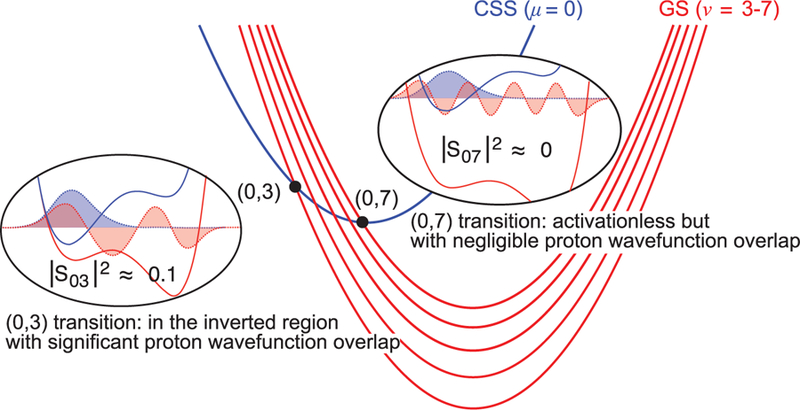
The dominant contributions to kCPET for 1 and 3 CR reactions arise from nonadiabatic transitions from the lowest proton vibrational state in the CSS reactant to vibrationally excited states in the GS product (Fig. 4) (17). The dominant contributions correspond to transitions with appreciable vibrational wave function overlap integrals (Fig. 4 and tables S24 to S27). These transitions are all in the inverted region (−∆G°0ν > λ), despite featuring smaller (attenuated) driving forces than the transition between the lowest reactant (CSS, μ = 0) and product (GS, ν = 0) states. The transitions that have negligible activation free energy barriers are prohibited by the near-zero overlap integrals because of phase cancellation arising from oscillations of the product vibrational wave function (e.g., S07 of 1) (Fig. 4). The participation of excited, and therefore delocalized, H/D wave functions also attenuates the difference in overlap integrals between isotopes, accounting for the observed near-unity KIEs (calculated 1.08 for 1) (17). Additionally, contributions from these and other excited vibrational states lead to a shallower free energy dependence of the CPET rate constant in the Marcus inverted region, as observed for ET (8).
Fig. 4. Illustration of the lowest CSS (blue) and multiple product GS (red) vibronic state free energy curves for the CPET-CR reaction.

Nonadiabatic transitions can occur at the intersection points between the reactant (μ) and product (ν) parabolas (black dots). Circled diagrams show proton potential energy curves for the reactant (blue) and product (red) and the corresponding proton vibrational wave functions for a state pair with significant overlap integral (S03) and a state pair with near-zero overlap integral (S07) at the dominant proton donor-acceptor distance for 1.
The inverted region for CPET is observed despite the attenuation of the driving force owing to participation of excited proton vibrational states because: (i) the state pairs with considerable proton vibrational wave function overlap integrals feature −∆G°0ν > λ, and (ii) the state pairs corresponding to virtually activationless transitions feature prohibitively small proton vibrational wave function overlap integrals. Both of these conditions are a function of the shape of the proton potentials (15, 17). Therefore, the theoretical modeling indicates that CPET reactions in the inverted region are strongly influenced by the shape of the proton potentials and the character of the corresponding proton vibrational wave functions.
The Marcus inverted region for pure ET has proven to be an important component of solar energy conversions and many other processes, slowing down recombination reactions after the formation of energy storing charge-separated states. The observation of an inverted region for PCET should enable new strategies to understand and control chemical reactions that involve protons and electrons, perhaps assisting the conversion of light energy into chemical fuels.
Supplementary Material
ACKNOWLEDGMENTS
We thank the MS & Proteomics Resource at Yale for the HRMS data.
Funding: Support was provided by the U.S. National Institutes of Health (R01GM050422 to J.M.M. and R37GM056207 to S.H.-S.) and by the Swedish Research Council (2016–04271 to L.H.).
Footnotes
Competing interests: The authors have no competing interests.
Data and materials availability: Excel files of TA visible and mid-IR data for 1 in CH2Cl2 are available as supplementary materials (data S1 and S2, respectively). Crystallographic data are available free of charge from the Cambridge Crystallographic Data Centre under reference numbers CCDC 1877696 (1), 1877697 (3), 1877698 (5), and 1877699 (12). Experimental procedures, additional data, and analysis are included in the supplementary materials.
REFERENCES AND NOTES
- 1.Weinberg DR et al. , Chem. Rev 112, 4016–4093 (2012). [DOI] [PubMed] [Google Scholar]
- 2.Hammes-Schiffer S, Stuchebrukhov AA, Chem. Rev 110, 6939–6960 (2010). [DOI] [PMC free article] [PubMed] [Google Scholar]
- 3.Warren JJ, Tronic TA, Mayer JM, Chem. Rev 110, 6961–7001 (2010). [DOI] [PMC free article] [PubMed] [Google Scholar]
- 4.Reece SY, Nocera DG, Annu. Rev. Biochem 78, 673–699 (2009). [DOI] [PMC free article] [PubMed] [Google Scholar]
- 5.Seh ZW et al. , Science 355, eaad4998 (2017).28082532 [Google Scholar]
- 6.Miller DC, Tarantino KT, Knowles RR, Top. Curr. Chem 374, 30 (2016). [DOI] [PMC free article] [PubMed] [Google Scholar]
- 7.Lennox JC, Kurtz DA, Huang T, Dempsey JL, ACS Energy Lett 2, 1246–1256 (2017). [Google Scholar]
- 8.Closs GL, Miller JR, Science 240, 440–447 (1988). [DOI] [PubMed] [Google Scholar]
- 9.Marcus RA, Angew. Chem. Int. Ed. Engl 32, 1111–1121 (1993). [Google Scholar]
- 10.Marcus RA, Sutin N, Biochim. Biophys. Acta 811, 265–322 (1985). [Google Scholar]
- 11.Barbara PF, Meyer TJ, Ratner MA, J. Phys. Chem 100, 13148–13168 (1996). [Google Scholar]
- 12.Peters KS, Acc. Chem. Res 42, 89–96 (2009). [DOI] [PubMed] [Google Scholar]
- 13.Blowers P, Masel RI, J. Phys. Chem. A 103, 7047–7054 (1999). [Google Scholar]
- 14.Andrieux CP, Gamby J, Hapiot P, Savéant J-M, J. Am. Chem. Soc 125, 10119–10124 (2003). [DOI] [PubMed] [Google Scholar]
- 15.Edwards SJ, Soudackov AV, Hammes-Schiffer S, J. Phys. Chem. B 113, 14545–14548 (2009). [DOI] [PMC free article] [PubMed] [Google Scholar]
- 16.Bowring MA et al. , J. Am. Chem. Soc 140, 7449–7452 (2018). [DOI] [PMC free article] [PubMed] [Google Scholar]
- 17.Materials, methods, and additional information are available as supplementary materials.
- 18.Rhile IJ et al. , J. Am. Chem. Soc 128, 6075–6088 (2006). [DOI] [PMC free article] [PubMed] [Google Scholar]
- 19.Gadosy TA, Shukla D, Johnston LJ, J. Phys. Chem. A 103, 8834–8839 (1999). [Google Scholar]
- 20.Glover SD et al. , J. Am. Chem. Soc 136, 14039–14051 (2014). [DOI] [PMC free article] [PubMed] [Google Scholar]
- 21.Markle TF, Tronic TA, DiPasquale AG, Kaminsky W, Mayer JM, J. Phys. Chem. A 116, 12249–12259 (2012). [DOI] [PMC free article] [PubMed] [Google Scholar]
- 22.Morris WD, Mayer JM, J. Am. Chem. Soc 139, 10312–10319 (2017). [DOI] [PMC free article] [PubMed] [Google Scholar]
- 23.Asahi T et al. , J. Am. Chem. Soc 115, 5665–5674 (1993). [Google Scholar]
- 24.Barbara PF, Walker GC, Smith TP, Science 256, 975–981 (1992). [DOI] [PubMed] [Google Scholar]
- 25.Ulstrup J, Jortner J, J. Chem. Phys 63, 4358–4368 (1975). [Google Scholar]
- 26.Soudackov A, Hammes-Schiffer S, J. Chem. Phys 113, 2385–2396 (2000). [Google Scholar]
Associated Data
This section collects any data citations, data availability statements, or supplementary materials included in this article.


