

Abstract
Here we used a systems vaccinology approach to identify temporal changes in immune response signatures to the yellow fever 17D vaccine, with the aim of comprehensively characterizing immune responses associated with protective immunity. We conducted a cohort study in which 21 healthy subjects in China were administered one dose of the YF-17D vaccine; peripheral blood mononuclear cells were collected at 0 h and then at 4 h and Days 1, 2, 3, 5, 7, 14, 28, 84 and 168 post-vaccination and analyzed by transcriptional profiling and immunological assays.
At 4 h post-vaccination, genes associated with innate cell differentiation and cytokine pathways were dramatically downregulated, whereas receptor genes were upregulated, compared with their baseline levels at 0 h. Immune response pathways were primarily upregulated on Days 5 and 7, accompanied by the upregulation of the transcriptional factors JUP, STAT1, and EIF2AK2. We also observed robust activation of innate immunity within 2 days post-vaccination and a durable adaptive response, as assessed by transcriptional profiling. Co-expression network analysis indicated that lysosome activity and lymphocyte proliferation were associated with dendritic cell and CD4+ T cell responses; FGL2, NFAM1, CCR1, and TNFSF13B were involved in these associations. Moreover, individuals who were baseline-seropositive for antibodies against another flavivirus exhibited significantly impaired dendritic cell, natural killer cell, and T cell function in response to YF-17D vaccination. Overall, our findings indicate that YF-17D vaccination induces a prompt innate immune response and dendritic cell activation, a robust antigen-specific T cell response, and a persistent B cell/memory B cell response.
Keywords: Yellow Fever Vaccine, Systems Vaccinology, Bioinformatics, Immunogenicity, Innate Immunity, Adaptive Immunity
Introduction
Prophylactic vaccines are believed to be the most cost effective public health intervention for preventing morbidity and mortality due to infectious diseases. Great advances in the development of efficacious vaccines have been made in the past century; most of these vaccines have typically been developed through “trial and error”, i.e. empirical approaches. However, a number of globally important pathogens have proven refractory to this approach to vaccine development (e.g. HIV, influenza) (1–3). Moreover, little is understood about the mechanisms by which effective vaccines stimulate protective immune responses, and these mechanisms likely differ from pathogen to pathogen. The innate immune system is believed to interact directly with the adaptive immune system, thereby enabling the induction of long-lived protective immune responses (4). A comprehensive understanding of the molecular mechanisms underlying optimal innate responses would therefore facilitate the design of efficacious vaccines. About a decade ago, it was proposed that a new paradigm consisting of rational vaccine development is necessary for developing efficacious vaccines against globally important infectious diseases that have hitherto been refractory to vaccine development (5–7). This approach, known as systems vaccinology, entails obtaining a systems-level understanding of the complex networks of genetics changes and vaccine-induced immune responses that confer protection (5, 8, 9).
Systems vaccinology approaches have been applied to understand the mechanisms of vaccine-induced protection against and/or the vaccine-induced immune response to various pathogens, including HIV (10–12), seasonal influenza (13), Neisseria meningitides (14), dengue virus (15), and yellow fever virus (16, 17). The yellow fever virus (YFV) 17D vaccine is one of the most efficacious vaccines ever developed (18, 19) and has been administered to over 600 million people globally in the past 75 years (20). A single injection of YF-17D induces broad innate (21) and adaptive immune responses that can persist for decades after vaccination (22); moreover, the neutralizing antibody response can last up to 30 years (19). Two seminal studies (16, 17) produced a detailed profile of the kinetics of immunological and transcriptional responses in peripheral blood and identified gene signatures that are predictive of immune responses following administration of the YFV-17D vaccine. The first study by Gaucher et al. (17) integrated genomics and flow cytometry approaches to study YFV-induced immune responses. The findings by Gaucher and colleagues highlighted an early role for innate immune factors (e.g. complement, inflammasomes, and interferon), followed by early induction of a T cell response and a broad B cell response coordinated by master transcription factors. The predominant changes in gene expression were observed at Days 3 and 7 postvaccination. The following year, Querec et al. (16) used a computational approach to identify and validate a genetic signature that predicted the magnitude of YFV-induced CD8+ T cell responses with up to 90% accuracy. Moreover, Querec and colleagues identified and validated a B cell signature that predicted the magnitude of the neutralizing antibody response with up to 100% accuracy (16).
To expand and build upon the results of these previous YFV systems vaccinology studies, both of which used Western cohorts, we performed a cohort study where volunteers in China received a single dose of the YF-17D vaccine. We harvested peripheral blood mononuclear cells (PBMCs) at baseline (pre-vaccination) and then again at 4 h and Days 1, 2, 3, 5, 7, 14, 28, 84 and 168 postvaccination and performed microarray analysis, flow cytometry immunophenotyping, and T cell functional assays. The inclusion of the 4 h postvaccination time-point, which was not included in the previous YFV systems vaccinology studies, was based on the findings of (16, 17) and our preliminary data indicating that vaccine-induced early immune responses, i.e. within days or even hours postvaccination, are critical for the understanding of protective immunity. We then performed computational analyses to understand the kinetics of vaccine-induced immune activation, identify the dynamics of enriched modules over time, and determine whether and how transcriptomic profiles correlate with immune responses. We also compared our data to the findings of previous studies (16, 17) to understand possible cohort-related differences. The goal of this comprehensive analysis was to further characterize the YFV-induced immune response and to better understand the molecular mechanisms underlying vaccine-induced protection.
Methods
Study cohort
The ethics committee of the Chinese CDC approved this cohort research for National Center for AIDS/STD Control and Prevention (NCAIDS) (Project NO. X111012237). In accordance with applicable disease control policy, all citizens planning to travel to areas where yellow fever virus is endemic are required to be vaccinated with the YF-17D vaccine prior to embarkation. Potential volunteers were excluded from participating in the study if they were pregnant, had been vaccinated previously with YF-17D, or the neutralizing antibody titer against YFV was higher than 1:10 before enrollment. After application of these criteria, 21 healthy volunteers aged 25 to 42 years were recruited at the Beijing CDC from 2011 to 2012. All enrolled volunteers signed a written informed consent form. Each subject received a single subcutaneous injection (0.5 ml) of the YF-17D live-attenuated yellow fever virus vaccine (Beijing Tiantan Biological Products Corporation Limited).
Sample collection
Blood was drawn from each volunteer into EDTA-2K Vacutainer tubes (BD Biosciences, MA, USA) on the day of vaccination (Day 0, prevaccination and 4 h postvaccination) and on Days 1, 2, 3, 5, 7, 14, 28, 84, and 168 after vaccination. PBMCs were isolated from these blood samples using standard Ficoll-Paque Plus (GE Healthcare, UK) density gradient centrifugation and frozen in dimethyl sulfoxide with 10% fetal bovine serum in liquid nitrogen.
Plaque assay for quantitation of yellow fever virus-neutralizing antibodies
Plasma samples were heated to 56° for 30 min to inactivate complement. Anti-YFV neutralizing antibodies were measured by the plaque reduction neutralization test (PRNT). In brief, serial dilutions of sera (2-fold dilutions from 1:100 to 1:1600) were incubated for 1 h at 37° with 100 PFUs (plaque-forming units) of YFV. Next, Vero cell monolayers in six-well plates were incubated with this virus-serum mixture for 1 h at 37°. The wells were then overlaid with 1% methylcellulose (Sigma-Aldrich, St. Louis, USA) in M199 medium to restrict virus diffusion and incubated for 7 days. On day 7, plaques were counted using crystal violet staining.
Immunofluorescence assay to detect anti-Japanese encephalitis virus and anti-West Nile virus antibodies
To determine the presence of anti-Japanese encephalitis virus (JEV) and anti-West Nile virus (WNV) antibodies in the serum samples, fluorescence microscopy was employed. Briefly, BHK-21 cells were infected with JEV (P-3 strain) and WNV. After a 5-day incubation, cells from cultures that exhibited 75% cytopathic effect were harvested by trypsin digestion and collected by centrifugation at 1,000 rpm for 10 min. The infected cells were then washed three times with 0.01 M PBS. Following resuspension in PBS, aliquots of the cell suspension were dropped onto multi-well slides, dried at room temperature, and fixed in acetone for 15 min at 4° C. Serial dilutions of the serum samples were then incubated with virus-infected cells for 2 h to allow binding of flavivirus-reactive antibodies, after which they were incubated with fluorescent-labeled antibodies to allow signal detection. Serological cross-reactions with JEV and WNV from all test samples were identified using a fluorescence microscope.
Flow cytometry
For all phenotype panels, one million cells were surface-stained with the antibody cocktails shown in Table 1. Staining was performed at 4°C in dark for 30 min, Live/Dead staining reagents (Life Technologies, Carlsbad, CA, USA) were also included to assess cell viability. For staining of intracellular proteins, cells were fixed and permeabilized with Fix/Perm (eBioscience, USA) for 30 min at 4°C in the dark.
Table 1.
Antibodies included in the FACS panels
| Antibody | Catalogue # | Company |
|---|---|---|
| NK phenotype | ||
| CD3-FITC | 555339 | BD |
| NKG2C-PERCP | FAB138C | RD |
| NKG2A-PE | FAB1059P | RD |
| CD20-ECD | IM3607U | Beckman |
| CD56-PECY7 | 335791 | BD |
| NKP46-APC | 558051 | BD |
| CD14-Ax700 | 557923 | BD |
| CD16-APCH7 | 560195 | BD |
| B cell phenotype | ||
| IgD-FITC | 555778 | BD |
| CD38-PERCP | 551400 | BD |
| CD20-ECD | IM3607U | Beckman |
| CD27-APCCY7 | 560222 | BD |
| IgM-APC | 551062 | BD |
| CD3-Ax700 | 557943 | BD |
| CD19-PECy7 | 557835 | BD |
| NK function | ||
| TNFα-FITC | 554512 | BD |
| CD3-PERCP | 347344 | BD |
| CD14-PE | 555398 | BD |
| CD19-ECD | A07770 | Beckman |
| CD56-PECY7 | 335791 | BD |
| CD107a-APC | 560664 | BD |
| IFNγ-Ax700 | 557995 | BD |
| CD16-APCH7 | 560195 | BD |
| T cell function | ||
| CD154-FITC | 555699 | BD |
| CD8-PERCP | 347314 | BD |
| IL2-PE | 559334 | BD |
| CD3-ECD | IM2705U | Beckman |
| CD4-PECY7 | 557852 | BD |
| TNFα-APC | 340534 | BD |
| IFNγ-Ax700 | 557995 | BD |
| CD14-APCH7 | 557831 | BD |
| Monocytes and DC phenotype | ||
| CD123-FITC | 558663 | BD |
| CD19-PE | 555413 | BD |
| CD3-ECD | IM2705U | Beckman |
| CD11c-PECY5 | 551077 | BD |
| CD56-PECY7 | 335791 | BD |
| HLADR-APC | 559866 | BD |
| CD14-A700 | 557923 | BD |
| CD16-APCH7 | 560195 | BD |
In the NK-mediated ADCC assay, target cells are coated with anti-P815 antibodies to serve as the Fc target cells for NK-mediated ADCC (23). The cells are then co-cultured with PBMCs as effector cells and NK function is assessed. Briefly, 0.2 million P815 (mouse leukemic cell line) cells (maintained in our laboratory) or K562 cells (human chronic myelogenous leukemia cells, maintained in our laboratory were cultured with P815-specific antibodies (Accurate Chemical & Scientific) for 1 h at 37°C in 5% CO2. The antibody-coated P815 or K562 cells were washed twice with ice-cold RPMI medium containing 10% FBS (R10) and used as target cells. The target cells were co-cultured with 1 million PBMCs (effector cells) and then incubated with anti-CD107a antibodies and Golgi-Stop (BD Biosciences, Bedford, MA, USA) for 5 h at 37°C in 5% CO2. Following culture, samples were processed according to standard protocols and stained intracellularly with Alexa Fluor 700-conjugated anti-IFN-γ and FITC-conjugated anti-TNF-α antibodies.
For analysis of T cell function, 1 million PBMCs were stimulated with Env peptide pools, nonstructural protein (NS1) peptide pools (a kind gift from Dr. Rafick Sekaly) (17), phorbol myristate acetate, or ionomycin, respectively. Brefeldin A was added to each well, after which all samples were incubated for 6 h at 37°C in 5% CO2. Cells were permeabilized and stained intracellularly using PE-conjugated anti-IL2, Alexa Fluor 700-conjugated anti-IFNγ, and APC-conjugated anti-TNFα antibodies. Events were acquired on a BD LSRFortessa instrument (BD Biosciences, Bedford, MA, USA) and analyzed using FlowJo software (TreeStar, Ashland, OR, USA). Gating strategies for each subset are shown in Supplemental Figure 1.
RNA preparation and microarray hybridization
After PMBC isolation, 1 × 10⁶ PBMCs were immediately lysed in 1 ml of TRIzol (Life Technologies, Carlsbad, CA, USA) and stored at −80°. The samples were thawed and RNA extracted following the manufacturer’s instructions. The quality of the RNA was assessed using a Nanodrop 2000 Spectrometer (Thermo Scientific, MA, USA) as well as by visualization of the integrity of the 28S and 18S bands on an Agilent Bioanalyzer 2100 instrument (Agilent Technologies, Santa Clara, CA, USA).
Qualified total RNA was further purified using an RNeasy micro kit (QIAGEN, GmBH, Germany). Contaminating genomic DNA was removed using an RNase-Free DNase Set (QIAGEN, GmBH, Germany). The purified RNA was stored at −80° C.
To obtain biotin-labeled cRNA, total RNA was amplified, labeled, and purified using the GeneChip 3’IVT Express Kit (Affymetrix, Santa Clara, CA, USA) following the manufacturer’s instructions. After hybridization on Human PrimeView Arrays for 16 h at 45°C and rotation at 60 rpm in a Hybridization Oven 640 (Affymetrix), slides were washed and stained with a Fluidics Station 450 system (Affymetrix). Scanning was performed on a seventh-generation GeneChip Scanner 3000 (Affymetrix). Affymetrix GCOS software was used to perform image analysis and generate raw intensity data.
Microarray analyses
All microarray data analysis was performed in R (version 3.3.0) (http://www.r-project.org/). Initially, data quality was assessed by determining the background level, 3’ labeling bias, RNA quality, and pair-wise correlation among samples. For the PrimeView chip, the customized CDF file (version 17, ENTREZG) downloaded from the BrainArray website was performed in probe set mapping (24, 25). Inter-quartile range (IQR) was applied for raw data filtering using the genefilter package, and the threshold was set to remove probes/genes with an IQR less than the 20th percentile of the IQRs across all probes/genes. Normalization was performed with the RMA algorithm, which includes global background adjustment and quantile normalization. The sample probe intensities were log2 transformed in all subsequent analyses. The limma package (26) was used to identify DEGs at any time-point postvaccination, compared with the baseline (prevaccination, Day 0) expression level. Empirical Bayes moderation of the standard error and the Benjamini and Hochberg (BH) false-discovery rate (FDR) correction for multiple testing were employed. DEGs were defined as having a fold change more than 1.5 and a BH adjusted q-value less than 0.01. These data have been deposited in NCBI’s Gene Expression Omnibus and are accessible through GEO Series accession number GSE82152 (https://www.ncbi.nlm.nih.gov/geo/query/acc.cgi?token=kfuvkkcgtlydfgr&acc=GSE82152). To gain insight into the protein-protein interactions of the DEGs, the genes with the highest betweenness centrality and degree were identified using the HPRD (Release 9) (27) database.
Gene ontology and pathway enrichment analysis
GO analysis was performed using the Cytoscape (http://www.cytoscape.org/) plug-in BiNGO (v2.44)(28). The Cytoscape (v 3.1.1) plugins Enrichment Map (v 2.0) (29) and Word Cloud (v 2.0.1) were used to compare and visualize the GO networks when appropriate. The cutoff for the Jaccard coefficient was set to 0.5 and the FDR q value was set to 0.1.
The Cytoscape plug-ins ClueGO (v2.1.1) and CluePedia (v1.1.1) (30, 31) were used for pathway enrichment analysis, i.e. to identify pathways that were significantly overrepresented or underrepresented at each time-point compared to their representation at baseline (prevaccination). Alternatively, Ingenuity Pathway Analysis (Ingenuity Systems) software (QIAGEN, GmBH, Germany) was used to identify canonical biological pathways likely to be activated or repressed at each time-point relative to their activity at baseline (prevaccination). This program integrates knowledge of differentially expressed genes with the biological interactions and functional annotations entered in the Ingenuity Knowledge Base (32). Only enriched pathways with –log10 (P value) ≥ 2 and involving more than two molecules are reported.
Blood transcription module (BTM) analysis
In addition to the above enrichment analyses of canonical pathways, we also performed BTM analysis (14). Briefly, all DEGs described above were matched to the BTM gene list published in (14) to generate a combination data set including expression fold change at each time point, gene symbol, and BTM gene set. All BTM gene sets containing more than 3 matched genes were chosen and are presented in radar plots generated using the “fmsb” package (33) in R (version 3.3.0).
Co-expression gene module network analysis
To identify co-regulated genes associated with the different immune responses, the weighted gene co-expression network analysis (WGCNA) R package (34) was used. Briefly, to construct the signed network, a gene list was selected using a fold change threshold of > 1.2 and a BH-corrected p-value < 0.05. A total of 4,331 genes were selected and used for estimation of the co-expression network and modules. To this end, the blockwiseModule function was used with the following optimized parameters (corType = pearson; power = 14; networkType = signed; deepSplit = 2; minModuleSize = 100; mergeCutHeight = 0.15). Associations of individual genes with the trait of interest (CD4+IL2/Env, CD11c+, CD123+, CD8+CD28+, CD19+CD20+, and CD19+CD20+/IgD-IgM+/CD27+) were quantified by determining the Gene Significance (GS), defined as the absolute value of the correlation between the gene and the trait. The list of link identifiers (corresponding to the genes inside a given module) can be executed via the pathway analysis. Using the weighted calculations in Cytoscape, hub genes in selected modules of interest could be identified.
Statistical analysis of immune responses
Data obtained from immunological responses were illustrated using ggplot2 in R or Prism 6.0 (GraphPad Software, La Jolla, CA, USA). Bar graphs plot mean values with standard deviation. One-way analysis of variance (ANOVA) with Dunnett’s multiple comparison procedure was used to compare immune responses at multiple time-points postvaccination vs. their baseline values. The Mann-Whitney test was used to compare immune responses between flavivirus positive and negative participants. The Wilcoxon matched-pairs signed rank t-test was used to compare the neutralization antibody data. Statistical significance was declared when the resulting p-value was less than 0.05.
Results
Vaccination with YF-17D induces rapid transcriptional alterations
This study enrolled 21 healthy, YFV seronegative volunteers (11 males and 10 females; mean age 29 years old) in China. After receiving a single dose of the yellow fever YF-17D vaccine (Beijing Tiantan Biological Products Co., Ltd) at the Beijing Center for Disease Control and Prevention (CDC), blood samples were collected prevaccination (0 h) and then again at 4 h postvaccination and Days 1, 2, 3, 5, 7, 14, 28, 84 and 168 postvaccination. PBMCs were isolated and their transcriptomes were analyzed using Affymetrix arrays.
YF-17D vaccination induced broad transcriptional changes, as evidenced by the finding that 1001 significantly differentially expressed genes (DEGs) were modulated at least one time-point postvaccination as compared to their prevaccination levels (Supplemental Table 1). We next compared the numbers of DEGs at different time-points to understand the kinetics of YF-17D vaccination-induced transcriptional changes (Figure 1A). At the earliest time-point postvaccination (4 h), 146 genes were identified as significantly up (36 genes) or down (110 genes) regulated. In contrast, many more DEGs were observed at 24 h postvaccination (327 up and 302 down). Comparing the DEGs observed at 4 h vs 24 h revealed that almost 20% (6/36) of the DEGs upregulated at 4 h were unique to this time-point (i.e. were no longer upregulated by 24 h) including genes NSUN5P2, ZNF441, HHEX, NUP43, KIAA0907, and 100506748_at. Moreover, 5 of the 110 genes downregulated at 4 h were unique to this time-point (i.e. were no longer downregulated by 24 h) including genes PRDM1, TNFRSF21, FLT3, SERPINF1, and SPON2. Thus, the PBMC transcriptome responded to vaccination very rapidly (within hours after vaccination), and some in a transient manner. The number of DEGs changes peaked at Days 2 and 5, and then returned to baseline levels at Day 28 (Figure 1A).
Figure 1. Kinetics of the peripheral blood mononuclear cell transcriptomic response to the YF-17D vaccine.
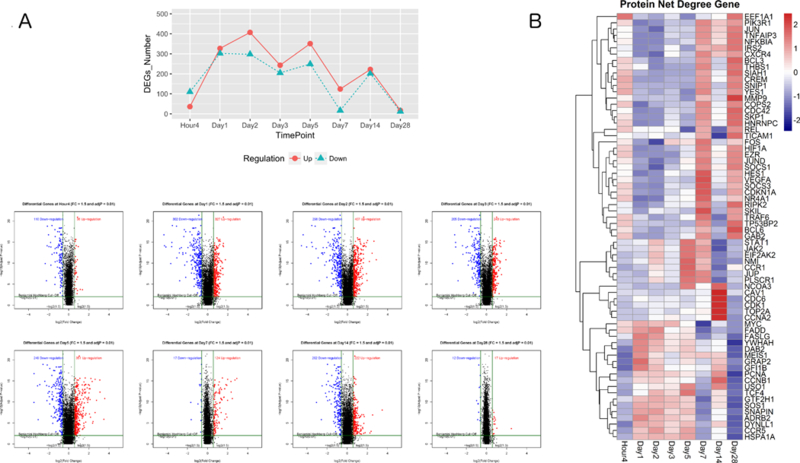
(A) Upper panel: Number of differentially expressed genes (DEGs) (threshold fold change > 1.5 and Benjamini-Hochberg adjusted false discovery rate < 0.01) in peripheral blood mononuclear cells at Hour 4, Day 1, Day 2, Day 3, Day 5, Day 7, Day 14, and Day 28 post YF-17D vaccination compared with their baseline (prevaccination) levels as calculated by the empirical Bayes test. Red and blue lines indicate upregulated and downregulated DEGs, respectively. Lower panel: Volcano plots of DEGs at each time-point postvaccination. Red dots indicate upregulated DEGs and blue dots indicate downregulated DEGs. The numbers in the plots indicate the number of DEGs at each time point. The horizontal and vertical dark green lines indicate the thresholds of log2 fold change and –log10 (adjusted p value), respectively. (B) Expression heat map of protein-protein interaction hub genes, identified by the Human Protein Reference Database, at each time-point by log2 (fold change). Blue and red represent downregulation and upregulation, respectively.
To assess the DEG connectivity, gene networks were constructed based on the Human Protein Reference Database (HPRD) protein-protein interaction (PPI) database (27). Two measures of protein interaction were assessed, “betweenness centrality” and “degree.” A node (i.e. protein) in the network through which many short paths (i.e. interactions) pass, akin to a bottleneck in the network, is a node with a high degree of betweenness centrality. Proteins with high measures of betweenness centrality are important because they are key connector proteins that tend to be essential (35). The degree corresponds to the number of edges (i.e. interactions) per node, i.e. the connectivity of the protein. Proteins with a high degree, often referred to as hub proteins, undertake many interactions and tend to be important in organization of network interaction pathways (36). Twenty of the 1001 DEGs were ranked in the top 5% of genes with the highest betweenness centrality and degree, as defined by the HPRD. The magnitude of changes in expression of the hub genes are presented via color coding in Figure 1B. Examination of the overall trends of hub gene expression revealed that the changes at 4 h were distinct from those at Days 1, 2, 3, and 5. Moreover, striking changes in hub gene expression occurred from Day 7 to 14 and from Day 14 to Day 28 (Figure 1B). Among the hub genes were critical transcriptional factors (e.g. JUP, EIF2AK2, STAT1, JUN, FOS, and NFKBIA) and cell cycle proteins (e.g. CCNB1, CDK1, and CDKN1A) (Figure 1B). Of these, JUP, STAT1, and EIF2AK2 reached their peak expression levels on Days 5 and 7, and mitosis-related (e.g. CCNA2, CCNB1, and TOP2A) and cell cycle-related (e.g. CDK1 and CDC6) genes were upregulated at Day 14 after vaccination. Moreover, at Day 28, transcription factors (e.g. EEF1A1, JUN, NFKBIA, REL, FOS, JUND, and TP53), cell cycle regulators (CDC42 and CDKN1A), chemokine and cytokines (CXCR4, TNFAIP3, TRAF6), and cell matrix (MMP9, THBS1) genes were upregulated. As shown in Supplemental Figure 2, JUN was the most important hub (i.e. the most highly connected) in the PPI network constructed from all 1001 DEGs. These results indicate that administration of the YFV-17D vaccine induces persistent gene-level immune response activation during the first month after vaccination, and that the diverse gene response patterns vary with time.
Pathway diversity and kinetics
To gain insight into the pathways that were activated and inhibited at each time-point postvaccination, we used Ingenuity Pathway Analysis (Ingenuity Systems) software to identify significantly activated and significantly inhibited pathways at each time-point (Figure 2). In contrast to the variations in hub gene expression over time (Figure 1B), pathways generally tended to stay activated or inhibited at all postvaccination time-points, with most of the changes observable by the earliest time-point (4 h) (Figure 2). The top inhibited pathways, defined by drastic gene downregulation sustained over two weeks postvaccination, included the pattern recognition receptor (PRR), TNF receptor-mediated, TREM-1, and IL-6/IL-1 pathways. Meanwhile, the peroxisome proliferator-activated receptor (PPAR)-mediated pathway, which plays essential roles in the regulation of cellular differentiation, development, and metabolism (carbohydrate, lipid, protein) (37, 38), and the LXR/RXR activation pathway were activated to their maximum extent at 4 h; this activation persisted over the entire time course.
Figure 2. Ingenuity Pathway Analysis (IPA) of biological pathways significantly activated or inhibited in peripheral blood mononuclear cells at different time-points post YF-17D vaccination.
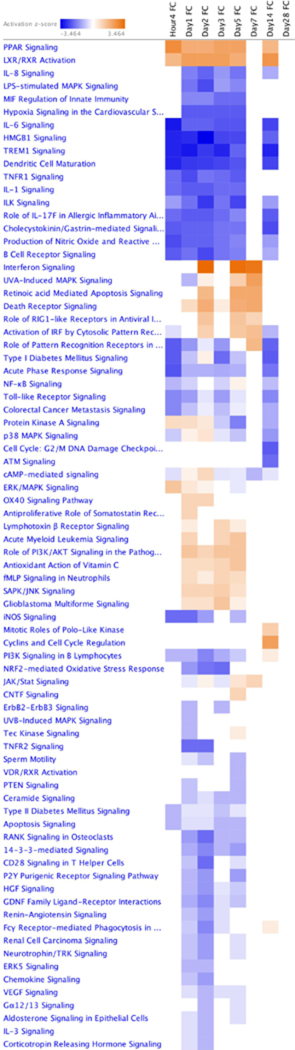
Transcriptomic data from peripheral blood mononuclear cells harvested at baseline (prevaccination), Hour 4, Day 1, Day 2, Day 3, Day 5, Day 7, Day 14, and Day 28 post YF-17D vaccination were analyzed using IPA software to identify canonical biological pathways that were significantly activated or inhibited in PBMCs in response to YF-17D vaccination compared to their baseline (prevaccination) status. Blue and red signify pathway inhibition and activation, respectively.
Consistent with data showing that flaviviruses are detected by innate immune sensing pathways (39), YF-17D vaccination stimulated antiviral sensors (e.g. PRRs, RIG-1). These sensors mediate pathogen recognition and activate the innate immune system. Specifically, cytosolic pattern recognition receptors, RIG-1 like receptors, and PI3K/AKT signaling pathways were activated from Day 1 to Day 7 (Figure 2); these sensors lead to downstream activation of interferon-regulatory factor (IRF) transcription factors and subsequent induction of antiviral cascades (40).
As expected by its critical antiviral role, the most highly activated pathway after YF-17D vaccination was the interferon signaling pathway (Figure 2). Consistent with the expression of individual genes involved in interferon signaling (Figure 1), this pathway was highly activated on Days 2, 5, and 7. By Day 14, the activation of the interferon pathway trended to the baseline level and cell cycle-related pathways were instead activated or inhibited, suggesting that by this point the immune system had recovered from the perturbation. The p38/ERK MAPK pathway was transiently inhibited at 4 h postvaccination and then activated through Days 1 and 2 postvaccination, after which it was again inhibited. In contrast, Protein Kinase A signaling pathways exhibited sustained activation from 4 h through to Day 2, after which they were similarly inhibited.
Due to the importance of innate immunity in response to the YF-17D vaccine, we next performed Blood Transcription Module (BTM) analysis (14), which specializes in interpreting transcriptional responses for innate immunity. This analysis reflected similar patterns to those observed at the gene level. For example, the module responses peaked at Day 5 (15 upregulated modules), waned by Day 7 (6 upregulated modules), and returned to the baseline level by Day 28 (Figure 3). Modules induced by YF-17D vaccination were associated with the innate immune response (e.g. antiviral type I interferon signature, activated dendritic cells, RIG-1 like receptor signaling, chemokines, complement activation, IRF2-targeting network, and FOSL) at Days 2, 5 and 7. Concomitantly, the cell division/cycle progression relative critical regulator PLK1 signaling and B cell related modules (e.g. memory B cell surface signature, plasma cell and immunoglobulin) were enriched at Day 14, indicating enhanced humoral immunological responses. These observations were consistent with the IPA analysis, but revealed a more extensive role for the innate immune responses.
Figure 3. Blood Transcription Module (BTM) analysis of functional gene modules significantly differentially expressed in peripheral blood mononuclear cells in response to YF-17D vaccination.
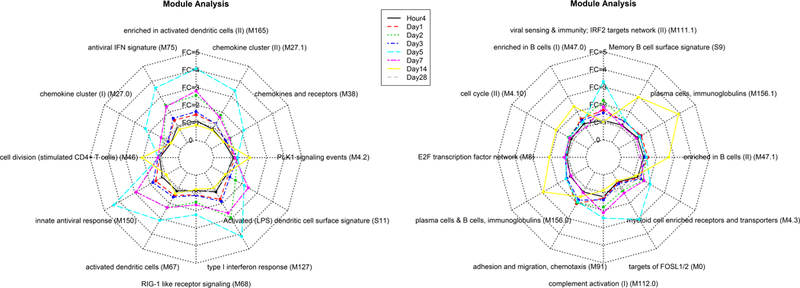
Innate immune responses in transcriptomic data from peripheral blood mononuclear cells harvested at baseline (prevaccination), Hour 4, Day 1, Day 2, Day 3, Day 5, Day 7, Day 14, and Day 28 post YF-17D vaccination were identified by BTM analysis. Each line represents the average fold change relative to baseline for all genes in the module at a given time-point. Upregulated modules have an average fold change more than 1; downregulated modules have an average fold change less than 1.
Vaccination with YF-17D induces innate immune mediators and kinetics
We next stained PBMCs obtained prevaccination and at Day 7, Day 14, Day 28, and Day 86 postvaccination with 5 antibody panels aimed at detecting the following: monocytes and dendritic cell (DC) phenotype, natural killer (NK) phenotype, B cell phenotype, NK function and T cell function (Table 1). Regarding innate immune cells, compared to baseline levels at 0 h, the percentage of monocytes in PBMCs decreased significantly at Day 14 (p = 0.01) after a negligible change at Day 7, and later increased at Day 86 (p = 0.095) (Figure 4A). The percentage of DCs fluctuated postvaccination, with the percentages of CD11c+ (Figure 4B) and CD123+ (Figure 4C) cells significantly increased at Day 86 vs. 0 h, and the percentage of plasmacytoid DCs (CD123+) also significantly increased at Days 7 and 28 vs. 0 h.
Figure 4. Kinetics of monocyte, dendritic cell, natural killer (NK) phenotype, and NK functional responses to YF-17D vaccination.
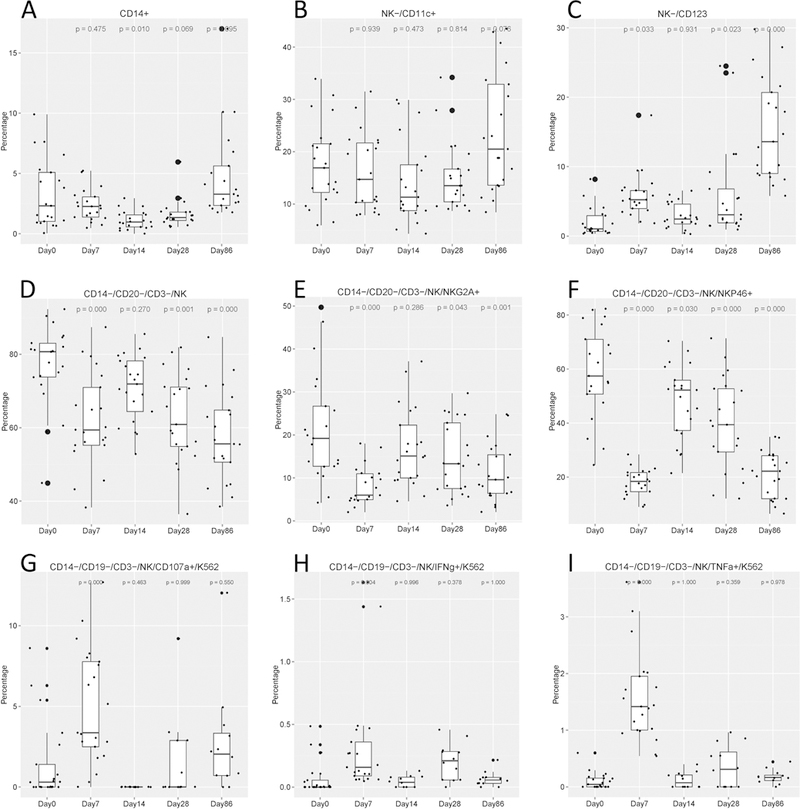
Percentages of (A) monocytes, (B, C) dendritic cells, and (D to F) NK cells out of total peripheral blood mononuclear cells harvested at baseline (prevaccination, Day 0) and then again at Days 7, 14, 28, and 86 post YF-17D vaccination. Immunophenotyping was performed by flow cytometry. (G to I) Percentages of NK cells displaying antibody-dependent cell-mediated cytotoxicity. Boxplots show the cohort distributions, where each dot represents one individual. Boxes indicate medians and interquartile ranges. The number above each plot is the p-value corresponding to the value at Day X compared with the value at baseline (Day 0) as determined by the ANOVA (Dunnett) test.
Generally, the percentage of NK cells decreased after vaccination, with the same trend for both activated (NKp46) (Figure 4F) and inhibitory (NKG2A) (Figure 4E) markers. We also expanded our immunophenotyping analysis by examining NK cell function using the antibody-dependent cell-mediated cytotoxicity (ADCC) assay, which measures the killing of an antibody‐coated target cell by a cytotoxic effector cell through a non-phagocytic process, characterized by the release of the content of cytotoxic granules or by the expression of cell death‐inducing molecules. We investigated ADCC because this activity appears to be involved in protection of cells against flavivirus infection (41). NK-mediated cytotoxicity, as assessed by ADCC activity or secretion of the cytokines TNF-α, IFN-γ, and CD107a, increased significantly at Day 7 and dropped to baseline levels at and after Day 14 (Figure 4 G-I). These data indicate that although the population of NK cells apparently diminished after vaccination, the remaining NK cells still possessed functional capacity.
Vaccination with YF-17D induces upregulation of T and B cell responses
Flow cytometry staining of PBMCs revealed that B cell populations increased at Day 14 vs. Day 0 (p = 0.021) and persisted at high levels for 3 months (p = 0.029 and 0.02 at Day 28 and Day 86, respectively), as shown in Figure 5. Similar to the overall B cell populations, the mature B cell population (IgD+ IgM+) increased after Day 7 (p < 0.001) and remained at a high level until Day 86 (p < 0.001) (Figure 5 B). The IgM-only memory B cells (IgD- IgM+ CD27+) showed a significant boost from Day 28 to Day 86 (Figure 5 C). The percentage of class-switched memory B cells (IgD- IgM- CD27+) (shown in Figure 5 D) slightly decreased at Day 7 but recovered by Day 86. These data show that memory B cells had been developed as soon as Day 7 postvaccination and lasted during the study period for at least 3 months.
Figure 5. Percentages of B cell and T cell subsets and changes in T cell function over time in response to YF-17D vaccination.
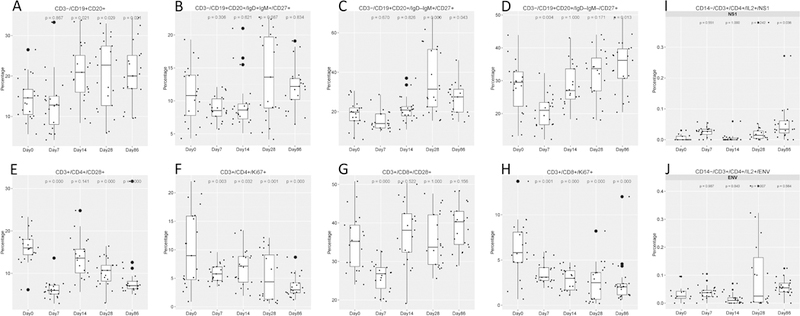
Peripheral blood mononuclear cells (PBMCs) were harvested at Day 0 (prevaccination) and then again at Day 7, Day 14, Day 28, and Day 86 post YF-17D vaccination. PBMCs were stained with cocktails of antibodies to identify B cell subsets (A to E) and T cell subsets (F to I) and analyzed by flow cytometry. Alternatively, PBMCs were stimulated with YFV peptide pools and subjected to intracellular cytokine staining to measure T cell function (I and J). Boxplots show the cohort distributions, where each dot represents a single individual. Each box indicates a median and interquartile range. The indicated number above each plot is the p-value of Day X compared with Day 0 by the ANOVA (Dunnett) test.
To investigate T cell proliferation, we investigated CD28 and Ki67 expression in CD4+ and CD8+ T cells. The percentages of CD4+ and CD8+ T cells expressing CD28 and Ki67 decreased (p < 0.001, p = 0.03, p < 0.001, p = 0.001, respectively) at Day 7 vs. Day 0 (shown in Figure 5 E-H), implying that T cell proliferation was unexpectedly suppressed by vaccination. We also assayed T cell function after stimulation with YFV envelope (Env) peptide pools and nonstructural protein (NS1) peptide pools. This analysis revealed that secretion of YFV-specific IL-2 by CD4+ cells (as shown in Figure 5 I, J) increased at Day 28 and Day 86 post vaccination after stimulation with NS1 and Env antigens, respectively (p = 0.07 and p = 0.038). This finding suggests that CD4+ and CD8+ T cell proliferation likely did not contribute to effector T cell functions observed after vaccination.
Pre-existing flavivirus immunity influences the immune response to YF-17D vaccination
Cross-reactivity between different flaviviruses has been well documented (42). Moreover, most flavivirus infections are asymptomatic (43–45), meaning that individuals may be unaware that they have previously been infected. Because flavivirus seropositivity has been observed in the Chinese population in previous studies (46), we hypothesized that prior flavivirus infection may affect the immune response to the YF-17D vaccine. We therefore performed immunofluorescence assays to investigate baseline serum reactivity to West Nile Virus (WNV) and Japanese encephalitis virus (JEV). We found that six out of the 21 subjects were seropositive to at least one of the flaviviruses tested (Supplemental Figure 3). However, participants’ gene profiles did not seem to vary according to WNV/JEV seropositivity (data not shown). We also compared the immunological data between WNV/JEV-seropositive vs. WNV/JEV-seronegative participants. The percentage of myeloid dendritic cells was higher in WNV/JEV-seronegative participants from Day 14 through Day 86 post vaccination compared to WNV/JEV-seropositive participants (Figure 6A). Interestingly, WNV/JEV-seropositive volunteers showed higher levels of NK activity than WNV/JEV-seronegative participants at Days 7, 28, and 86 postvaccination (Figure 6B). WNV/JEV-seronegative participants showed slightly higher percentages of mature B cells on Days 7 and 28, although these differences were not significant (Figure 6C). Figure 6D shows CD4+ and CD8+ cytokine secretion by baseline flavivirus serostatus. Interestingly, IFN-γ secretion was significantly enhanced in WNV/JEV-seropositive individuals, whereas TNF-α secretion was enhanced in WNV/JEV-seronegative participants (Figure 6D). These results suggest that innate responses were stimulated in a similar way as dendritic cell activation among flavivirus-naïve participants. On the other hand, robust functional NK and T cell responses were primed by prior flavivirus exposure and subsequently boosted by the YF-17D vaccine among WNV/JEV-seropositive participants.
Figure 6. Cellular immunological responses in baseline flavivirus-seropositive vs. flavivirus-naïve participants.
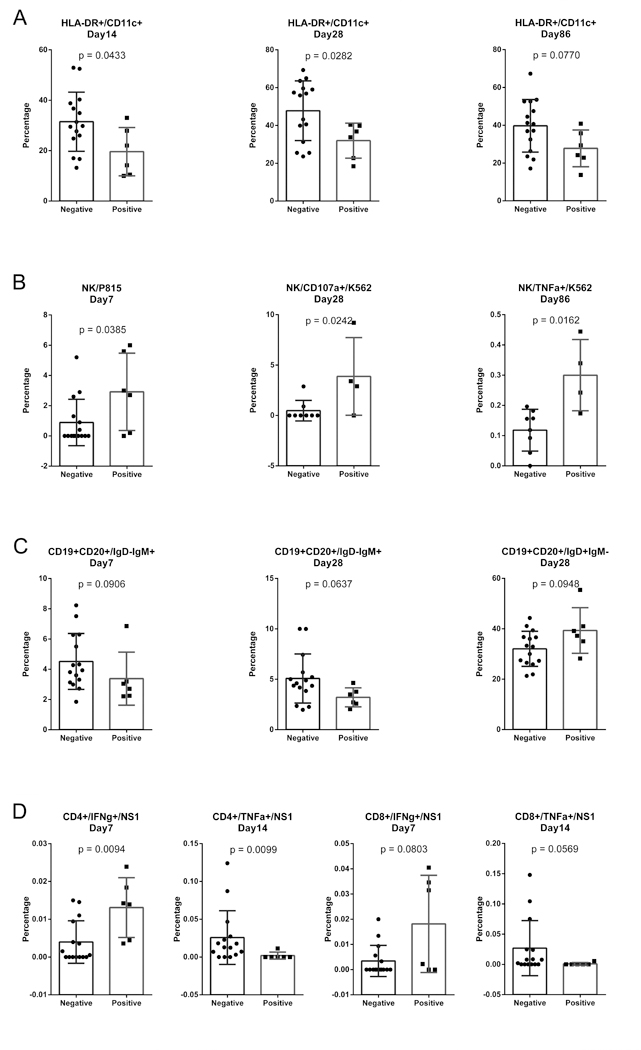
Serum samples taken at baseline were screened by immunofluorescence assay to identify samples with antibodies reactive against West Nile virus and/or Japanese encephalitis virus. Of the 21 participants, 6 showed a pre-existing flavivirus seropositivity. PBMCs were analyzed by flow cytometry immunophenotyping of DCs (A) and B cells (C), NK cells (B) and T cell functional analyses (D) followed by intracellular cytokine staining. The responses in the baseline flavivirus-seropositive vs. flavivirus-naïve participants were compared using the Mann-Whitney test. Only immunological responses with significant or close to significant differences between the two groups are presented. A p value less than 0.05 was considered to indicate statistical significance.
Transcriptomic modules are associated with immune response traits
To investigate which gene sets are associated with a protective immune response, we applied the weighted correlation network analysis (WGCNA) algorithm (34). This algorithm defines transcriptional modules based on Pearson correlations and determines specific gene expression patterns associated with particular immunological responses. The details of the gene coexpression network construction are given in (47) and are briefly summarized in the Materials and Methods. We applied the network construction algorithm to a subset of gene expression, flow cytometry, and cellular functional immunological data from Day 7 postvaccination.
As shown in Figure 7, the transcripts were clustered into distinct groups, hereafter referred to as modules. We identified 5 distinct modules with high topological overlap. To distinguish between modules, we designated each module with an arbitrary color and refer to each module hereafter using this color. Detailed information about each network genes are available in Supplemental Table 2.
Figure 7. Weighted gene co-expression network analysis (WGCNA) network of correlations between gene expression subsets.
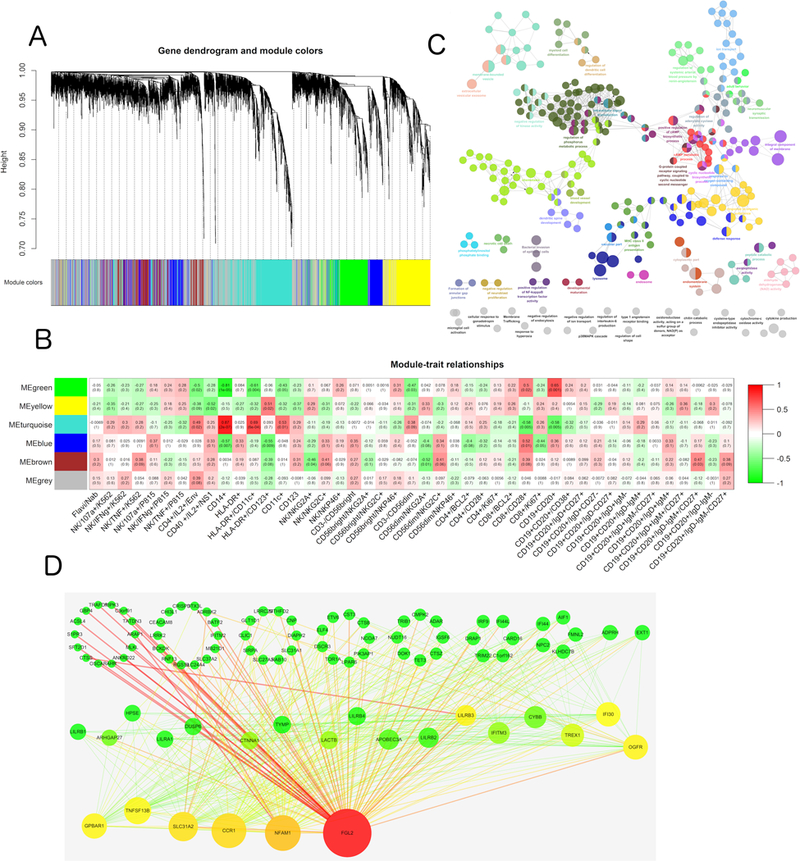
(A) Hierarchical clustering dendrograms of the selected genes of the YF Day 7 co-expression network. The color bands below the dendrograms provide a simple visual comparison of module assignments (branch cuttings) based on the dynamic hybrid branch cutting method. Each band color designates a single module for a gene cluster. (B) Color-coded table of module-trait correlations and p-values. Several significant module-trait associations are shown. Each cell reports the correlation and p-value resulting from correlating module eigengenes (rows) to traits (columns). The table is color-coded by correlation according to the key on the right. (C) Gene ontology and pathway enrichment analysis results of the Turquoise module. Enrichment/depletion was tested by the two-side hypergeometric test, and the Benjamini and Hochberg false discovery rate was set to 0.05. (D) Visualization of WGCNA networks. Node size corresponds to the degree of each gene in the network, and edge size corresponds to the edge betweenness of each gene. Node color corresponds to the betweenness and centrality, and edge color corresponds to edge betweenness. Red represents a higher value for nodes and edges. Green represents a lower value for nodes and edges.
We examined the functional significance of the modules by testing for enriched biochemical pathways and subcellular compartmentalization of proteins corresponding to genes within each module. The results show that each module was enriched with distinct gene sets belonging to separate subcellular compartments.
To gain further insight into the functional significance of the modules, we utilized the ClueGO plugin of Cytoscape to conduct GO and pathway enrichment analysis for each module. Five modules exhibited significant functional enrichment (Figure 7). Specifically, the Turquoise module was significantly enriched for genes in the lysosome (p = 4.21e-5) and immune system defense response (p = 6.91e-4) pathways. Functional enrichments of the other four modules are detailed in Supplemental Table 3-7.
Next, we assessed the physiological relevance of each module by examining the overall correlation of its genes with each of the immunological responses. For a given immunological trait, we assessed gene significance as the absolute value of the correlation between that trait and the gene expression value. The mean gene significance for a particular module can be considered as a measure of module significance (MS), where MS expresses the overall degree of correlation between the trait and the module (Figure 7). The highest MS scores observed were for the Turquoise module with CD14+ macrophage cells (MS = 0.87, p = 2e-7) and myeloid DC cells (MS = 0.69, p = 6e-4), in addition to the Green module with B cells (MS = 0.65, p = 0.001) and CD28++ CD8+ T cells (MS = 0.5, p = 0.02). In addition, the Brown module had a high score for memory B cells (IgD- IgM+ CD27+) (MS = 0.47, p = 0.03). The Blue module was significantly related to the CD8+ T subset proliferation marker CD28 (MS = 0.52, p = 0.01), whereas the Yellow module was associated with myeloid DCs (MS = 0.51, p = 0.02).
Next, these modules were visualized in Cytoscape and hub genes were identified using the network degrees in each module. We concentrated on the Turquoise module because it was strongly associated with DC cells, monocytes, and IL-2 secreting CD4+ T cells. Interestingly, hub genes in the Turquoise module participated in immunological activities. For example, FGL2 has been shown to play a role in regulation of both innate and adaptive responses (48) and NFAM1 is a receptor that activates motif-bearing molecule that regulates B cell development and signaling through its ITAM (49). Moreover, the TNFSF13B gene is abundantly expressed in leukocytes and is specifically expressed in monocytes and macrophages, with an important role in B cell proliferation and differentiation of B cells, and also regulates T-cell activation (50–52). In the Yellow module, HPS5 was identified as a hub gene. HPS5 regulates the synthesis and function of lysosomes and of other highly specialized organelles, in addition to intracellular vesicular trafficking in fibroblasts. This might explain the pathway enrichment in lysosome activation, and suggests that future efforts should focus on CD123+ dendritic cell function.
The transcriptional co-activator PSIP1 was central to the network in the Green module. This gene plays a protective role during stress-induced apoptosis. Another central gene, CCR7, encodes a receptor that is expressed in various lymphoid tissues and activates B and T lymphocytes. CCR7 has been shown to control the migration of memory cells to inflamed tissues, as well as stimulate dendritic cell maturation. The presence of CCR7 in this module might thus explain the association between the Green module and CD8+ T differentiation and co-stimulation (CD28 high expression) and B cells.
In the Blue module, CHD2 was identified as a hub gene. CHD2 binds specifically to the promoters of its target genes, thereby altering gene expression (possibly by modification of chromatin structure). PIK3IP1 (phosphoinositide-3-kinase interacting protein 1) negatively regulates hepatic phosphatidylinositol 3-kinase (PI3K) activity, and DLG1 acts in signal transduction, cell proliferation, and lymphocyte activation. Moreover, CIRBP (cold inducible RNA binding protein) plays a protective role in the genotoxic stress response by stabilizing transcripts of genes involved in cell survival. Consistent with the previous GO and pathway enrichment results, the hub genes in the Brown module are major regulators of metabolism. CYP1A2 encodes a cytochrome P450 enzyme, whereas FAXDC2 is a fatty acid hydroxylase. The other hub genes in this module include chemokine-like factor superfamily member CMTM5, which exhibits tumor suppressor activity. CTDSPL has been shown to negatively regulate RNA polymerase II transcription, and BEND2 participates in protein and DNA interactions that occur during chromatin restructuring or transcription. Regarding the correlation and association analysis, we hypothesize that the YF-17D vaccine successfully activated CD14+ monocytes and MHC+ CD11c+ dendritic cells rapidly after immunization through lysosome activation, and facilitated the subsequent T and B cell responses by upregulation of NFAM1 and TNFSF13B expression, respectively. Therefore, YF-17D vaccine-induced immunity consists of a broad immunological response and a high magnitude protective adaptive immune response.
Comparisons with previously published data
Finally, we compared our data with those of the Emory cohort study from the Pulendran laboratory (GSE13486) (16) and the Montreal and Lausanne cohorts from the Sekaly laboratory (GSE13699) (17). To this end, data from Days 3, 7, and 14 from the respective studies were downloaded from the Gene Expression Omnibus and processed in the same microarray data analysis pipeline as described in the Materials and Methods. The same threshold for selection of DEGs (BH-adjusted p value < 0.01, absolute fold-change > 1.5) was used to enable comparison of the different datasets. The results of this comparison are shown in Supplementary Figure 4. The three studies shared only 2 DEGs in common on Day 3, whereas they shared 54 DEGs in common on Day 7. Thus, the responses in the three studies seem to have diverged at the early time-points and then converged slightly by one week postvaccination; the DEGs shared at Day 7 were significantly enriched for functions such as “response to virus” and “response to stimulus”, which are logical functions to be differentially regulated in the cohorts of all 3 studies. We also found that the Beijing cohort had by far the most unique DEGs on Day 3 (317 vs. 60 vs. 2 for the Beijing, Montreal/Lausanne, Emory cohorts, respectively), indicating that the responses of the two predominantly North American and European cohorts were more similar on Day 3 compared to the response of the Beijing cohort (Supplemental Figure 4). Interestingly, the DEGs unique to the Beijing cohort on Day 3 were significantly enriched for processes related to metabolic function and programmed cell death. The implications of this finding are unclear. At Day 14 to Day 28, the DEGs of the 3 studies again exhibited more differences, indicating that the responses diverged again after the apparent convergence on Day 7. We note that until Day 28 postvaccination, our cohort exhibited differential regulation of immune-related processes, demonstrating the persistent nature of the transcriptional response observed in our study.
Discussion
The YF-17D vaccine is one of the most effective and successful vaccines ever developed. Vaccine-induced protection is likely mediated by neutralizing antibodies, with cytotoxic T cells probably also playing a role (53, 54). Despite its success, little is known about the mechanisms by which YF-17D induces these effective immune responses, although systems vaccinology has opened new avenues towards answering this question (16, 17). Our study builds on and extends these previous studies by: 1) performing PBMC transcriptional profiling at a very early stage after vaccination (4 h); 2) determining the effects of flavivirus pre-existing immunity on the immune response to YF-17D vaccination; and 3) using a cohort from a different geographical location than those used in previous studies.
We discuss the implications of these differences below:
1). Addition of the 4 h time-point:
We identified 146 DEGs at 4 h, including a total of 11 DEGs (6 upregulated and 5 downregulated) that were no longer differentially expressed at 24 h, thus constituting the earliest observed transcriptional response to YF-17D vaccination. Of note, the gene with the largest expression difference between 4 h and 24 h was SERPINF1 (also known as PEDF), which interestingly has been shown to induce proinflammatory cytokines (IL-1β, IL-6, TNFα, MIP1α, and MIP3α) in microglia (55, 56). Our analysis of PPI hub gene expression (Figure 1B) also revealed that the pattern of differential regulation observed at 4 h was quite different from the pattern on Days 1, 2, 3, and 5. Specifically, PPI hub genes appear to undergo rapid (within 4 h) differential regulation after vaccination; within 24 h most of these hub genes are actually regulated in the opposite direction and maintain this pattern for days.
We note that, as expected, some of the earliest activated pathways (4 h) were those involved in the innate immune response, e.g. PPAR signaling and LXR/RXR activation. Moreover, subsequent downstream signaling pathways (e.g. PKA, ERK/MAPK) were also activated at early time-points postvaccination. We also note that our study is the first to report that vaccination with YF-17D activates the immune response through chemokine/receptor activity at 4 h postvaccination. Interestingly however, approximately 3 times more DEGs were downregulated at the 4 h time-point than were upregulated (110 vs. 36), implying that the early transcriptional response to YF-1D vaccination consists of more dampening than activation. Consistent with this interpretation, pathways such as the IL-1, IL-6, IL-8, TNFR1, and B cell receptor signaling pathways were all inhibited at the 4 h time-point, which may be due to the stress responses caused by vaccination. Another explanation for the downregulation of genes/modules at the 4 h time-point is that effector cells may have been recruited at the site of vaccination, thus transiently disappearing from the blood. This explanation could also explain the unexpected decrease in proliferating T cells that was observed at Day 7 post-vaccination. Cumulatively, these data suggest that the transcriptional response to YF-17D vaccination is induced rapidly and changes significantly within the first 24 h post-vaccination, thus providing support for inclusion of this early time-point in future systems vaccinology analyses.
2). Baseline flavivirus serostatus:
The effect of pre-existing flavivirus immunity on responses to YF-17D vaccination has not been previously investigated. We hypothesized that baseline JEV/WNV-seronegative participants would have different immune responses to YF-17D vaccination compared to baseline JEV/WNV-seropositive participants. Our hypothesis was based on the following findings: 1) antibodies in the serum of individuals who were vaccinated against tick-borne encephalitis virus (TBEV), JEV, and/or YFV were able to neutralize louping ill virus, WNV, and/or dengue virus serotype 2 (57). 2) Pre-existing vaccine-induced immunity to TBEV enhanced the neutralizing antibody response following vaccination with inactivated JEV (58), while prior inoculation with one flavivirus was shown to reduce infection severity after subsequent challenge with a different flavivirus in a hamster model (59, 60). Thus, we reasoned that pre-existing anti-flavivirus antibodies with cross-reactivity against YFV would affect the magnitude of vaccine uptake via Fc receptor-mediated mechanisms and alter the quality and magnitude of the innate immune response. For instance, YFV has been shown to infect DCs and to signal through multiple Toll-like receptors on distinct subsets of these DCs (21). Ad5 has also been shown to bind efficiently to DCs, in an FcR-dependent fashion, in the presence of anti-Ad5 antibodies, and Ad5 antibodies also increase viral uptake into DCs (61). In support of our hypothesis, we found that pre-existing flavivirus immunity decreased the percentage of dendritic cells (HLA-DR+ and CD11c+) in PBMCs from Day 14 to Day 86 postvaccination. The percentages of TNF-α secreting T cells were also decreased over these time-points. These findings may indicate that the vaccine was more effective in stimulating the innate immune response and the inflammatory response in baseline flavivirus-naïve participants than in baseline flavivirus-seropositive participants. However, the functional NK and T cells (IFN-γ dominated) could still be boosted from memory cells. Since sequential immunization with heterologous chimeric flavivirus has been shown to induce cross-reactive CD8+ T cell responses (62), the high levels of IFN-γ secreting T cells in baseline flavivirus-seropositive individuals were not unexpected. In China, only few yellow fever cases are reported annually, but dengue and JEV incidence rates are high. Thus, our findings highlight the importance of considering pre-existing flavivirus serostatus in the development of vaccines against other flaviviruses and in interpreting data from vaccine clinical trials.
3). Cohort differences.
Previous YFV systems vaccinology studies enrolled participants at study sites in Europe [Montreal and Lausanne (France)] (17) and the United States (Atlanta, Georgia) (16, 17). Our study, which recruited participants at the Beijing CDC (China), is the first systems-based analysis of the response to the YF-17D vaccine in a Chinese population. Considering that JEV is only endemic in Asian countries (63) and that prior JEV infection appears to alter the immune response to YF-17D vaccination (as discussed above), our study provides important information about the immune response in participants who are baseline-JEV positive.
Another difference between our study and that discussed in (16, 17) is that the Tiantan YF-17D vaccine was used rather than the Sanofi vaccine. However, we consider it unlikely that this difference would have significantly affected our results. Generally, all YFV strains sequenced to date are highly conserved (overall sequence homology of 99.2%). Moreover, the yellow fever 17D strain is used in both the Tiantan and Sanofi vaccines; the sequence homology of YF-17D is 99.8%. Genealogical analysis of passaged 17D strains has revealed that the YF-17D Tiantan strain separated from the other YF-17D strains at passage 229 and has only 13 nucleotide differences throughout the entire genome. These nucleotide differences led to only 6 amino acid substitutions that were distributed in the capsid, Env, NS1, and NS2 proteins (64). Thus, YFV vaccine strains are highly genetically stable. Since the vaccine strains used in the different cohorts were almost identical, we favor the explanation that differences seen in innate immune responses to the YF-17D vaccine are the result of ethnic differences between participants in Montreal/Lausanne/Atlanta and participants in China.
A major goal of our study was to study temporal changes in the response to YF-17D vaccination. Based on functional enrichment analysis of DEGs at the different time-points, the response appeared to cluster into three different “waves”, consisting of Hour 4, Day 1 to Day 7, and Day 14 to Day 28. Each of these response waves exhibited distinct characteristics. In the first wave (Hour 4) the majority of processes affected by vaccination were downregulated. Various immunity pathways (e.g. Toll-like and NOD-like receptors) may be involved in feedback regulation when they respond to vaccine stimulation and stress. Then from Day 1 to Day 7, the majority of processes affected by vaccination involved upregulation of antiviral responses, either innate activation (e.g. cytosolic DNA sensing pathway, RIG-I like receptor pathway) or interferon I/II pathways. Pathways such as PPAR signaling and LXR/RXR activation were activated early (4 h) and exhibited sustained activation for 5 days postvaccination; this activation had returned to baseline levels by 1 week postvaccination. In contrast, interferon signaling was activated in a phasic manner, becoming highly activated at Day 2, returning to baseline levels at Day 3, and then again returning to strong activation on Days 5 and 7. It is also striking that a number of cytokine signaling pathways were quickly dampened at the 4 h time-point and exhibited sustained suppression for up to 5 days postvaccination (e.g. IL-6, IL-1).
The gene ontology enrichment analysis (Supplemental Fig 5) was consistent with the pathway enrichment analysis. Specifically, in addition to inhibition of proinflammatory cytokine pathways throughout the entire time-course (e.g. IL-1, IL-6; Figure 2), the biological processes and molecular functions that were overrepresented included transcription factor activity, phosphorylation, and response to reactive oxygen species, which may imply the stress response encountered upon the exogenous stimulus of YFV inoculation. Moreover, chemokine receptor activity was significantly overrepresented until Day 1 postvaccination, which may indicate the initiation of the immune response. Previous studies of the tuberculosis vaccine candidate MVA85A (65) and the influenza vaccine (66) indicated that early patterns of gene expression could be induced within 24 hours postadministration.
We observed that vaccination with YF-17D induced a broad spectrum of innate and adaptive responses. Innate responses: Several innate immunity effector cells (e.g. DCs and NK cells) were involved in the response, as evidenced by the following findings: 1) the percentages of DCs and myeloid DCs were increased and remained high throughout the time-course; and 2) NK activity increased after Day 7. In particular, our data indicate a role for CD107a+ TNF-α and IFN-γ-secreting NK cells in the innate response after vaccination. Interestingly, the CD14+CD16+ inflammatory monocyte population declined at Day 7 and peaked at Day 14 postvaccination (data not shown). Adaptive responses: Our results also highlight the critical role of B and T cell function after vaccination. Indeed, B cell populations were highly expanded, especially the mature B cell and memory B cell subsets; this expansion persisted for 3 months (Figure 5). Neutralizing antibodies were detected on Day 28, with significant inter-subject variation (Supplemental Fig 6). Although the mean neutralizing antibody titer dropped significantly on Day 84 compared to Day 28 (Supplemental Figure 6A), all subjects developed neutralizing antibody titers well above that believed to be required for protection (67). Moreover, we observed the increased trend from seropositive subjects compared with seronegative subjects on Day 28 (Supplemental Figure 6B), but not significant difference may due to the limited sample size. Although we did not observe T cell proliferation, enhanced IL-2 secretion by CD4+ T cells was observed at late post-vaccination time-points. This finding is interesting considering the role of this cytokine in the development of T regulatory cells (68). Cumulatively, our results indicate that many types of immune responses act in concert to achieve the long-lasting protection conferred by YF-17D vaccination. From this perspective, systems biology approaches are essential tools for evaluating immune-mediated protection.
Using WGCNA, we also explored the co-expression network of the predominant immunological responses. CD4+ and CD8+ T cell function after stimulation with either YFV Env or NS1 peptides stimulation were not as robustness as expected. However, the Turquoise module did exhibit a high MS score. Moreover, in the Turquoise module, the DC subsets exhibited high scores and were the majority innate cell type involved, consistent with findings that YFV activates distinct DC subsets (67). We found that TNFSF13B was central to the gene set in the Turquoise module, which is an interesting finding considering the strong association of this gene with naïve immunological cells. Specifically, TNFSF13B (also known as BAFF, or B-cell activating factor) is involved in B cell proliferation and differentiation and the regulation of T cell activation (52), and overall enhances the immune response. An interesting connection between our findings and those of Querec et al. (16) is that TNFSF17 has been shown to bind specifically to TNFSF13B/BAFF, thereby leading to NF-kappa B and MAPK8/JNK activation (50, 51). Querec et al. found that TNFRSF17 was a component of the gene signature that predicted the neutralizing antibody response with up to 100% accuracy. Since both molecules represent a common pathway of B cell activation and antibody production, our findings indicate that B cell function is central in the response to YF-17D vaccination. Additionally, we also identified NFAM1 as a central component; this gene also modulates B cell signaling through its immunoreceptor tyrosine-based activation motif, thereby regulating B cell development (49). Further studies are necessary to determine whether inhibition/activation of these molecules influences T and B cell functionality and innate activation induced by YFV infection.
In conclusion, using a systems vaccinology approach we identified genetic signatures associated with immunological responses and regulatory networks involved in the response to vaccination with YF-17D. We note that the longstanding use, well-defined production protocol, and outstanding safety profile of the YF-17D vaccine have generated interest in using this vaccine as a platform for designing novel vaccines against other infectious agents (69). Systems approaches such as ours could help guide reengineering of this vaccine to elicit the desired immune response. For example, our approaches and analyses could be used in clinical trials of preventative HIV vaccines to understand the responses induced by administration of a vaccinia chimeric HIV vaccine. Although the vaccine-elicited immune responses predictive of protection from HIV infection are not yet known, the future identification of such responses could be combined with systems vaccinology to help speed the evaluation of candidate immunogens and/or improve vaccine-elicited immune responses.
Supplementary Material
Acknowledgements
We thank Dr. Rafick Sekaly for kindly supplying the YFV peptides. This work was supported by grants from the National Major Projects for Infectious Diseases Control and Prevention (2012ZX10001008), the National Natural Science Foundation of China (81020108030), the State Key Laboratory for Infectious Disease Prevention and Control Development (2011SKLID303), and the Young Scholar Scientific Research Foundation of China CDC (2012A105).
Footnotes
Conflicts of Interest Disclosure
The authors declare no commercial or financial conflicts of interest.
References
- 1.Flynn NM, Forthal DN, Harro CD, Judson FN, Mayer KH, Para MF, and rgp HIVVSG. 2005. Placebo-controlled phase 3 trial of a recombinant glycoprotein 120 vaccine to prevent HIV-1 infection. The Journal of infectious diseases 191: 654–665. [DOI] [PubMed] [Google Scholar]
- 2.Gilbert PB, Ackers ML, Berman PW, Francis DP, Popovic V, Hu DJ, Heyward WL, Sinangil F, Shepherd BE, and Gurwith M. 2005. HIV-1 virologic and immunologic progression and initiation of antiretroviral therapy among HIV-1-infected subjects in a trial of the efficacy of recombinant glycoprotein 120 vaccine. The Journal of infectious diseases 192: 974–983. [DOI] [PubMed] [Google Scholar]
- 3.Buchbinder SP, Mehrotra DV, Duerr A, Fitzgerald DW, Mogg R, Li D, Gilbert PB, Lama JR, Marmor M, Del Rio C, McElrath MJ, Casimiro DR, Gottesdiener KM, Chodakewitz JA, Corey L, Robertson MN, and Step Study Protocol T. 2008. Efficacy assessment of a cell-mediated immunity HIV-1 vaccine (the Step Study): a double-blind, randomised, placebo-controlled, test-of-concept trial. Lancet 372: 1881–1893. [DOI] [PMC free article] [PubMed] [Google Scholar]
- 4.Pulendran B, and Ahmed R. 2011. Immunological mechanisms of vaccination. Nature immunology 12: 509–517. [DOI] [PMC free article] [PubMed] [Google Scholar]
- 5.Kaiser J 2008. AIDS research. Review of vaccine failure prompts a return to basics. Science 320: 30–31. [DOI] [PubMed] [Google Scholar]
- 6.Watkins DI 2008. Highlights of the 15th Conference on Retroviruses and Opportunistic Infections. Basic HIV vaccine development. Topics in HIV medicine : a publication of the International AIDS Society, USA 16: 7–8. [PubMed] [Google Scholar]
- 7.Watkins DI, Burton DR, Kallas EG, Moore JP, and Koff WC. 2008. Nonhuman primate models and the failure of the Merck HIV-1 vaccine in humans. Nature medicine 14: 617–621. [DOI] [PMC free article] [PubMed] [Google Scholar]
- 8.Klausner RD, Fauci AS, Corey L, Nabel GJ, Gayle H, Berkley S, Haynes BF, Baltimore D, Collins C, Douglas RG, Esparza J, Francis DP, Ganguly NK, Gerberding JL, Johnston MI, Kazatchkine MD, McMichael AJ, Makgoba MW, Pantaleo G, Piot P, Shao Y, Tramont E, Varmus H, and Wasserheit JN. 2003. Medicine. The need for a global HIV vaccine enterprise. Science 300: 2036–2039. [DOI] [PubMed] [Google Scholar]
- 9.Esparza J 2005. The global HIV vaccine enterprise. International microbiology : the official journal of the Spanish Society for Microbiology 8: 93–101. [PubMed] [Google Scholar]
- 10.Zak DE, Andersen-Nissen E, Peterson ER, Sato A, Hamilton MK, Borgerding J, Krishnamurty AT, Chang JT, Adams DJ, Hensley TR, Salter AI, Morgan CA, Duerr AC, De Rosa SC, Aderem A, and McElrath MJ. 2012. Merck Ad5/HIV induces broad innate immune activation that predicts CD8(+) T-cell responses but is attenuated by preexisting Ad5 immunity. Proceedings of the National Academy of Sciences of the United States of America 109: E3503–3512. [DOI] [PMC free article] [PubMed] [Google Scholar]
- 11.Ackerman ME, Barouch DH, and Alter G. 2017. Systems serology for evaluation of HIV vaccine trials. Immunol Rev 275: 262–270. [DOI] [PMC free article] [PubMed] [Google Scholar]
- 12.Chung AW, Kumar MP, Arnold KB, Yu WH, Schoen MK, Dunphy LJ, Suscovich TJ, Frahm N, Linde C, Mahan AE, Hoffner M, Streeck H, Ackerman ME, McElrath MJ, Schuitemaker H, Pau MG, Baden LR, Kim JH, Michael NL, Barouch DH, Lauffenburger DA, and Alter G. 2015. Dissecting Polyclonal Vaccine-Induced Humoral Immunity against HIV Using Systems Serology. Cell 163: 988–998. [DOI] [PMC free article] [PubMed] [Google Scholar]
- 13.Nakaya HI, Wrammert J, Lee EK, Racioppi L, Marie-Kunze S, Haining WN, Means AR, Kasturi SP, Khan N, Li GM, McCausland M, Kanchan V, Kokko KE, Li S, Elbein R, Mehta AK, Aderem A, Subbarao K, Ahmed R, and Pulendran B. 2011. Systems biology of vaccination for seasonal influenza in humans. Nature immunology 12: 786–795. [DOI] [PMC free article] [PubMed] [Google Scholar]
- 14.Li S, Rouphael N, Duraisingham S, Romero-Steiner S, Presnell S, Davis C, Schmidt DS, Johnson SE, Milton A, Rajam G, Kasturi S, Carlone GM, Quinn C, Chaussabel D, Palucka AK, Mulligan MJ, Ahmed R, Stephens DS, Nakaya HI, and Pulendran B. 2014. Molecular signatures of antibody responses derived from a systems biology study of five human vaccines. Nat Immunol 15: 195–204. [DOI] [PMC free article] [PubMed] [Google Scholar]
- 15.Kwissa M, Nakaya HI, Onlamoon N, Wrammert J, Villinger F, Perng GC, Yoksan S, Pattanapanyasat K, Chokephaibulkit K, Ahmed R, and Pulendran B. 2014. Dengue virus infection induces expansion of a CD14(+)CD16(+) monocyte population that stimulates plasmablast differentiation. Cell host & microbe 16: 115–127. [DOI] [PMC free article] [PubMed] [Google Scholar]
- 16.Querec TD, Akondy RS, Lee EK, Cao W, Nakaya HI, Teuwen D, Pirani A, Gernert K, Deng J, Marzolf B, Kennedy K, Wu H, Bennouna S, Oluoch H, Miller J, Vencio RZ, Mulligan M, Aderem A, Ahmed R, and Pulendran B. 2009. Systems biology approach predicts immunogenicity of the yellow fever vaccine in humans. Nat Immunol 10: 116–125. [DOI] [PMC free article] [PubMed] [Google Scholar]
- 17.Gaucher D, Therrien R, Kettaf N, Angermann BR, Boucher G, Filali-Mouhim A, Moser JM, Mehta RS, Drake DR 3rd, Castro E, Akondy R, Rinfret A, Yassine-Diab B, Said EA, Chouikh Y, Cameron MJ, Clum R, Kelvin D, Somogyi R, Greller LD, Balderas RS, Wilkinson P, Pantaleo G, Tartaglia J, Haddad EK, and Sekaly RP. 2008. Yellow fever vaccine induces integrated multilineage and polyfunctional immune responses. J Exp Med 205: 3119–3131. [DOI] [PMC free article] [PubMed] [Google Scholar]
- 18.Pulendran B 2009. Learning immunology from the yellow fever vaccine: innate immunity to systems vaccinology. Nature reviews. Immunology 9: 741–747. [DOI] [PubMed] [Google Scholar]
- 19.Monath TP 2005. Yellow fever vaccine. Expert review of vaccines 4: 553–574. [DOI] [PubMed] [Google Scholar]
- 20.SAGE Working Group. Background Paper on Yellow Fever Vaccine. www.who.int/immunization/sage/meetings/2013/april/1_Background_Paper_Yellow_Fever_Vaccines.pdf?ua= Version: 19 March 2013. Access date April 7, 2017.
- 21.Querec T, Bennouna S, Alkan S, Laouar Y, Gorden K, Flavell R, Akira S, Ahmed R, and Pulendran B. 2006. Yellow fever vaccine YF-17D activates multiple dendritic cell subsets via TLR2, 7, 8, and 9 to stimulate polyvalent immunity. The Journal of experimental medicine 203: 413–424. [DOI] [PMC free article] [PubMed] [Google Scholar]
- 22.Barrett AD, and Teuwen DE. 2009. Yellow fever vaccine - how does it work and why do rare cases of serious adverse events take place? Current opinion in immunology 21: 308–313. [DOI] [PubMed] [Google Scholar]
- 23.Liu Q, Sun Y, Rihn S, Nolting A, Tsoukas PN, Jost S, Cohen K, Walker B, and Alter G. 2009. Matrix metalloprotease inhibitors restore impaired NK cell-mediated antibody-dependent cellular cytotoxicity in human immunodeficiency virus type 1 infection. J Virol 83: 8705–8712. [DOI] [PMC free article] [PubMed] [Google Scholar]
- 24.Sandberg R, and Larsson O. 2007. Improved precision and accuracy for microarrays using updated probe set definitions. BMC Bioinformatics 8: 48. [DOI] [PMC free article] [PubMed] [Google Scholar]
- 25.Dai M, Wang P, Boyd A, Kostov G, Athey B, Jones E, Bunney W, Myers R, Speed T, Akil H, Watson S, and Meng F. 2005. Evolving gene/transcript definitions significantly alter the interpretation of GeneChip data. Nucleic Acids Res 33: e175. [DOI] [PMC free article] [PubMed] [Google Scholar]
- 26.Smyth GK 2004. Linear models and empirical bayes methods for assessing differential expression in microarray experiments. Statistical applications in genetics and molecular biology 3: Article3. [DOI] [PubMed] [Google Scholar]
- 27.Keshava Prasad TS, Goel R, Kandasamy K, Keerthikumar S, Kumar S, Mathivanan S, Telikicherla D, Raju R, Shafreen B, Venugopal A, Balakrishnan L, Marimuthu A, Banerjee S, Somanathan DS, Sebastian A, Rani S, Ray S, Harrys Kishore CJ, Kanth S, Ahmed M, Kashyap MK, Mohmood R, Ramachandra YL, Krishna V, Rahiman BA, Mohan S, Ranganathan P, Ramabadran S, Chaerkady R, and Pandey A. 2009. Human Protein Reference Database−−2009 update. Nucleic Acids Res 37: D767–772. [DOI] [PMC free article] [PubMed] [Google Scholar]
- 28.Maere S, Heymans K, and Kuiper M. 2005. BiNGO: a Cytoscape plugin to assess overrepresentation of gene ontology categories in biological networks. Bioinformatics 21: 3448–3449. [DOI] [PubMed] [Google Scholar]
- 29.Emmert-Streib F, and Glazko GV. 2011. Pathway analysis of expression data: deciphering functional building blocks of complex diseases. PLoS computational biology 7: e1002053. [DOI] [PMC free article] [PubMed] [Google Scholar]
- 30.Bindea G, Galon J, and Mlecnik B. 2013. CluePedia Cytoscape plugin: pathway insights using integrated experimental and in silico data. Bioinformatics 29: 661–663. [DOI] [PMC free article] [PubMed] [Google Scholar]
- 31.Bindea G, Mlecnik B, Hackl H, Charoentong P, Tosolini M, Kirilovsky A, Fridman WH, Pages F, Trajanoski Z, and Galon J. 2009. ClueGO: a Cytoscape plug-in to decipher functionally grouped gene ontology and pathway annotation networks. Bioinformatics 25: 1091–1093. [DOI] [PMC free article] [PubMed] [Google Scholar]
- 32.Calvano SE, Xiao W, Richards DR, Felciano RM, Baker HV, Cho RJ, Chen RO, Brownstein BH, Cobb JP, Tschoeke SK, Miller-Graziano C, Moldawer LL, Mindrinos MN, Davis RW, Tompkins RG, Lowry SF, Inflamm P, Host Response to Injury Large Scale Collab. Res. 2005. A network-based analysis of systemic inflammation in humans. Nature 437: 1032–1037. [DOI] [PubMed] [Google Scholar]
- 33.Nakazawa M 2014. fmsb: Functions for medical statistics book with some demographic data. [Google Scholar]
- 34.Langfelder P, and Horvath S. 2008. WGCNA: an R package for weighted correlation network analysis. BMC bioinformatics 9: 559. [DOI] [PMC free article] [PubMed] [Google Scholar]
- 35.Yu H, Kim PM, Sprecher E, Trifonov V, and Gerstein M. 2007. The importance of bottlenecks in protein networks: correlation with gene essentiality and expression dynamics. PLoS Comput Biol 3: e59. [DOI] [PMC free article] [PubMed] [Google Scholar]
- 36.Vallabhajosyula RR, Chakravarti D, Lutfeali S, Ray A, and Raval A. 2009. Identifying hubs in protein interaction networks. PLoS One 4: e5344. [DOI] [PMC free article] [PubMed] [Google Scholar]
- 37.Berger J, and Moller DE. 2002. The mechanisms of action of PPARs. Annual review of medicine 53: 409–435. [DOI] [PubMed] [Google Scholar]
- 38.Feige JN, Gelman L, Michalik L, Desvergne B, and Wahli W. 2006. From molecular action to physiological outputs: peroxisome proliferator-activated receptors are nuclear receptors at the crossroads of key cellular functions. Progress in lipid research 45: 120–159. [DOI] [PubMed] [Google Scholar]
- 39.Suthar MS, Aguirre S, and Fernandez-Sesma A. 2013. Innate immune sensing of flaviviruses. PLoS Pathog 9: e1003541. [DOI] [PMC free article] [PubMed] [Google Scholar]
- 40.Honda K, and Taniguchi T. 2006. IRFs: master regulators of signalling by Toll-like receptors and cytosolic pattern-recognition receptors. Nat Rev Immunol 6: 644–658. [DOI] [PubMed] [Google Scholar]
- 41.Diamond MS 2003. Evasion of innate and adaptive immunity by flaviviruses. Immunol Cell Biol 81: 196–206. [DOI] [PubMed] [Google Scholar]
- 42.Calisher CH, Karabatsos N, Dalrymple JM, Shope RE, Porterfield JS, Westaway EG, and Brandt WE. 1989. Antigenic Relationships between Flaviviruses as Determined by Cross-neutralization Tests with Polyclonal Antisera. Journal of General Virology 70: 37–43. [DOI] [PubMed] [Google Scholar]
- 43.Centers for Disease Control and Prevention. Japanese Encephalitis. https://www.cdc.gov/japaneseencephalitis/. Last updated Aug 5, 2015. Access date April 7, 2017.
- 44.Centers for Disease Control and Prevention. West Nile virus. https://www.cdc.gov/westnile/index.html. Last updated September 13, 2016. Access date April 7, 2016.
- 45.Centers for Disease Control and Prevention. Clinical guidance - Dengue virus. https://www.cdc.gov/dengue/clinicallab/clinical.html. Last updated September 6, 2014. Access date April 7, 2017.
- 46.Li XL, Fu SH, Liu WB, Wang HY, Lu Z, Tong SX, Li ZX, Nasci RS, Kosoy O, Cui Y, and Liang GD. 2013. West nile virus infection in Xinjiang, China. Vector Borne Zoonotic Dis 13: 131–133. [DOI] [PubMed] [Google Scholar]
- 47.Zhang B, and Horvath S. 2005. A general framework for weighted gene co-expression network analysis. Statistical applications in genetics and molecular biology 4: Article17. [DOI] [PubMed] [Google Scholar]
- 48.Marazzi S, Blum S, Hartmann R, Gundersen D, Schreyer M, Argraves S, von Fliedner V, Pytela R, and Ruegg C. 1998. Characterization of human fibroleukin, a fibrinogen-like protein secreted by T lymphocytes. J Immunol 161: 138–147. [PubMed] [Google Scholar]
- 49.Ohtsuka M, Arase H, Takeuchi A, Yamasaki S, Shiina R, Suenaga T, Sakurai D, Yokosuka T, Arase N, Iwashima M, Kitamura T, Moriya H, and Saito T. 2004. NFAM1, an immunoreceptor tyrosine-based activation motif-bearing molecule that regulates B cell development and signaling. Proc Natl Acad Sci U S A 101: 8126–8131. [DOI] [PMC free article] [PubMed] [Google Scholar]
- 50.Shu HB, and Johnson H. 2000. B cell maturation protein is a receptor for the tumor necrosis factor family member TALL-1. Proc Natl Acad Sci U S A 97: 9156–9161. [DOI] [PMC free article] [PubMed] [Google Scholar]
- 51.Liu Y, Hong X, Kappler J, Jiang L, Zhang R, Xu L, Pan CH, Martin WE, Murphy RC, Shu HB, Dai S, and Zhang G. 2003. Ligand-receptor binding revealed by the TNF family member TALL-1. Nature 423: 49–56. [DOI] [PubMed] [Google Scholar]
- 52.Mackay F, and Browning JL. 2002. BAFF: a fundamental survival factor for B cells. Nat Rev Immunol 2: 465–475. [DOI] [PubMed] [Google Scholar]
- 53.Co MD, Kilpatrick ED, and Rothman AL. 2009. Dynamics of the CD8 T-cell response following yellow fever virus 17D immunization. Immunology 128: e718–727. [DOI] [PMC free article] [PubMed] [Google Scholar]
- 54.Plotkin SA 2010. Correlates of protection induced by vaccination. Clin Vaccine Immunol 17: 1055–1065. [DOI] [PMC free article] [PubMed] [Google Scholar]
- 55.Sanagi T, Yabe T, and Yamada H. 2005. The regulation of pro-inflammatory gene expression induced by pigment epithelium-derived factor in rat cultured microglial cells. Neurosci Lett 380: 105–110. [DOI] [PubMed] [Google Scholar]
- 56.Yabe T, Sanagi T, Schwartz JP, and Yamada H. 2005. Pigment epithelium-derived factor induces pro-inflammatory genes in neonatal astrocytes through activation of NF-kappa B and CREB. Glia 50: 223–234. [DOI] [PubMed] [Google Scholar]
- 57.Mansfield KL, Horton DL, Johnson N, Li L, Barrett AD, Smith DJ, Galbraith SE, Solomon T, and Fooks AR. 2011. Flavivirus-induced antibody cross-reactivity. The Journal of general virology 92: 2821–2829. [DOI] [PMC free article] [PubMed] [Google Scholar]
- 58.Schuller E, Klade CS, Heinz FX, Kollaritsch H, Rendi-Wagner P, Jilma B, and Tauber E. 2008. Effect of pre-existing anti-tick-borne encephalitis virus immunity on neutralising antibody response to the Vero cell-derived, inactivated Japanese encephalitis virus vaccine candidate IC51. Vaccine 26: 6151–6156. [DOI] [PubMed] [Google Scholar]
- 59.Tesh RB, Travassos da Rosa AP, Guzman H, Araujo TP, and Xiao SY. 2002. Immunization with heterologous flaviviruses protective against fatal West Nile encephalitis. Emerging infectious diseases 8: 245–251. [DOI] [PMC free article] [PubMed] [Google Scholar]
- 60.Bosco-Lauth A, Mason G, and Bowen R. 2011. Pathogenesis of Japanese encephalitis virus infection in a golden hamster model and evaluation of flavivirus cross-protective immunity. The American journal of tropical medicine and hygiene 84: 727–732. [DOI] [PMC free article] [PubMed] [Google Scholar]
- 61.Zaiss AK, Machado HB, and Herschman HR. 2009. The influence of innate and pre-existing immunity on adenovirus therapy. Journal of cellular biochemistry 108: 778–790. [DOI] [PMC free article] [PubMed] [Google Scholar]
- 62.Singh R, Rothman AL, Potts J, Guirakhoo F, Ennis FA, and Green S. 2010. Sequential immunization with heterologous chimeric flaviviruses induces broad-spectrum cross-reactive CD8+ T cell responses. J Infect Dis 202: 223–233. [DOI] [PMC free article] [PubMed] [Google Scholar]
- 63.Campbell GL, Hills SL, Fischer M, Jacobson JA, Hoke CH, Hombach JM, Marfin AA, Solomon T, Tsai TF, Tsu VD, and Ginsburg AS. 2011. Estimated global incidence of Japanese encephalitis: a systematic review. Bull World Health Organ 89: 766–774, 774A-774E. [DOI] [PMC free article] [PubMed] [Google Scholar]
- 64.Stock NK, Boschetti N, Herzog C, Appelhans MS, and Niedrig M. 2012. The phylogeny of yellow fever virus 17D vaccines. Vaccine 30: 989–994. [DOI] [PubMed] [Google Scholar]
- 65.Matsumiya M, Harris SA, Satti I, Stockdale L, Tanner R, O’Shea MK, Tameris M, Mahomed H, Hatherill M, Scriba TJ, Hanekom WA, McShane H, and Fletcher HA. 2014. Inflammatory and myeloid-associated gene expression before and one day after infant vaccination with MVA85A correlates with induction of a T cell response. BMC infectious diseases 14: 314. [DOI] [PMC free article] [PubMed] [Google Scholar]
- 66.Bucasas KL, Franco LM, Shaw CA, Bray MS, Wells JM, Nino D, Arden N, Quarles JM, Couch RB, and Belmont JW. 2011. Early patterns of gene expression correlate with the humoral immune response to influenza vaccination in humans. The Journal of infectious diseases 203: 921–929. [DOI] [PMC free article] [PubMed] [Google Scholar]
- 67.Gotuzzo E, Yactayo S, and Cordova E. 2013. Efficacy and duration of immunity after yellow fever vaccination: systematic review on the need for a booster every 10 years. Am J Trop Med Hyg 89: 434–444. [DOI] [PMC free article] [PubMed] [Google Scholar]
- 68.Malek TR 2003. The main function of IL-2 is to promote the development of T regulatory cells. J Leukoc Biol 74: 961–965. [DOI] [PubMed] [Google Scholar]
- 69.Bonaldo MC, Caufour PS, Freire MS, and Galler R. 2000. The yellow fever 17D vaccine virus as a vector for the expression of foreign proteins: development of new live flavivirus vaccines. Memórias do Instituto Oswaldo Cruz 95: 215–223. [DOI] [PubMed] [Google Scholar]
Associated Data
This section collects any data citations, data availability statements, or supplementary materials included in this article.