

Abstract
A new experimental procedure to calculate all equilibrium constants of the multistate of species of anthocyanins and related compounds, including those in basic medium, is reported. The procedure is based on a series of pH jumps monitored by stopped flow from an extended pH range of solutions at pseudo-equilibrium (when there is no significant formation of trans-chalcones) or at equilibrium to pH = 1.0. The experimental procedure is described for the anthocyanin model compound 4′-hydroxyflavylium, which exhibits a peculiar behavior in moderately acidic medium, because the quinoidal base, hemiketal, and cis-chalcone have similar mole fractions at pseudo-equilibrium, permitting good discrimination among these species. The experimental procedure can be extended to the copigmentation phenomenon and allow the calculation of the 1:1 copigmentation constants of the flavylium cation, quinoidal base, hemiketal, and cis- and trans-chalcones (this last from the equilibrium) and their respective ionized forms. The method was applied to calculate the copigmentation constants of the model compound 4′-hydroxyflavylium as well as malvidin-3-glucoside with caffeine. In the last compound, the strongest interaction takes place with the quinoidal base (K = 303 M–1) and flavylium cation (K = 134 M–1) and, to a lesser extent, with the ionized quinoidal base (K = 43 M–1) and cis-chalcone (K = 17 M–1). The caffeine interaction with the hemiketal and the other ionized species is negligible.
1. Introduction
The wide range of colors in the plant kingdom (e.g., flowers, vegetable, and fruits) results from the great structural diversity of natural pigments and, in particular, anthocyanins.1,2 These water-soluble pigments are responsible for the red, blue, and violet colors in many plants and food products derived from them. In addition to the structural diversity, anthocyanins are present in aqueous solutions in a very complex network of equilibrium forms, with different colors, which are directly affected by several factors such as pH and also complexation with metals and other compounds (copigmentation phenomena).3−5Scheme 1 summarizes the different chemical species interconverted by means of pH changes (from here on designated as multistate) of malvidin-3-glucoside (oenin), the most abundant pigment in red Vitis vinifera grapes and wines.
Scheme 1. Multistate of Malvidin-3-Glucoside (Oenin).

At sufficiently acidic medium, flavylium cation, AH+, is the only stable species because the system converges to this species (see red arrows); k2 and k3 refer to the rate constants of the kinetic steps observed in moderately acidic solutions after direct pH jumps (see below). This complex system is reduced to a simple triprotic acid AH+ in equilibrium with the conjugate bases CB, ([A] + [B] + [Cc] + [Ct]), CB– ([A–] + [B–] + [Cc–] + [Ct–]), and CB2– ([B2–] + [Cc2–] + [Ct2–]). At relatively high concentrations of [OH–], the di-ionized species are formed directly from the hydroxylation of A after a direct pH jump. The di-ionized species in common anthocyanins are not stable.
In spite of its complexity, the system can be dramatically simplified, and all equilibrium constants can be calculated. In this work, we report a mathematical approach and an experimental procedure that permits accomplishment of this objective.
At sufficiently acidic medium, the flavylium cation (AH+) is the sole observed species. The other components of the multistate appear at higher pH values. A convenient way to study the system is to carry out direct pH jumps, defined by the addition of a base to acidic solutions, generally at pH = 1.0, and reverse pH jumps that are performed by addition of an acid to equilibrated solutions at higher pH values. As the distribution of the multistate species is dependent on the pH, after the pH jump, the system is out of the new equilibrium, and the respective relaxation processes give crucial information that permits characterization of the multistate (Scheme 1). Most of the kinetic steps take place in the timescale of seconds and subseconds, and stopped flow is an indispensable tool to take into account for the study of anthocyanins and related compounds.
The sequence of reversible reactions in acidic medium reported in Scheme 1 from the first to the second row (from AH+ to CB) was firmly established after the work of Brouillard and Dubois,6,7 who made a breakthrough when they discovered that the quinoidal base (A) does not hydrate in acidic medium. Within other relevant contributions, McClelland and co-workers have rationalized the kinetics of the synthetic flavylium compounds in which the role played by trans-chalcone (Ct) in the multistate in particular was concerned.8,9 In a direct pH jump, the first species to be formed is A, a process that occurs during the mixing time of the stopped flow. The subsequent kinetic steps are much slower than proton transfer, and consequently AH+ and A behave as a single species. The faster observed kinetics is constituted by two reactions: hydration of the flavylium cation (in equilibrium with the quinoidal base) to give a hemiketal (B) followed by ring opening (tautomerization) that leads to cis-chalcone (Cc). In the pH range accessed by direct pH jumps, the hydration occurs in several minutes, while the tautomerization occurs in subseconds. This makes the hydration the rate-determining step of this kinetic step (k2 in Scheme 1). The system equilibrates through the slowest cis—trans isomerization to give trans-chalcone (k3 in Scheme 1). The pseudo-equilibrium is defined by the transient state where all species are in equilibrium before significant formation of Ct; see Scheme 1. The existence of the pseudo-equilibrium presupposes that the isomerization is always the slowest step of the multistate including the case of the ionized species. In some other flavylium-based multistates, the cis—trans isomerization is not the slowest kinetic step, and different mathematical expressions to account for the respective kinetic steps have been reported.10
In spite of the fact that most of the studies regarding anthocyanins have been carried out in acidic medium (because common anthocyanins are not stable in basic medium), there are many and interesting exceptions, for example, the morning glory anthocyanin,11−13 oaklins,14 pyranoanthocyanins, and their respective derivatives15 as well as many synthetic flavylium compounds,16 which imply the extension of the experimental work to basic medium. In some flavylium-based multistates, it was reported that after a direct pH jump in basic medium, there is hydroxylation of the quinoidal base that leads directly to the mono- and di-ionized species without passing through the flavylium cation.10
In this work, we profited from the recent rationalization of a simple experimental procedure that allows the determination of the mole fraction distribution of the anthocyanin multistate of species.17 The new experimental approach and the respective mathematical model here developed were applied to 4′-hydroxyflavylium and malvidin-3-glucoside (oenin). The former was chosen because it is very stable even in more basic medium and possesses at moderately acidic pH values similar mole fractions of the quinoidal base and cis- and trans-chalcones, an ideal situation to check the discrimination capacity of the model.
The approach is based on a set of reverse pH jumps followed by stopped flow. Reverse pH jumps were previously used but only recently in a more systematic way.8,17 In the appendixes in the Supporting Information, the straightforward deduction of the mathematical expressions used through this work is presented. The procedure was extended to the copigmentation phenomenon in the presence of caffeine. Caffeine was chosen as a copigment model because it is a natural compound, exhibiting the same chemical structure in a wide range of pH values, and has been described by many authors as having a high affinity for complexing with anthocyanins.3,18
2. Results and Discussion
The experimental procedure was applied to the compound 4′-hydroxyflavylium and subsequently to the anthocyanin oenin in the presence and absence of caffeine as a copigment.
The equilibrium of 4′-hydroxyflavylium in acidic medium takes a long time to be reached,19 and the species quinoidal base, hemiketal, and cis-chalcone have similar mole fraction distributions at pseudo-equilibrium, an ideal situation to test the model response to the copigmentation with different species of the multistate.
2.1. 4′-Hydroxyflavylium in the Absence of Copigment
The species observed in the case of 4′-hydroxyflavylium are represented in Scheme 2.
Scheme 2. Multistate of Species of the Anthocyanin Model Compound 4′-Hydroxyflavylium.

The set of equilibrium equations regarding the pseudo-equilibrium in the case of 4′-hydroxyfflavylium is described from eqs 1–15.
2.1.1. First Global Acid–Base at Pseudo-Equilibrium
This is the equilibrium between the first and second rows in Scheme 2.
 |
This set of equations can be simplified considering a global equilibrium involving AH+ and its apparent conjugate base CB^, eqs 4 and 5 (see Supporting Information).
| 4 |
| 5 |
Equations 1–3 can be described by a single acid–base equilibrium, eq 4, with acidity constant Ka^.
2.1.2. Second Global Acid–Base Pseudo-Equilibrium
This equilibrium considers the second and third rows in Scheme 2.
When the pH reaches neutral to moderately basic values, the neutral species can deprotonate, Scheme 2 and eqs 6 and 7. These acid–base processes can be also simplified considering a second global deprotonation step according to eqs 8 and 9.
 |
| 10 |
2.1.3. Third Global Acid–Base Pseudo-Equilibrium
This equilibrium concerns the third and fourth rows in Scheme 2.
At very basic pH values, a second deprotonation occurs, eqs 11 and 12
and the system is simplified by eqs 13 and 14
| 13 |
| 14 |
with
| 15 |
The complete deduction of these equilibrium constants is shown in Appendix 1 in the Supporting Information.
Summarizing, the complex system reported in Scheme 2 (identical to Scheme 1) and described through eqs 1–15 is reduced to a single triprotic acid
 |
This is a dramatic simplification of the complex systems of anthocyanins and related compounds. The following mathematical treatment is based on this interesting property of the anthocyanin multistate.
The pH-dependent absorption spectra of the model compound 4′-hydroxyflavylium at pseudo-equilibrium are shown in Figure 1a. Representation of the absorbance as a function of pH shows three inflection points corresponding to the equilibrium constants of eq 4a, 8a, and 13a, (Ka^, Ka, and Ka^^^); see inset of Figure 1a. The mole fraction distribution of the species that constitute this single triprotic acid, the species AH+, CB^, CB^–, and CB^2– (Figure 1b), can now be obtained from eqs 16 and 17; see Appendix 1 in the Supporting Information for the respective deduction.
| 16 |
| 17 |
Figure 1.

(a) Spectral variations of the compound 4′-hydroxyflavylium (2 × 10⁻⁵ M)at pseudo-equilibrium in water extended to all pH range. Inset: fitting was achieved for pKa^ = 4.4, pKa = 8.6, and pKa^^^ = 9.5; absorption spectrum of the flavylium cation, pH = 1 (red); absorption spectrum of the quinoidal base, hemiketal, and cis-chalcone, pH = 6.2 (blue); absorption spectrum Cc2–, pH = 12 (green); the spectrum at pH = 9 is a mixture of Cc–, Cc2–, and A (not emphasized). (b) Mole fraction distribution of the species AH+, CB^, CB^–, and CB^2– at pseudo-equilibrium calculated from eqs 16 and 17. The precise contribution of each species to CB, CB^ and CB^^ can only be determined by reverse pH jumps; see below.
As shown in Appendix 1 in the Supporting Information, the mole fraction distribution of the 4′- hydroxyflavylium at pseudo-equilibrium can be described in terms of the respective equilibrium constants presented in eqs 1–15.
| 18 |
| 19 |
| 20 |
| 21 |
Inspection of the absorption spectra of Figure 1a (corroborated by the mole fractions of Figure 1b) shows the characteristic absorption spectrum of the flavylium cation (red line) at very acidic pH values. Around pH = 6, the quinoidal base is in equilibrium with the hemiketal and cis-chalcone ([CB^] = [A] + [B] + [Cc]), (blue line). At pH = 12 (green line), the absorption is basically due to Ct2– and a very small contribution of B2–, ([CB^2–] = [Cc2–] + [B2–]). At pH = 9, the absorption is due to the species that constitute CB^–, ([CB^–] = [B–] + [Cc–]) with contributions from the neutral and di-ionized species (Figure 1b). The precise contribution of each species to CB, CB^–, and CB^2– can only be achieved by the reverse pH jumps; see below.
2.1.4. Reverse pH Jumps from the Pseudo-equilibrium
The experimental procedure that permits the calculation of all equilibrium constants is based on the reverse pH jumps followed by stopped flow from pseudo-equilibrium and also from equilibrium; see below. The set of solutions used to obtain the spectra in Figure 1 (at pseudo-equilibrium) was reverted to the flavylium cation at pH ≈ 1.
Two examples of the traces obtained at two different pH values are shown in Figure 2. At pH = 6.45, the pseudo-equilibrium is basically established between the species A, B, and Cc. At pH = 8.86, there is a mixture of the mono-ionized species (B– and Cc–) with contributions of the neutral species and also a small one from the di-ionized B2– and Cc2–. When the reverse pH jump is carried out, the ionized species are immediately transformed into their respective neutral forms (during the mixing time of the stopped flow), but their relative ratio is a function of the mole fraction of the species at the starting pH of the jump. The traces should be taken at a wavelength where the flavylium cation is the sole absorption species, which is easy to accomplish because the flavylium cation absorption band (450 nm) is red-shifted in comparison with the other species.a Independent of the initial pH of the reverse pH jump, the first absorption refers to the quinoidal bases (in this case, just one) that are transformed into the flavylium cation during the mixing of the stopped flow as well as the contribution from the flavylium cation present previously in the jump at starting pH values that are more acidic (Figure 1b). The system evolves to the complete conversion into the flavylium cation by two kinetic steps: (i) the faster is the conversion of the hemiketal speciesb and (ii) the conversion of Cc species via B (Figure 2).8 Taking this data into account, it is possible to decompose the species CB^, CB^–, and CB^2– in terms of the quinoidal base, hemiketal, and cis-chalcone components according to eqs 22–25 (Appendix 1 in the Supporting Information).
| 22 |
| 23 |
| 24 |
| 25 |
with D as defined in eq 25 and the mole fractions given by the coefficients a0 + b0 + c0 = 1, b1 + c1 = 1, and b2 + c2 = 1 because the amplitude of the traces should be normalized. The coefficients an, bn, and cn are the normalized amplitudes of the quinoidal base (and its ionized species), hemiketal (and its ionized species), and cis-chalcone (and its ionized species), respectively. When normalized, they are coincident with the mole fraction of the respective species.
Figure 2.

(a) Reverse pH jump from pH = 6.45 to pH = 1 and (b) the same from pH = 8.86. The amplitudes of the traces should be normalized in order to have A + B + C = 1 and A + (B + B–) + (Cc + Cc–) = 1.
The key step of the procedure reported in this work is that the mole fraction distributions can be described by two different sets of equations: (i) in terms of the equilibrium constants, eqs 18–21 and (ii) in terms of the mole fractions obtained through the reverse pH jumps, eqs 22–24.
Considering that the term D is the same in both representations, comparing eqs 18 and 19 with eq 22
| 26 |
| 27 |
| 28 |
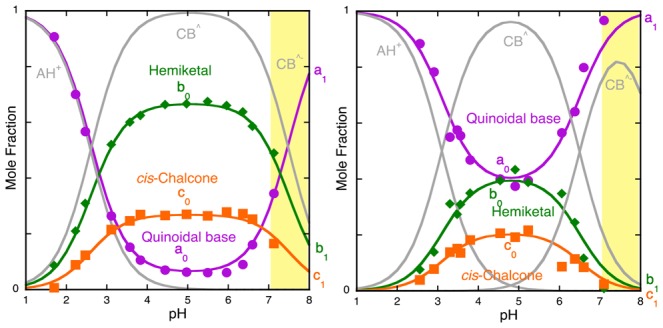
In Figure 3, the fitting with eq 16 (for AH+, CB^, CB^–, and CB^2–) and eq 22 to eq 24 is shown. This procedure permits achievement of the mole fractions of all species. The fitting was achieved for the flavylium cation plus the quinoidal base, hemiketal, cis-chalcone, and respective mono- and di-ionized species for a0 = 0.36, b0 = 0.34, b1 = 0.15, b2 = 0.08, c0 = 0.3, c1 = 0.85, and c2 = 0.92.
Figure 3.
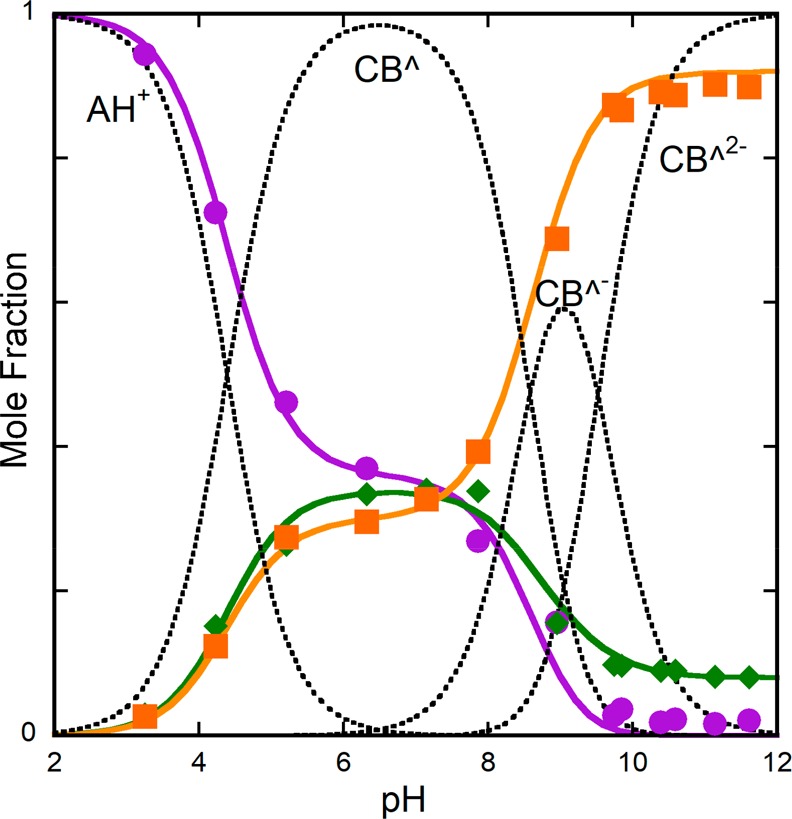
Representation of the mole fraction distribution of 4-hydroxyflavylium species at pseudo-equilibrium; flavylium cation plus quinoidal base (violet), hemiketal and ionized hemiketal (green), and cis-chalcone and its mono and di-ionized species (orange). Fitting was achieved with eqs 22–24 for the following parameters: a0 = 0.36, b0 = 0.34, b1 = 0.15, b2 = 0.08, c0 = 0.3, c1 = 0.85, c2 = 0.92.
According to eqs 26–28, once the equilibrium constants Ka^, Ka, and Ka^^^ (obtained from Figure 1 and in accordance with the fitting of Figure 3) and the coefficients an, bn, and cn are calculated, all equilibrium constants of 4′-hydroxyflavylium as shown in Scheme 2 can be calculated (Table 1).
Table 1. Equilibrium Constants of 4′-Hydroxyflavylium (2.0 × 10⁻⁵ M)a.
| pKa′ | pKa″ | pKa‴ | pKa^ | pKa^^ | pKa^^^ | pKa | Kh (M) | Kt | Ki | pKB/B– | pKB–/B2– | pKCc/Cc– | pKCc–/Cc2– | pKCt/Ct– | pKCt–/Ct2– |
|---|---|---|---|---|---|---|---|---|---|---|---|---|---|---|---|
| 3.3b | 8.1 | 9.25 | 4.4 | 8.6 | 9.5 | 4.8 | 1.4 × 10⁻⁵ | 0.88 | 37b | 8.95 | 9.8 | 8.1 | 9.5 | 8.1 | 9.5 |
Estimated error 10%.
Approximated values.
Verification of the goodness of the data can be done by recalculating the global equilibrium constants Ka^, Ka, and Ka^^^ from eqs 4, 10, and 15, respectively, using the data from Table 1.
The data from the reverse pH jumps followed by stopped flow are equally valid if some trans-chalcone was already formed because the only effect is to reduce the amplitudes of the reverse pH jumps but not their normalized values. At very basic pH values, the plateau is achieved between an equilibrium involving Cc2– (major) and B2–(minor). The formation of this last species is only explained by deprotonation of the OH group in position 2.
2.1.5. The Equilibrium
The equilibrium is treated as in the case of the pseudo-equilibrium by adding the contribution of the trans-chalcones.
| 29 |
| 30 |
| 31 |
The system at the equilibrium is again equivalent to a triprotic acid with the species AH+, CB, CB–, and CB2–, eqs 32–39.
| 32 |
| 33 |
| 34 |
| 35 |
| 36 |
| 37 |
| 38 |
| 39 |
The mole fraction distribution of trans-chalcone and its ionized species can be written as eq 40
| 40 |
| 41 |
Similar to the pseudo-equilibrium, the mole fractions of the species AH+, CB, CB–, and CB2– are given by eqs 42 and 43
| 42 |
| 43 |
The fact that the equilibrium in the case of the compound 4′-hydroxyflavylium is extremely slow was previously reported.9,20 However, the prediction that could take years was re-evaluated since the observation is that the cis—trans isomerization is catalyzed in extremely acidic values.20 In Figure 4, the mole fraction distribution of the species at the equilibrium is shown.
Figure 4.

(a) Equilibrium absorption spectra of the compound 4′-hydroxyflavylium (2 × 10⁻⁵ M) at representative pH values: pH = 1, flavylium cation (red); pH = 5, trans-chalcone (blue); pH = 9, mono-ionized trans-chalcone with contributions of the neutral and di-ionized analogues (orange); pH = 12, di-ionized trans-chalcone (green line). (b) Mole fraction of the trans-chalcones, eq 51, is represented by the green line, showing that the equilibrium is established between the flavylium cation and the trans-chalcones.
Due to the extremely slow cis—trans isomerization at pH ≈ 1, pKa′ = 3.3 is an estimation. For higher pH values, the equilibrium is reached in several days for pKa = 8.1 and pKa‴ = 9.25. The equilibrium constants regarding trans-chalcones are now calculated by comparison of the data from the equilibrium and pseudo-equilibrium, eq 44; the value of Ki is obtained, eq 45.
| 44 |
Rearranging eq 44 and substituting the values from Table 1
| 45 |
Rearranging eq 36 and substituting the respective values from Table 1
| 46 |
| 47 |
The mole fraction distribution of the species at equilibrium is given by eqs 48–51
| 48 |
| 49 |
| 50 |
| 51 |
The mole fraction distributions of the species Ct, Ct–, and Ct2– given by eq 51 are represented in Figure 4b (green lines). The equilibrium is basically established between the flavylium cation and the trans-chalcones. This precludes in this compound the use of reverse pH jumps from the equilibrium to calculate any other species except trans-chalcones, an alternative when the trans-chalcones are not the sole species of CB, CB–, and CB2–.
2.2. Application of the Reverse pH Jumps to the Copigmentation: 4′-Hydroxyflavylium in the Presence of Caffeine
The pH-dependent absorption spectra of the compound 4′-hydroxyflavylium (1.8 × 10⁻⁵ M) in the presence of caffeine (0.058 M) at pseudo-equilibrium are shown in Figure 5. The spectral variations are compatible with an equilibrium between AH+, CB^, CB^–, and CB^2– and their complexes with caffeine with pKa(CP)^ = 4.1, pKa(CP) = 8.8, and pKa(CP)^^^ = 9.1 (Figure 5b).
Figure 5.

(a) Spectral variations of the compound 4′-hydroxyflavylium (1.8 × 10⁻⁵ M) at pseudo-equilibrium in the presence of caffeine (0.058 M) extended to the entire pH range. Absorption spectrum of the flavylium cation, pH = 1 (red); absorption spectrum of CB^ (the quinoidal base component is clearly visible), pH = 6.2 (blue); absorption spectrum of CB^2– (essentially Cc2–), pH = 12 (green); the spectrum at pH = 9 is a mixture of CB^ and CB^2– (not emphasized); inset: fitting of the absorbance at two representative wavelengths was achieved for pKa(CP)^ = 4.0, pKa(CP) = 8.8, and pKa(CP)^^^ = 9.1. (b) Mole fraction distribution of the species AH+, CB^, CB^–, and CB^2– at pseudo-equilibrium calculated from eqs 16– 20.
The absorption spectra of Figure 5 are similar to those of Figure 1, but the absorption of the quinoidal base (blue color) is clearly higher.
The same procedure used to calculate the equilibrium constants in the absence of a copigment was used in the presence of caffeine. When the reverse pH jump followed by stopped flow back to pH ≤ 1 takes place from the pseudo-equilibrium, the initial amplitude is given by the transformation of A (and its ionized species) and the respective complexes with caffeine into AH+ and its caffeine complex (AH+–Caffeine). At lower pH values, the flavylium cation and its complex with caffeine prior to the equilibrium also contribute to the initial absorbance of the reverse pH jumps. The approximation requires that the complexation with all species is labile enough to permit the rearrangement (formation of AH+ and its complex with caffeine) during the mixing time of the stopped flow.c The second step is the formation of more flavylium and its respective complex from the hemiketal and its complex, and finally, in a slower process, cis-chalcone and its complexes give more flavylium cations (and its complex). Representation of the three amplitudes of the reverse pH jumps in the presence of caffeine is shown in Figure 6, and the respective equilibrium constants are shown in Table 2.
Figure 6.
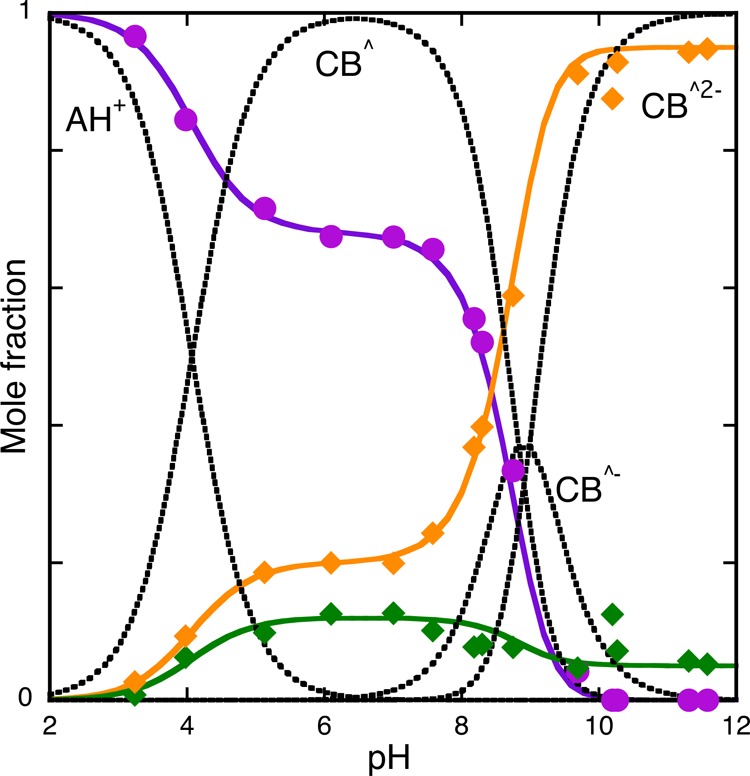
Representation of the mole fraction distribution of 4′-hydroxyflavylium species at pseudo-equilibrium in the presence of caffeine (0.058 M): flavylium cation plus quinoidal base (violet), hemiketal and ionized hemiketal (green), and cis-chalcone and its mono- and di-ionized species (orange). Fitting was achieved respectively with eqs 22–24 for the following parameters: a0 = 0.68, b0 = 0.12, b1 = 0.07, b2 = 0.05, c0 = 0.2, c1 = 0.93, c2 = 0.95.
Table 2. Equilibrium Constants of the Model Compound 4′-Hydroxyflavylium (1.8 × 10⁻⁵ M) in the Presence of Caffeine (0.058 M)a.
| pKa(CP)′ | pKa(CP)″ | pKa(CP)‴ | pKa(CP)^ | pKa(CP)^^ | pKa(CP)^^^ | pKa | Kh(CP) (M) | Kt(CP) | Ki(CP) | pKBCP/BCP– | pKCcCP/CcCP– |
|---|---|---|---|---|---|---|---|---|---|---|---|
| 3.15b | 7.8 | 10.2 | 4.0 | 8.8 | 9.1 | 4.2 | 1.2 × 10⁻⁵ | 1.66 | 37b | 9.1 | 8.1 |
Estimated error 10%.
Estimated value.
Comparing Figure 3 and Figure 6, the preferential interaction of the quinoidal base (violet color) with caffeine is clearly visualized.
2.3. New Experimental Procedure Based on Reverse pH Jumps To Calculate All Copigmentation Constants
The anthocyanin copigmentation has been extensively studied, and mathematical models to account for this phenomenon have been reported.21−24 The copigmentation with a flavylium cation can be straightforwardly studied at pH ≤ 1 because it is the only species in solution. However, when higher pH values are used, the system becomes very complex due to the existence of more species in competition. A copigmentation model that considers the interaction with the flavylium cation and quinoidal base was published,19 but extension of this model to copigmentation with more species is not possible due to the number of variables to be fitted.
Here, we describe an alternative based on the reverse pH jumps from the pseudo-equilibrium that permits the calculation of the total fraction of flavylium cations (and its complexes including those of high stoichiometry), and the same was done for the quinoidal base, hemiketal, and cis-chalcone. In the case of the trans-chalcone, the measurements should be made at equilibrium. We restricted the calculations of the copigmentation with the flavylium cation and the neutral (CB^) and the mono-ionized species (CB^–) because it is the interesting pH range in the case of anthocyanins. Moreover, the calculations were made for 1:1 complexation. The interaction of the flavylium cation and trans-chalcone of 4′-hydroxyflavylium with caffeine fits the 1:1 requirement (see Figure 7), with the existence of isosbestic points. In the case of the interaction of the flavylium cation with caffeine, the system is not strictly 1:1 (Figure 10), but a good fitting with a 1:1 stoichiometry was obtained, and the respective constant equal to 134 M–1 can be considered a good approximation.
Figure 7.

(a) Spectral variations of the model compound 4′-hydroxyflavylium (1.8 × 10⁻⁵M) in the presence of added concentrations of the copigment caffeine at pH = 1.0; KAH+CP = 18 M–1. (b) Spectral variations of the trans-chalcone ( from model compound 4'-hydroxyflavylium ) in the presence of added concentrations of caffeine at pH = 6.0, KCtCP = 47 M–1. The spectral variations are compatible with a 1:1 complex.
Figure 10.

(a) Spectral variations of malvidin-3-glucoside (1.7 × 10⁻⁵) at pH = 1.0 as a function of caffeine addition; (b) fitting was achieved for a 1:1 stoichiometry (KAH+CP = 134 M–1)
Comparing the data from Figure 3 and Figure 6, the following equations can be deduced as shown in Appendix 2 in the Supporting Information
| 52 |
where a0(CP) and Ka(CP)^ are the mole faction distribution and global constant, respectively, as above in the presence of the copigment.
Substituting KAH+CP obtained at pH = 1 in eq 52 gives KACP since Ka was previously obtained in the absence of caffeine.
Regarding hemiketal species, the procedure is mutatis mutandis the same above
| 53 |
| 54 |
From eq 53 and the data of Table 1, KBCP is calculated. On the other hand, from eq 54 and Table 1, the acid base constant KBCP/BCP– is calculated as well as the copigmentation constant of the ionized species with the hemiketal (KB–CP) due to the relation shown in eq 55
| 55 |
Using an identical procedure for the cis-chalcone
| 56 |
| 57 |
| 58 |
In conclusion, if KAH+CP is known, the reverse pH jumps in the presence and absence of the copigment permit the calculation of all copigmentation constants of the system except those of trans-chalcone.
2.3.1. Copigmentation of 4′-Hydroxyflavylium with Caffeine at pH = 1.0 (Calculation of KAH+CP)
In order to apply the present procedure to the copigmentation of 4′-hydroxyflavylium with caffeine and get the respective copigmentation constant KAH+CP, the absorption spectra were collected after titration with different concentrations of caffeine at pH 1 (Figure 7). The respective association constant KAH+CP = 18 M–1 was calculated through the fitting of Af and KAH+CP by means of eq 59.d
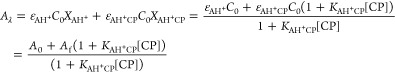 |
59 |
where A0 and Af are the initial and final absorbance, respectively. In this case, the final absorbance cannot be reached, limited by the caffeine solubility and the relatively small value of the copigmentation constant.
As shown above, the data from Figure 7 and eqs 52–58 allow the calculation of the copigmentation constants with A, B, and Cc (Table 3).
Table 3. Copigmentation Constants (M−1) of the Model Compound 4′-Hydroxyflavylium with Caffeinea.
| KAH+CP | KACP | KBCP | KB–CP | KCcCP | KCc–CP | KCtCP | KCt–CP |
|---|---|---|---|---|---|---|---|
| 18 | 134 | 13 | 9 | 42 | 44 | 47 | 94 |
Estimated error 10%.
2.3.2. Equilibrium of 4′-Hydroxyflavylium in the Presence of Caffeine
The equilibrium absorption spectra at representative pH values, together with the respective mole fraction distribution of the species AH+, CB, CB–, and CB2–, are shown in Figure 8. Three inflection points when the absorbance is represented as a function of pH give the equilibrium constants pKa′ = 3.15, pKa = 7.8, and pKa‴ = 10.2. When Figure 8 is compared with Figure 4, it is clear that in the absence of caffeine, CB is basically equal to Ct and in the presence of caffeine, there is a significant fraction of the quinoidal base (A). This permits us to conclude that A possesses a copigmentation constant strong enough to shift the equilibrium from Ct to A.
Figure 8.

(a) Equilibrium absorption spectra of 4′-hydroxyflavylium (1.8 × 10⁻⁵ M) in the presence of caffeine (0.058 M) at representative pH values: pH = 1, flavylium cation (red); pH = 5.6, CB (blue); pH = 9.3, CB–, with contributions of CB and CB2– (orange); pH = 12, di-ionized trans-chalcone (green line). (b) Mole fraction of the trans-chalcones, eq 51, is represented by the green line, showing that the equilibrium is established between the flavylium cation and the trans-chalcones. pKa′ = 3.15, pKa = 7.8, and pKa‴ = 10.2.
The generalization to the equilibrium (adding the terms that correspond to Ct) is straightforward.
| 60 |
and
| 61 |
| 62 |
Considering that K(CP)′ is an experimental value, the parameter Ka(CP) is obtained because KAH+CP was previously calculated in Figure 7a. On the other hand, eq 62 permits calculation of KCtCP (Table 3).
2.3.3. Application to Malvidin-3-Glucoside (Oenin)
The model established before for 4′-hydroxyflavylium was applied to an abundant natural anthocyanin, malvidin-3-glucoside (oenin).
We observed that in the pH range ∼7 < pH < 9, the hydration becomes slower than isomerization, and the kinetics upon a direct pH jump to this range is monoexponential (hydration control). Such an effect was previously reported for cyanidin-3-glucoside.18 Moreover, for pH > 7, the equilibrium cannot be well defined because some decomposition takes place, yellow band in Figure 9. In the direct pH jumps up to pH = 6, the kinetics is biexponential with the pH-independent slowest rate constant (isomerization) equal to 0.0004 s–1. The rate and equilibrium constants were determined following the established procedure,7,16 and the respective values are reported in Table 4. These values are in good agreement with those previously reported except for Kt. As reported previously,25 the measurement of Kt in the case of oenin and other monoglucosides has some uncertainty. The present value was obtained after 13 different measurements in the pH range of the neutral species.
Figure 9.

(a) Mole fraction distribution of malvidin-3-glucoside in the absence of the copigment obtained by reverse pH jumps from the pseudo-equilibrium. Fitting was achieved for a0 = 0.06, b0 = 0.67, and c0 = 0.27 for the neutral species and a1 = 1, b1 = 0, and c1 = 0. This last set of parameters regarding the ionized species is an estimation because of the slow decomposition processes. (b) Mole fraction distribution of malvidin-3-glucoside in the presence of caffeine (0.058 M). a0 = 0.42, b0 = 0.38, and c0 = 0.2 for the neutral species and a1 = 1, b1 = 0, and c1 = 0. For pH > 7, the pseudo-equilibrium and equilibrium are not well defined due to decomposition and the fact that hydration becomes slower than isomerization. Only for more basic pH values does the hydroxyl attack increase the rate of the hydration, but at these pH values, this anthocyanin is very unstable.
Table 4. Equilibrium Constants of Oenin (1.8 × 10⁻⁵ M) in the Presence and Absence of Caffeine (0.053 M)a.
| sample | pKa′ | pKa″ | pKa^ | pKa^^ | pKa | Kh (M) | Kt | Ki |
|---|---|---|---|---|---|---|---|---|
| oenin | 2.55b | 6.4 | 2.6 | 7.5 | 3.8 | 1.7 × 10⁻³ | 0.4 | 0.45b |
| OeninCaff | 3.0b | 6.4 | 3.1 | 6.4 | 3.5 | 3 × 10⁻⁴ | 0.5 | 1.5b |
Estimated error 10%.
Estimated value.
The interaction of anthocyanins with caffeine was previously reported in the literature.3,18,25,27,27 In Table 5, the respective constants in water are shown.
Table 5. Copigmentation Constants (M−1) of Oenin with Caffeinea.
| sample | KAH+CP | KACP | KBCP | KCcCP | KA–CP | KB–CP | KC–CP |
|---|---|---|---|---|---|---|---|
| OeninCaff | 134 | 303 | ∼0 | 17 | 43 | ∼0 | ∼0 |
| MalvinCaff26 | 125 | 180 | |||||
| Cyanidin 3GCaff18 | 161b | ||||||
| 21c |
Estimated error 10%. Caff = caffeine.
1:1 stoichiometry.
1:2 stoichiometry.
The mathematical procedure used throughout this work, similar to most of the copigmentation models widely used in the literature, is deduced for a 1:1 complexation. In particular, the copigmentation constant of malvin previously described25 (Table 5) was calculated with this 1:1 assumption. However, it is known from the literature that in anthocyanins, this requirement is not strictly observed.18,25 In the case of oenin, the titration of the flavylium cation at pH = 1 by addition of caffeine (Figure 10a) shows that the isosbestic point is not maintained. Nevertheless, a good fitting considering a 1:1 stoichiometry with a constant of 134 M–1 (Figure 10b) was achieved, and consequently this is a reasonable approximation to interpret in a semiquantitative perspective the effect of the caffeine copigmentation. Moreover, it allows the comparison with other copigmentation constants reported in the literature obtained within the same approximation. The present mathematical approach, just like the other models published, does not take into account the self-aggregation of the anthocyanin. However, this phenomenon is minimized by the low anthocyanin concentrations used throughout this work.e,16,28
According to Figure 8 and Table 5, the colored species of oenin are those interacting strongly with caffeine, and the greater copigmentation effect takes place with the quinoidal base, as was observed for 4′-hydroxyflavylium. The interaction of caffeine with the ionized species is negligible except for the ionized quinoidal base. Since in this pH range, there is no competition of the ionized quinoidal base for the interaction with caffeine, the complex of the ionized quinoidal base is the dominant species, and the color of the solution around neutrality is essentially blue.
3. Conclusions
The study of complex systems involving anthocyanins and related compounds has become very accessible through the experimental procedure reported in this work. Not only can all equilibrium constants of the anthocyanin multistate of species be measured, but also all copigmentation constants of the multistate are obtained when the experiments are made in the presence of a copigment and compared with those in its absence. This work confirms in a quantitative way that caffeine interacts preferentially with quinoidal bases and in particular has a negligible interaction with the hemiketal, which in most anthocyanins is the major species in moderately acidic medium.
These achievements are very important because they greatly contribute to better clarifying the color stability of the anthocyanin in aqueous solution and to understanding the physicochemical mechanisms behind the effects of copigmentation present in many natural systems that are responsible for the stabilization of color in the plants and foods derived from them such as jams, red fruit drinks, wines, and so on.
4. Materials and Methods
The flavylium compound 4′-hydroxyflavylium was synthesized as described in ref (9). Malvidin-3-glucoside (oenin) was extracted from young red wine (V. vinifera L. cv. Touriga Nacional) by semipreparative chromatography using a reversed-phase C18 column (250 mm 4.6 mm i.d.), as described elsewhere.29
Stock solutions of 4′-hydroxyflavylium (1.2 × 10⁻³ M) in 0.1 M HCl, malvidin-3-glucoside (1.2 × 10⁻³ M) in 0.1 M HCl, caffeine (0.1 M, Alfa Aesar Co. Ltd.) in Theorell and Stenhagen’s universal buffer (pH 7), and caffeine (0.1 M) in water were prepared. For the calculation of pKa^, pKa, and pKa values of the ionized forms, direct pH jumps kinetics were monitored after mixing the flavylium stock solution, NaOH to neutralize the amount of HCl added, buffer at desired pH (with and without caffeine), and water (or 0.1 M caffeine in water). Reverse pH jumps were performed, adding enough HCl (with or without caffeine) to equilibrated or pseudo-equilibrated solutions to reach pH = 1. pH was recorded on a Radiometer Copenhagen PHM240 pH/ion meter (Brønshøj, Denmark).
UV–vis spectra were recorded on a Varian-Cary 100 Bio or a 5000 spectrophotometer (Palo Alto, CA, USA). The reverse pH jumps from pseudo-equilibrium were monitored on an SX20 (Applied Photophysics; Surrey, UK) spectrometer equipped with a PDA.1/UV photodiode array detector. A filter of 435 nm was used to prevent the photochemical reactions that could take place from Cc or B.
Acknowledgments
This work was supported by the Associated Laboratory for Sustainable Chemistry – Clean Processes and Technologies – LAQV (FCT/MCTES fund UID/QUI/50006/ 2019) and the Portuguese Fundação para a Ciência e Tecnologia (grants PTDC/QUI-COL/32351/2017 and CEECIND/00466/2017 to N.B.). J.M. is grateful for a doctoral grant from CONACYT (MEX/ Ref. 288188).
Supporting Information Available
The Supporting Information is available free of charge on the ACS Publications website at DOI: 10.1021/acsomega.9b01066.
Detailed mathematical demonstrations of the equations used in this work (PDF)
The authors declare no competing financial interest.
Footnotes
The quinoidal base is even more red-shifted than the flavylium cation but protonates immediately to give this last one in the final pH values of the reverse pH jump.
At very acidic pH values, the hydration becomes faster than tautomerization (change of regime).
This is corroborated by NMR because only a single peak of each species and the respective complex with caffeine appears in accordance with a fast exchange rate.
The use of the Benesi–Hildebrand equation is another alternative.
In the case of NMR measurements, higher concentrations are usually needed.
Supplementary Material
References
- Castañeda-Ovando A.; de Pacheco-Hernández M.; Páez-Hernández M. E.; Rodríguez J. A.; Galán-Vidal C. A. Chemical studies of anthocyanins: A review. Food Chem. 2009, 113, 859–871. 10.1016/j.foodchem.2008.09.001. [DOI] [Google Scholar]
- Brooks S.-L.; Celli G. B. Eds., Anthocyanins from natural sources: Exploiting targeted delivery from improved health; Royal Society of Chemistry, CPI Group (UK) Ltd: Croydon, UK, 2019. [Google Scholar]
- Trouillas P.; Sancho-García J. C.; de Freitas V.; Gierschner J.; Otyepka M.; Dangles O. Stabilizing and Modulating Color by Copigmentation: Insights from Theory and Experiment. Chem. Rev. 2016, 116, 4937–4982. 10.1021/acs.chemrev.5b00507. [DOI] [PubMed] [Google Scholar]
- Yoshida K.; Mori M.; Kondo T. Blue flower color development by anthocyanins: from chemical structure to cell physiology. Nat. Prod. Rep. 2009, 26, 884–915. 10.1039/b800165k. [DOI] [PubMed] [Google Scholar]
- Silva V.O.; Freitas A. A.; Maçanita A.L.; Quina F. H. Chemistry and photochemistry of natural plant pigments: the anthocyanins. J. Phys. Org. Chem. 2016, 29, 594–599. 10.1002/poc.3534. [DOI] [Google Scholar]
- Brouillard R.; Dubois J.-E. Mechanism of the structural transformations of anthocyanins in acidic media. J. Am. Chem. Soc. 1977, 99, 1359–1364. 10.1021/ja00447a012. [DOI] [Google Scholar]
- Brouillard R.; Lang J. The hemiacetal–cis-chalcone equilibrium of malvin, a natural anthocyanin. Can. J. Chem. 1990, 755–761. 10.1139/v90-119. [DOI] [Google Scholar]
- McClelland R. A.; Gedge S. Hydration of the flavylium ion. J. Am. Chem. Soc. 1980, 102, 5838–5848. 10.1021/ja00538a024. [DOI] [Google Scholar]
- McClelland R. A.; McGall G. H. Hydration of the flavylium ion. 2. The ’4’-hydroxyflavylium ion. J. Org. Chem. 1982, 47, 3730–3736. 10.1021/jo00140a027. [DOI] [Google Scholar]
- Pina F., Thermodynamic and kinetic processes of anthocyanins and related compounds and their bio-inspired applications. In Recent Advances in Polyphenol Research. Romani A., Lattanzio V., Quideau S., Eds.;. Wiley: West Sussex, 2014, Vol. 4 pp 341−369. [Google Scholar]
- Yoshida K.; Kondo T.; Okazaki Y.; Katou K. Nature 1995, 373, 291. 10.1038/373291a0. [DOI] [Google Scholar]
- Goto T.; Kondo T. Structure and Molecular Stacking of Anthocyanins—Flower Color Variation. Angew. Chem., Int. Ed. Engl. 1991, 30, 17–33. 10.1002/anie.199100171. [DOI] [Google Scholar]
- Goto T.; Hoshino T.; Takase S. A Proposed Structure of Commelinin, a Sky-Blue Anthocyanin Complex Obtained from the Flower Petals of Commelina. Tetrahedron Lett. 1979, 20, 2905–2908. 10.1016/S0040-4039(01)86447-9. [DOI] [Google Scholar]
- Sousa A.; Petrov V.; Araújo P.; Mateus N.; Pina F.; de Freitas V. Thermodynamics, Kinetics, and Photochromism of Oaklins: A Recent Family of Deoxyanthocyanidins. J. Phys. Chem. B 2013, 117, 1901–1910. 10.1021/jp3110216. [DOI] [PubMed] [Google Scholar]
- Oliveira J.; Mateus N.; de Freitas V. Previous and recent advances in pyranoanthocyanins equilibria in aqueous solution. Dyes Pigm. 2014, 100, 190–200. 10.1016/j.dyepig.2013.09.009. [DOI] [Google Scholar]
- Pina F.; Melo M. J.; Laia C. A. T.; Parola A. J.; Lima J. C. Chemistry and Applications of Flavylium Compounds: a Handful of Colours. Chem. Soc. Rev. 2012, 41, 869–908. 10.1039/C1CS15126F. [DOI] [PubMed] [Google Scholar]
- Mendoza J.; Basílio N.; Pina F.; Kondo T.; Yoshida K. Rationalizing the Color in Heavenly Blue Anthocyanin. A Complete Kinetic and Thermodynamic Study. J. Phys. Chem. B 2018, 122, 4982–4992. 10.1021/acs.jpcb.8b01136. [DOI] [PubMed] [Google Scholar]
- Limón P. M.; Gavara R.; Pina F. Thermodynamics and kinetics of Cyanidin 3-glucoside and Caffeine co-pigments. J. Agric. Food Chem. 2013, 61, 5245–5251. 10.1021/jf4006643. [DOI] [PubMed] [Google Scholar]
- Petrov V.; Slavcheva S.; Stanimirov S.; Pina F. Origin of the Metastable Stability in Flavylium Multistate Systems. J. Phys. Chem. A 2015, 119, 2908–2918. 10.1021/acs.jpca.5b01473. [DOI] [PubMed] [Google Scholar]
- Pessêgo M.; Basílio N.; Mendoza J.; Avó J.; Cunha-Silva J.; Parola A. J.; Pina F. Exploring the Diethylaminoflavylium Derivatives Multistate system of Chemical Reactions in the presence of CTAB micelles: Thermodynamic Reversibility Achieved Through Different Kinetic Pathways. RSC Adv. 2017, 7, 30469–30480. 10.1039/C7RA04514J. [DOI] [Google Scholar]
- Asen S.; Stewart R. N.; Norris K. H. Anthocyanin, Flavonol Copigments, and pH Responsible for Larkspur Flower color. Phytochemistry 1975, 14, 2677–2682. 10.1016/0031-9422(75)85249-6. [DOI] [Google Scholar]
- Brouillard R.; Wigand M.C.; Dangles O.; Cheminat A. pH and solvent effects on the copigmentation reaction of malvin with polyphenols, Purine and pyrimidine derivatives. J. Chem. Soc., Perkin Trans. 2 1991, 2, 1235–1241. 10.1039/P29910001235. [DOI] [Google Scholar]
- Malien-Aubert C.; Dangles O.; Amiot M. J. Influence of procyanidins on the color stability of oenin solutions. J. Agric. Food Chem. 2002, 50, 3299–3305. 10.1021/jf011392b. [DOI] [PubMed] [Google Scholar]
- Dangles O.; Elhajji H. Synthesis of-3-methoxy-and-3-(β-D-glucopyranosyloxy) flavylium ions. Influence of the flavylium substitution pattern on the reactivity of anthocyanins in aqueous solution. Helv. Chim. Acta 1994, 77, 1595–1610. 10.1002/hlca.19940770616. [DOI] [Google Scholar]
- Pina F. Chemical applications of anthocyanins and related compounds. A source of bioinspiration. J. Agric. Food Chem. 2014, 62, 6885–6897. 10.1021/jf404869m. [DOI] [PubMed] [Google Scholar]
- Dangles O.; Brouillard R. Polyphenol interactions. The copigmentation case: thermodynamic data from temperature variation and relaxation kinetics. Medium effect. Can. J. Chem. 1992, 70, 2174–2189. 10.1139/v92-273. [DOI] [Google Scholar]
- Charlton A. J.; Davis A. L.; Jones D. P.; Lewis J. R.; Davies A. P.; Haslam E.; Williamson M. P. The Self-Association of the Black Tea Polyphenol Theaflavin and Its Complexation with Caffeine. J. Chem. Soc., Perkin Trans. 2 2000, 2, 317–322. 10.1039/A906380C. [DOI] [Google Scholar]
- Houbiers C.; Lima J.C.; Maçanita A.L.; Santos H. Color stabilization of Malvidin 3-Glucoside: Self-Aggregation of the flavylium cation and Copigmentation with the Z-Chalcone Form. J. Phys. Chem. B 1998, 102, 3578–3585. 10.1021/jp972320j. [DOI] [Google Scholar]
- Pissarra J.; Mateus N.; Rivas-gonzalo J.; Santos-Buelga C.; de Freitas V. Reaction between Malvidin 3-Glucoside and (+)-Catechin in model solutions containing different Aldehydes. J. Food Sci. 2003, 68, 476–481. 10.1111/j.1365-2621.2003.tb05697.x. [DOI] [Google Scholar]
Associated Data
This section collects any data citations, data availability statements, or supplementary materials included in this article.