Abstract
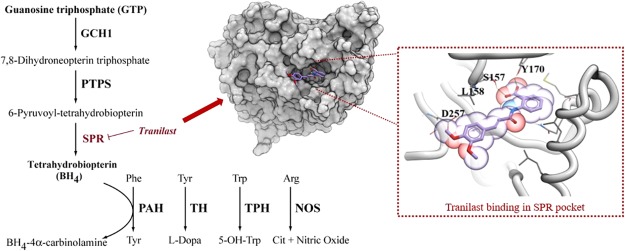
Tetrahydrobiopterin (BH4) is a cofactor in the production of various signaling molecules including nitric oxide, dopamine, adrenaline, and noradrenaline. BH4 levels are critical for processes associated with cardiovascular function, inflammation, mood, pain, and neurotransmission. Increasing pieces of evidence suggest that BH4 is upregulated in chronic pain. Sepiapterin reductase (SPR) catalyzes both the reversible reduction of sepiapterin to dihydrobiopterin (BH2) and 6-pyruvoyl-tetrahydrobiopterin to BH4 within the BH4 pathway. Therefore, inhibition of SPR by small molecules can be used to control BH4 production and ultimately alleviate chronic pain. Here, we have used various in silico and in vitro experiments to show that tranilast, licensed for use in bronchial asthma, can inhibit sepiapterin reduction by SPR. Docking and molecular dynamics simulations suggest that tranilast can bind to human SPR (hSPR) at the same site as sepiapterin including S157, one of the catalytic triad residues of hSPR. Colorimetric assays revealed that tranilast was nearly twice as potent as the known hSPR inhibitor, N-acetyl serotonin. Tranilast was able to inhibit hSPR activity both intracellularly and extracellularly in live cells. Triple quad mass spectrophotometry of cell lysates showed a proportional decrease of BH4 in cells treated with tranilast. Our results suggest that tranilast can act as a potent hSPR inhibitor and therefore is a valid candidate for drug repurposing in the treatment of chronic pain.
Introduction
Chronic pain (CP) is a major problem worldwide, and can be a consequence of multiple factors including lifestyle, damage to the somatosensory system, compromised immune system, and complex disorders such as cancer and diabetes.1,2 CP can be severely debilitating, making it one of the leading causes of economic burden on society as a result of work days lost and an increased probability of early exit from the labor force.3−6 Recent epidemiological reports have estimated the prevalence of CP as 43, 39, 29, and 20% in the UK,7 Brazil,8 Hong Kong,9 and US10 populations, respectively. Treatment of CP is notoriously challenging, with patients’ lack of response to analgesics generally offering a poor outlook in long term pain relief. This forces a “trial and error” process in the pharmacological intervention of CP, with patients often developing tolerances to drugs over time.11 Classical analgesics like nonsteroidal anti-inflammatory drugs, selective serotonin reuptake inhibitors, and anticonvulsant drugs such as gabapentin have shown limited efficacy in the treatment of CP and therefore drugs like opioids are generally used.12−15 However, these drugs are strongly addictive in nature and can affect numerous off-target pathways causing severe side effects.11,13,16,17 The existence of comorbidities like depression, anxiety, and complex disorders can further complicate the management of CP.18 Therefore, effective treatment of CP remains an urgent unmet need in society. CP has multiple aetiologies that can significantly alter long-term nociceptive signaling in patients. While an array of risk factors and physiological processes driving the development of persistent pain have been revealed, identification of many CP-linked pathophysiological mechanisms remains incomplete.19−21 Because of the elusiveness in the origin of CP in individuals and its progression, CP has no specific validated target that can be explored for drug design.20,22 A wide range of potential targets have been explored for CP treatment including inflammatory molecules, ion-channels, microRNAs, and cell receptors.23−27
Genetic analyses have revealed an association between polymorphisms in the GCH1 gene, the rate-limiting enzyme in tetrahydrobiopterin (BH4) production, and the prevalence of CP.28−32 Elevated levels of BH4 corresponded with a higher sensitivity to pain stimuli in animal models of peripheral nerve injury.28 BH4 is a cofactor for the aromatic amino acid hydroxylases, alkylglycerol monooxygenase, and nitric oxide synthases, involved in the synthesis of many neurotransmitters including serotonin, dopamine, adrenaline, noradrenaline, and nitric oxide (Figure S1).33,34 Therefore, BH4 is a lucrative pathway for exploring drug design in CP and its linked comorbidities involved with these neurotransmitters.35 Several other molecules in the pathway including sepiapterin reductase (SPR) and GCH1 feedback-regulating protein, have also been linked to mood disorders and antidepressant functions.33,36,37 SPR is the terminal enzyme in the de novo synthesis of BH4.34 SPR catalyzes both the reversible reduction of sepiapterin to dihydrobiopterin (BH2), and 6-pyruvoyl-tetrahydrobiopterin to BH4 within the pathway.34 Modulation of BH4 levels by inhibiting SPR has been explored and many promising inhibitors of SPR have been developed.28,38,39 However, to the best of our knowledge no SPR inhibitor is currently used for CP treatment.
Tranilast (N-3′,4′-dimethoxycinnamoyl-anthranilic acid, Rizaben) is a synthetic analogue of a tryptophan metabolite, originally identified as an anti-allergic agent and used in the treatment of conditions such as bronchial asthma, keloids, atopic dermatitis, and allergic conjunctivitis.40 The mechanism of action of tranilast in clinical applications is thought to originate from its ability to inhibit the release of chemical mediators from mast cells, thus suppressing hypersensitivity reactions.41,42 Tranilast can potentially inhibit TGF-β1 signaling and matrix metalloproteinase secretion.43 Advantageous effects of tranilast have been recorded in a number of other disease states including multiple sclerosis,44 cardiovascular45 and autoimmune disorders,46,47 and various cancers43,48,49 due to its anti-inflammatory properties. It acts through a range of inhibitory pathways including a reduction in iNOS expression and enzyme activity in an inflammation cell model using microglia,44 lowering IL-6 secretion in endothelial cells,50 suppression of the pro-inflammatory COX2 in IL-1β stimulated fibroblasts51 and both TNF-α and IFN-γ production, while increasing anti-inflammatory IL-4 and IL-10 production.52 Despite its wide range of effects, the relevant anti-inflammatory mechanisms of tranilast are still not completely understood.
Current associations in the literature directly focusing on tranilast in the treatment of pain only reveal one study of the drug’s effects on pelvic pain caused by endometriosis, where 300 mg/day tranilast treatment over six months reduced the average numerical rating scale (NRS) of low back or lower abdominal pain from 6.25 to 3.63 by the end of the study administration.53 Here, we identify a previously unknown inhibitory role of tranilast on SPR activity thereby decreasing BH4 production. No previous publications or reports linking tranilast to either inhibition of the BH4 pathway or interaction with SPR have been identified.
Results
Tranilast Can Form Stable Interactions with human SPR at the Same Site as Sepiapterin
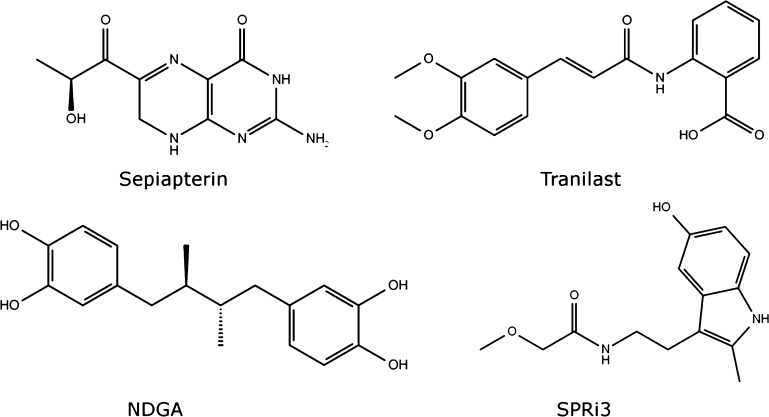
The molecular docking of all compounds in the LOPAC1280 library revealed sepiapterin as the best ligand for human SPR (hSPR) as it showed the lowest score (−52.09). The sepiapterin in the docked hSPR–sepiapterin complex and crystal structure of mouse SPR–sepiapterin showed a complete overlap which gave us confidence in our docking parameters (Figure 1). To filter potential compounds that can compete with sepiapterin binding, we selected compounds with binding scores less than −35 and screened their interactions to sepiapterin binding residues of hSPR (Table S1 and Figure S2). These compounds were then assessed by in vitro protein assays for their SPR inhibiting potential (Table S1). Tranilast, nordihydroguaiaretic acid (NDGA), and SPRi3 (Figure 2) all gave a good docking score (between −39 and −42) which indicated their SPR binding potential. The residues S157, Y170, G199, and D257 of SPR formed hydrogen bonds with sepiapterin. In the starting structure, tranilast could bind to residues S157, Y170, and D257 while NDGA and SPRi3 could only bind to residues Y170 and D257 on hSPR (Figure 3, Table S1).
Figure 1.
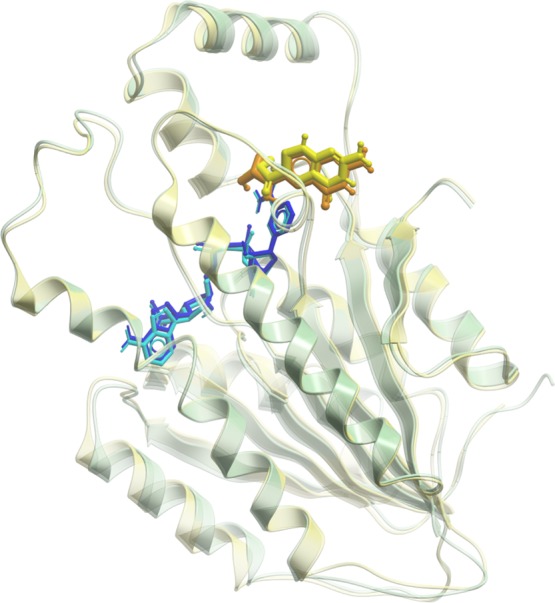
Overlay of mouse and hSPR. The mouse and hSPR are shown in transparent green and yellow cartoons, respectively. The NADPH bound to mouse and hSPR is shown in light and dark blue, while sepiapterin is shown in orange and yellow, respectively. The sepiapterin docked on hSPR overlapped over sepiapterin in the crystal structure of mouse SPR.
Figure 2.
Molecular structures of compounds used for carrying out MD simulations with hSPR. These include sepiapterin, tranilast, NDGA, and SPRi3. Sepiapterin is a product in the reduction of PPS in the de novo pathway and the substrate for hSPR in the salvage pathway (see Figure S1 for additional information). The sepiapterin–hSPR complex was used as the target site for in silico screening of the LOPAC1280 compound library that identified tranilast and NDGA as small molecule inhibitors of hSPR. SPRi3 is a synthetic derivate of NAS reported in the literature as a potent inhibitor of SPR.28
Figure 3.
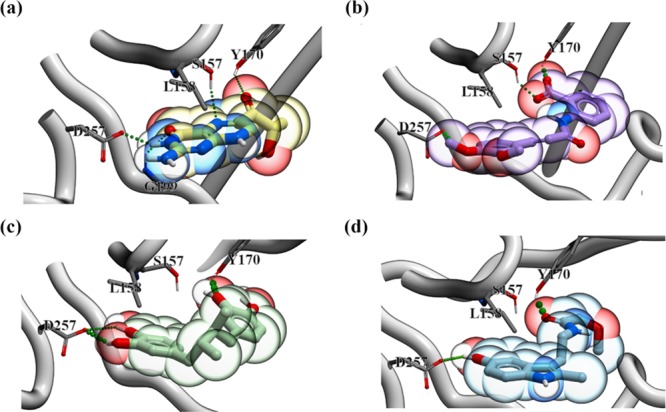
SPR–drug complexes obtained by docking. (a) hSPR–sepiapterin, (b) hSPR–tranilast, (c) hSPR–NDGA, and (d) hSPR–SPRi3 complexes are shown in the figure. The hydrogen bonds between hSPR and drugs are shown in green. The drugs are shown in the colored bubble (sepiapterin in yellow, tranilast in purple, NDGA in green, and SPRi3 in blue) with polar groups within the drug structure indicated (red = negative and blue = positive). hSPR is shown in cartoon. The residues of hSPR interacting with the drugs in Molsoft ICM visualization are labeled and shown in sticks.
We carried out 500 ns long simulations of sepiapterin, tranilast, NDGA, and SPRi3 complexed with hSPR to investigate the stability of their interactions. The lowest root mean squared deviation (RMSD) was observed in the hSPR simulations for the hSPR–tranilast complex in comparison to simulations of hSPR–sepiapterin, hSPR–NDGA, and hSPR–SPRi3 complexes (Figure 4a). The residues 55–59, 104–127, 160–169, and 204–230 showed a higher root mean squared fluctuation (RMSF) in all the hSPR–ligand simulations (Figure 4b). The hSPR in complex with sepiapterin and tranilast showed relatively similar RMSF values. The hSPR in hSPR–NDGA and hSPR–SPRi3 simulations showed higher RMSF values around residue 155–160, which also included S157 and L158 of the binding site. This indicated that binding site residues were more flexible in hSPR–NDGA and hSPR–SPRi3 compared to the hSPR–sepiapterin and hSPR–tranilast simulations.
Figure 4.
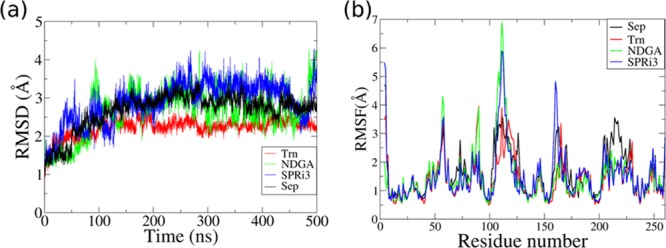
Comparison of hSPR behavior in simulations of hSPR–drug complexes. (a) RMSD and (b) RMSF plots were used to compare the deviations and fluctuations in the hSPR structure in the simulations of hSPR–sepiapterin (Sep), hSPR–tranilast (Trn), hSPR–NDGA, and hSPR–SPRi3 complexes. The hSPR–tranilast complex showed the lowest RMSD and least fluctuations in the 500 ns long MD simulation.
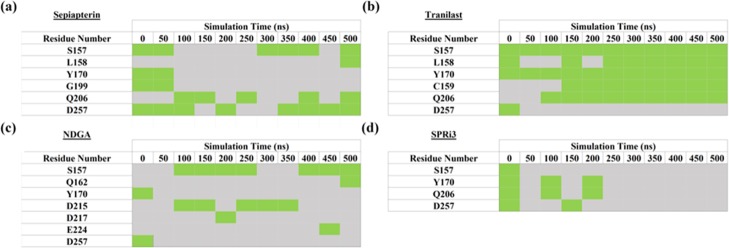
The stability of binding interactions between hSPR and ligands was also compared in the molecular dynamics (MD) simulations. In the starting structure, S157, Y170, G199, and D257 of hSPR formed hydrogen bonds with sepiapterin. Sepiapterin also formed a hydrogen bond with NADPH. The hydrogen bonds between hSPR D257(OD1)–sepiapterin(H54) and NADPH(H5N)–sepiapterin(O1) showed 80 and 76.6% occupancy in the hSPR–sepiapterin simulation (Figure S3a). This reflected that the position of sepiapterin was stable in the simulation as D257 and NADPH form the two opposite ends of the sepiapterin binding pocket. The hydrogen bonds between sepiapterin and S157 and Q206 residues of hSPR showed 50–60% occupancy. The interaction with Y170 was not sampled beyond 70 ns of the simulation as the loop formed by L161 to W167 was flexible in the simulation and changed the orientation of Y170 (Table 1a).
Table 1. Stability of (a) hSPR–Sepiapterin, (b) hSPR–Tranilast, (c) hSPR–NDGA, and (d) hSPR–SPRi3 Interactions throughout the 500 ns of the MD Simulationsa.
The green boxes indicate the presence of a hydrogen bond (bond strength >1 kcal/mol calculated in Molsoft). The grey boxes indicate no hydrogen bond of the hSPR residue with the drug.
In the starting structure, tranilast could bind to hSPR residues S157, Y170, and D257 (Table S1). The aromatic ring of tranilast stacked with the nicotinamide ring of NADPH after ∼80 ns of the simulations (Figure S4). All the interactions except with D257 were sampled for the majority of the 500 ns long simulation (Table 1b). The loop harboring D257 showed fluctuations and instead L158, C159, and Q206 formed hydrogen bonds with tranilast and anchored it in the simulation (Table 1b and Figure S3b). NDGA could bind to only Y170 and D257 of hSPR in the starting structure. Both these interactions were not stable in the simulations and instead S157 and D215 of hSPR formed hydrogen bonds with NDGA (Table 1c). As NDGA is a bigger molecule, it could not fully enter the binding site and therefore may not be an effective inhibitor of hSPR. In the starting structure, SPRi3 could bind to S157, Y170, Q206, and D257. However, none of these interactions were stable as the loops S157 to Y170 and the C-terminal loop harboring D257 were very flexible in the simulations (Table 1d).
Tranilast Can Decrease hSPR Activity in a Direct Protein Inhibition Assay
To determine inhibitor potency of compounds with a docking score below −35, pharmacological analysis of five-point dose response curves was performed for IC50 concentration determination (Table S1). Interactions of all these compounds with sepiapterin binding residues of hSPR were also screened after docking in Molsoft ICM (Table S1). Dose response curves for N-acetylserotonin (NAS), NDGA, and tranilast followed a classical sigmoidal inhibition profile. These were determined using the GraphPad Prism three-parameter nonlinear curve fits and revealed quantifiable average IC50 concentrations for NAS (11.61 μM), NDGA (8.26 μM), and tranilast (5.89 μM) (Figure 5).
Figure 5.
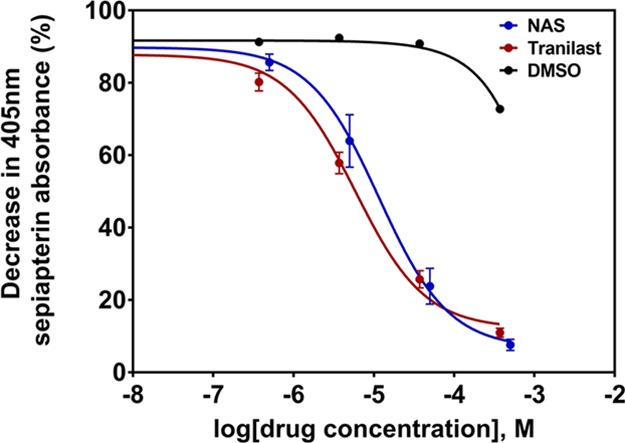
Five-point dose response curves for hSPR inhibition by tranilast and known inhibitor NAS, measured through 405 nm absorbance of sepiapterin breakdown. IC50 concentrations of both compounds were calculated using GraphPad Prism’s three-parameter nonlinear fit. Data is presented as mean ± SEM (n = 3).
Tranilast Can Decrease hSPR Activity in the Cellular System
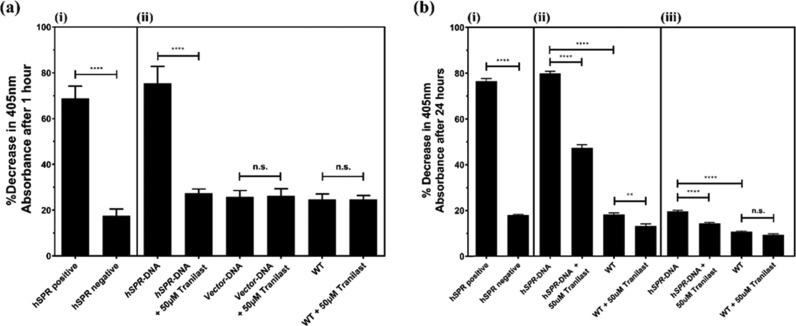
Enzymatic activity of hSPR was initially analyzed in lysates of SH-SY5Y cultures transfected with hSPR or empty vector. The activity was measured through the hSPR-induced breakdown of sepiapterin, quantifiable colorimetrically at 405 nm, to BH2. Tranilast treatment at 50 μM completely inhibited hSPR activity in transfected lysates, reducing hSPR activity equivalent to basal levels observed in nontransfected cells (p ≤ 0.0001). There were no significant differences as a result of 50 μM tranilast treatment between any wild-type (WT) or vector transfected samples (Figure 6a). Cell-free assay controls showed a significant hSPR-induced reduction in the sepiapterin colorimetric absorbance between controls containing or lacking recombinant hSPR protein (p ≤ 0.0001).
Figure 6.
Inhibitory properties of tranilast on hSPR-induced reduction of sepiapterin in (a) cell lysates of SH-SY5Y cultures transfected with hSPR or vector, extracted using freeze–thaw lysis, and (b) live cultures of SH-SY5Y cells transfected with hSPR or vector, along with extracellular hSPR in the media released from these SH-SY5Y cells. Panel (a) shows (i) cell-free positive controls with or without recombinant hSPR protein confirming hSPR enzyme activity in the assay system and (ii) lysates from SH-SY5Y cells transfected with hSPR showing significant inhibition in the presence of tranilast. There were no significant changes observed between vector transfected and WT cultures after tranilast treatment. In the panel (b), (i) cell-free positive controls with or without recombinant hSPR protein confirming hSPR enzyme activity, (ii) intracellular hSPR activity within both transfected and WT SH-SY5Y cultures showed significant inhibition in the presence of tranilast, and (iii) extracellular hSPR activity in culture media from transfected SH-SY5Y cells was significantly reduced after tranilast treatment. There were no significant changes observed in WT culture media in the presence of tranilast. Data is presented as mean ± SEM (n = 3), one-way ANOVA with the Tukey’s posthoc test was performed (** = p ≤ 0.01, **** = p ≤ 0.0001, n.s. = non-significant).
The inhibitory properties of tranilast at 50 μM on hSPR was then investigated intracellularly in live cultures of hSPR-transfected SH-SY5Y cells, and in released hSPR enzymes present within the cell media used to culture the transfected cells. Cell-free assay controls were consistent with previous experiments (Figure 6b). Transfected SH-SY5Y cells exhibited a significant increase in hSPR activity intracellularly compared to nontransfected cultures (p ≤ 0.0001); hSPR activity was also quantifiable at lower levels in nontransfected cells. In comparison to the initial assay using lysates of transfected SH-SY5Y cells, where a 50 μM treatment caused the complete inhibition in transfected samples, tranilast had a reduced effect in the intracellular assay, causing an approximate 52.7% decrease in mean absorbance change at 405 nm in transfected cells versus nontreated positive control (Figure 6b).
Low levels of hSPR activity were also quantified in the media used to culture the SH-SY5Y cells, with a significant increase in the sepiapterin breakdown observed in hSPR-transfected cells versus nontransfected cells. Tranilast treatment at 50 μM caused a decrease in the hSPR-induced sepiapterin absorbance reduction in media collected from transfected SH-SY5Y cultures but caused no significant effects in media from nontransfected cultures (Figure 6b).
Quantification of BH4 in Cell Lysates by Triple Quadrupole Mass Spectrometry
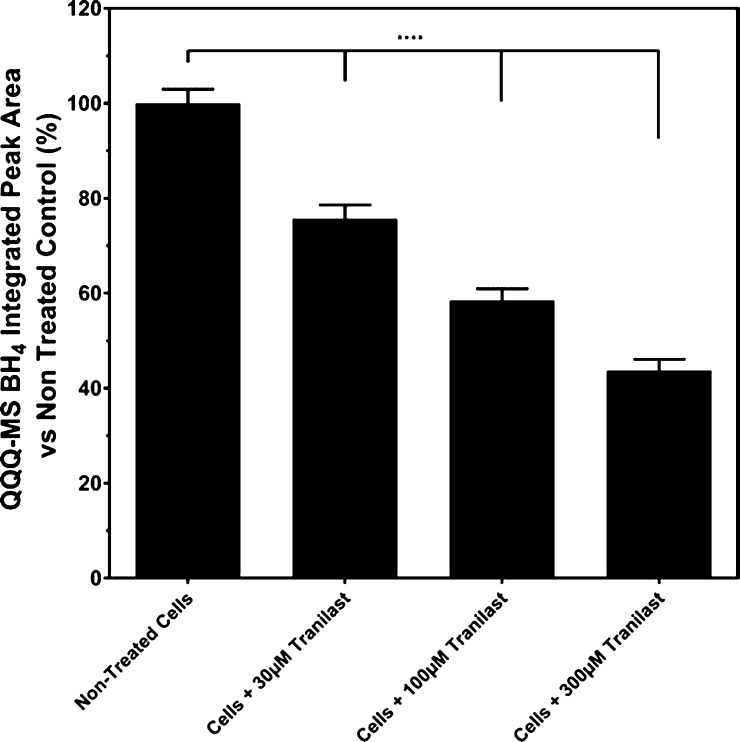
The BH4 levels in the SH-SY5Y cell lysates were measured using triple quadrupole mass spectrometry (QQQ-MS). Treatment with increasing concentrations of tranilast caused a significant incremental decrease in the sepiapterin-induced BH4 production intracellularly in SH-SY5Y cells (p ≤ 0.0001 for all concentrations versus untreated control, Figure 7). Tranilast treatment at 30 and 100 μM caused 24.3 and 41.5% reductions in the BH4 peak area integration, respectively, in comparison to untreated cells performed in the MassHunter software. A maximal mean percentage reduction in the quantified peak area integration of 56.3% was achieved at a tranilast concentration of 300 μM (Figure 7).
Figure 7.
Quantification of BH4 from QQQ-mass spectrophotometry peak areas obtained from tranilast-treated SH-SY5Y culture lysates. Data is presented as mean ± SEM (n = 3), one-way ANOVA with the Tukey’s posthoc test was performed (**** = p ≤ 0.0001).
Tranilast Has No Effect on Cellular Metabolism and Viability at the Tested Concentrations
Analysis was performed using both the CellTiter 96 non-radioactive cell proliferation assay and CellTiter-Glo luminescent cell viability assay (Figure S5) to identify whether tranilast exhibited any effects on SH-SY5Y cell metabolism or viability. No significant decrease in either cellular viability or cellular metabolism was observed at any concentration of tranilast after 24 h in comparison to the dimethyl sulfoxide (DMSO) vehicle control (p ≥ 0.05). There was no quantifiable difference in the assay readout after tranilast addition in cell free controls (variances observed here in comparison to vehicle controls are typically due to fluorescent, colored, or luminescent compounds).
Tranilast Had No Effect on Key Enzyme Protein Expressions after 24 h Treatment
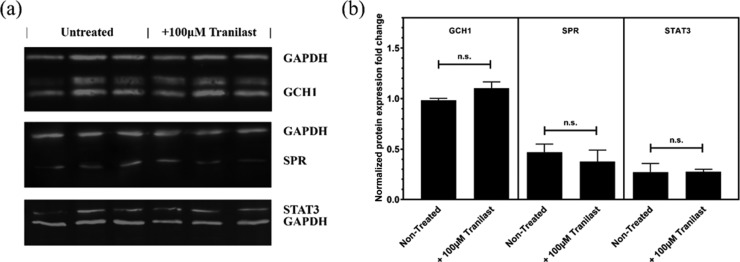
Gene expression analysis by quantitative real time polymerase chain reaction (qRT-PCR) run on 24 h tranilast-treated SH-SY5Y cells revealed a downregulation in SPR and an upregulation in both STAT1 and STAT3. The SPR mean expression decreased by 35.8%, while STAT1 and STAT3 increased by 90.3 and 64.3%, respectively (Figure S6). However, the western blot analysis of GCH1, SPR, or STAT3 intracellular protein revealed no significant expression change after 24 h treatment with tranilast (Figures 7 and 8).
Figure 8.
Expression analysis of proteins of interest in the BH4 pathway, quantified in the (a) western blot from the cell lysate extracted from SH-SY5Y cells, after 24 h treatment with 100 μM tranilast. (b) Data was normalized vs GAPDH. Three replicates of untreated and tranilast-treated protein extracts are shown in each gel. Full images of WB gels are available in Figure S7. Data is presented as mean ± SEM (n = 3), Student’s t-test between nontreated and treated samples was performed for each set of experiments.
Tranilast-Reduced Reactive Oxygen Species in Cytokine-Stimulated Cells
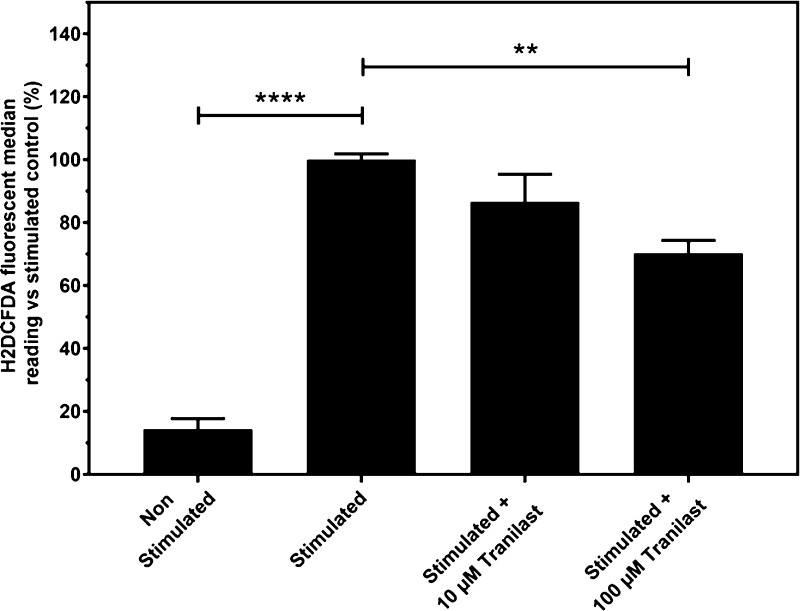
Stimulation of SH-SY5Y cultures with TNF-α and IFN-γ for 24 h caused a 6.97-fold increase in measured reactive oxygen species (ROS) using H2DCFDA fluorophore dye in flow cytometry quantification. Tranilast addition to the samples caused no significant anti-inflammatory properties at 10 μM, but a significant decrease in reduction of cytokine-induced ROS was observed at 100 μM treatment, reducing the average median fluorophore reading by 29.7% in comparison to untreated cytokine-stimulated controls (p ≤ 0.01, Figure 9).
Figure 9.
Flow cytometry measurement of SH-SY5Y under cytokine treatment with tranilast using the H2DCFDA fluorophore dye to quantify ROS. Data is presented as mean ± SEM; one-way ANOVA with the Tukey’s posthoc test was performed (n = 5, ** = p ≤ 0.01, **** = p ≤ 0.0001).
Discussion
BH4 is an essential molecule in various processes associated with cardiovascular function, mood, inflammation, pain, and neurotransmission.34 The homeostasis of BH4 is tightly regulated by the de novo, salvage, and recycling pathways.34 The de novo pathway is of interest in neuropathic pain research, as it is significantly amplified in response to hyperactive or damaged peripheral nociceptors. After axonal injury, BH4 concentrations increase in sensory neurons as a result of GCH1 upregulation, the rate-limiting enzyme in the de novo pathway.54 SPR is another key enzyme in the production of BH4 by both the de novo and salvage pathways.34 Inhibition of SPR has been shown to be effective in the reduction of CP and pain hypersensitivity, affiliated with an increased level of BH4.28,55 Inhibition of SPR has the benefit of no known associated neurological or cardiovascular side effects, with residual BH4 still available via the recycling pathway.28,56,57 Here, we demonstrate that tranilast can be used to control BH4 production by inhibiting the activity of SPR. Tranilast has been used as an anti-allergic drug since 1982 and is licensed for use in Japan and South Korea for treating bronchial asthma.40,58 However, to the best of our knowledge, the inhibitory activity of tranilast on SPR has not been explored previously.
Molecular modeling and MD simulations were used to screen suitable inhibitors for hSPR. The strategy identified compounds which could occupy the maximum available space in the binding site, so as to effectively compete with sepiapterin. The modeling studies showed a plausible binding model of tranilast. Similar to sepiapterin, the rigid planar structure of tranilast with ideally positioned heteroatoms facilitated the formation of hydrogen bonds with the key residues of hSPR. The initial docking results suggested that tranilast can use one of its ether-linked methyl groups to form a hydrogen bond to D257 (Figure 3b). However, this interaction was not stable in simulations, and instead Q206 formed a hydrogen bond with O1 on tranilast (Figure S3b). The ring harboring the carboxyl group on tranilast could stack with the nicotinamide moiety of NADPH (Figure S4). The carboxyl group of tranilast is deprotonated at a physiological pH as it has a pKa of 3.25.59 The oxygen within the carboxyl group of tranilast could form hydrogen bonds with S157 and Y170, two of the key interactions, as both S157 and Y170 form a part of the catalytic triad of hSPR.60 These interactions were mostly stable in the simulations (Figure S3b, Table 1b). The hydrogen bond formed between NDGA and NADPH was stable however the hydrogen bond with the binding site residues of hSPR, notably S157, was flexible in the simulation (Figure S3c). Similarly, the interactions between hSPR binding residues and SPRi3 were not stable in the simulations (Figure S3d). All these results suggested that tranilast could effectively block the interaction of sepiapterin with hSPR.
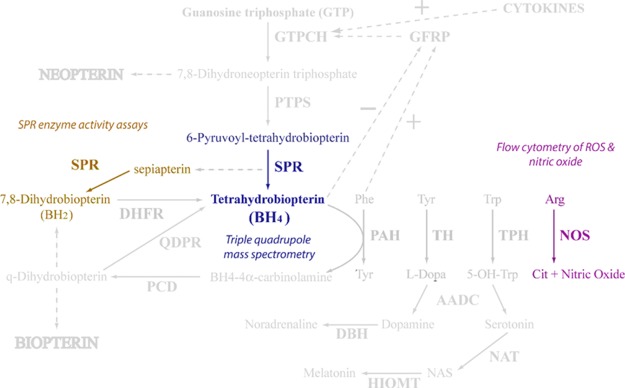
The inhibition of hSPR by tranilast was assessed by various techniques (Figure 10). Dose–response curves generated in hSPR–drug in vitro binding assays utilizing the colorimetric properties of sepiapterin revealed that tranilast was nearly twice as potent as the known inhibitor NAS (Figure 5). The potency of the drug was lower in the cellular assays performed (Figure 6), most likely due to the barrier of both tranilast and the assay reaction mix having to penetrate the cellular membrane prior to interacting with intracellular hSPR. It is noteworthy that the IC50 of tranilast calculated in the cellular assays was still lower than the 300 μM peak plasma concentrations that has been previously quantified after therapeutic dosages in patients.40,61 As a result of this, it is plausible to assume that therapeutic dosages may reach concentrations high enough to effectively inhibit SPR enzymatic activity in vivo. More recently, there have been studies into improving the bioavailability of tranilast further. The development of a crystalline form of tranilast significantly improved gastric dissolution from the oral intake by approximately 60-fold, and thus, higher peak concentrations were observed.62 QQQ-MS quantification of cell lysates revealed a tranilast-dependent significant reduction in quantifiable BH4 concentrations in vitro (Figure 7). This is consistent with the aforementioned cell-free colorimetric assays where tranilast inhibited sepiapterin reduction activity of hSPR (Figure 5).
Figure 10.
Tetrahydrobiopterin pathway, depicting key regions of SPR activity, and the various techniques performed to assess this under treatment with tranilast (figure amended from ref (33)).
A number of compounds have been tested for their potential hSPR inhibiting activity previously. These include derivatives of NAS28,63,64 like SPRi3, and sulfa drugs such as sulfasalazine.39 The efficacy of these inhibitors has been tested in various experimental set ups. In fluorescence resonance energy transfer (FRET)-based experiments, SPRi3 has shown a 25-fold higher binding affinity for hSPR compared to NAS (IC50 74 nM vs 1.9 μM for NAS).28 SPRi3 could efficiently reduce biopterin levels in a cell-based assay (IC50 5.2 μM vs 54 μM for NAS).28 However, SPRi3 has a relatively low potency and a short half-life, so a synthetic derivative of SPRi3, QM385, was developed. QM385 has shown promising results in animal studies, but no human trials have been reported yet.63 Treatment with QM385 in vitro resulted in a distinctly reduced proliferation of CD4+ T cells, while in vivo mice studies showed that 3 days of consecutive oral administration of QM385 greatly reduced the number of inflammatory T cells.86 These results are very similar to the antiproliferative effect seen in tranilast; it is possible many of tranilast’s reported therapeutic benefits seen in proliferative disorders are influenced by SPR inhibition as is apparent with QM385.63 In humans, tranilast has a half-life of approximately 5 h, and reaches a peak concentration in plasma of 30–300 μM, 2 h after oral administration (600 mg/day).61,65 It has been shown to be a relatively safe drug after years in clinical usage, presenting minimal long-term side effects and is generally well accepted by patients.42 The IC50 of QM385 quantified in FRET experiments was found to be 1.49 ± 1.66 nM.63 In a cellular activity assay, NAS- and sulfasalazine-inhibited hSPR with an IC50 of 3.1 μM and 23 nM, respectively.66 However, in our direct hSPR competing assay NAS and tranilast showed an IC50 of 11.61 and 5.89 μM, respectively.
High hSPR mRNA expression has been correlated significantly with poor survival prognosis in neuroblastoma patients.61 Inhibitory drugs of hSPR have also shown promising results in the treatment of various cancers. Sulfasalazine has shown antiproliferative effects in both neuroblastomal cell lines and mice xenografted by a MYCN-amplified neuroblastomal cell line.65 Recent work has shown that inhibition of BH4 by blocking hSPR using QM385 could be a viable way to abrogate pro-inflammatory auto-aggressive T cells in T-cell-driven pathological diseases.63 However, this work also suggested that stimulation of BH4 by overexpression of GCH1 could be a novel way to enhance antitumor immunity, as mice with intraperitoneal administration of BH4 experienced slower tumor growth.63 No tumor growth was observed in mice with overexpressed GCH1.63 Tranilast has been shown to reduce proliferation in various cancer models43,67−69 notably gastric tumours,49,70 breast cancer,71 prostate cancer,72 and lymphoid cancers.73 It has also shown anti-inflammatory effects by reducing production of cytokines such as TNF-α and IFN-γ.52 However, to the best of our knowledge, correlation between decreased cell proliferation and hSPR inhibition by tranilast has not been explored. In our experiments, tranilast significantly reduced ROS formation in pro-inflammatory conditions at 100 μM, simulated through cytokine treatment with TNF-α and IFN-γ (Figure 9). We suggest that this could be functioning through the blockage of the de novo formation of BH4, and thus reducing the capacity of BH4 to act as a redox active cofactor in NOS activity. In general, drugs targeting the central nervous system (CNS) have reduced molecular weights (MW) to facilitate passive lipid-mediated transport penetration of the blood–brain barrier (BBB); the mean MW value for the marketed CNS drug is 310.0, which rises up to 377.0 for the mean MW of all marketed orally active drugs.74,75 Tranilast’s MW of 327.3 falls close to this mean value. This has been shown in vivo, where tranilast was able to enter the CNS, penetrate the BBB, and be rapidly distributed and eliminated throughout the brain tissue.76 This suggests that tranilast would be able to access and interact with damaged sensory neurons and macrophages at the site of nerve damage.
Gene expression analysis of tranilast-treated SH-SY5Y cells revealed a downregulation in SPR and an upregulation in both STAT1 and STAT3 (Figure S6). We propose that the antagonistic feedback mechanisms present between BH4 and l-phenylalanine homeostasis in the de novo pathway can act to increase the expression of GCH1 upstream after tranilast treatment. This could be explained by the observed increase in STAT1 and STAT3 expressions in response to reduced BH4 levels, both genes that regulate GCH1. However, western blot analysis of tranilast-treated cells revealed no significant change in SPR, GCH1, or STAT3 (Figure 8). The correlation between mRNA and protein is not always linear.77 STAT1 and STAT3 are also controlled by post-translational modifications such as tyrosine phosphorylation and SUMOylation which could explain this inconsistency.78,79 It is also possible that the protein levels may only correlate to RNA expression changes after an extended temporal delay beyond the 24 h used in our experiments.
The clear association between hSPR inhibition and suppression in the perceived pain could explain the findings in the clinical trial undertaken at the Kumamoto University, where the study group scored lower pain NRS scores after 6 months of treatment with tranilast.53 In this case, tranilast may have been inhibiting hSPR activity, thus reducing BH4 concentrations. Lower BH4 levels can decrease the production of pro-inflammatory molecules such as ROS and NO that have been linked in the literature to induce neuropathic pain through various mechanisms.80−82
Repurposing the roles of existing therapeutics such as tranilast could contribute in the novel identification of small molecule analgesics for the treatment of CP. These results also offer a platform to evaluate and elucidate the structure–activity relationship between tranilast and hSPR. Tranilast could be used as a parent structure to undertake chemical modification for future drug design of novel analogues. The analgesic effect of tranilast should be validated in animal models of CP and subsequent clinical drug trials in CP patients.
Methods
Molecular Docking
Docking of compounds and scoring calculations were performed using the ICM molecular modeling software (Molsoft LLC, San Diego, CA, USA). The crystal structure of hSPR (PDB id: 4HWK) was used as the receptor for docking and screening of potential compounds.834HWK has a resolution of 2.40 Å and covers 4–257 residues out of total 258 residues in the functional protein. It includes NADP and sulfapyridine bound to hSPR. The structures of chemical compounds were obtained from the LOPAC1280 library from Sigma (Sigma-Aldrich, Dorset, UK). This library also contains sepiapterin, the natural substrate of the SPR. A crystal structure of sepiapterin bound to mouse SPR with a resolution of 1.95 Å (PDB id: 1SEP) was used to predict the sepiapterin binding site in hSPR.84 The mouse and hSPR sequences show an overall alignment of 73%, with 97% similarity in the NADP and sepiapterin binding sites. We carried out flexible ligand docking in the grid generated around the predicted sepiapterin binding site. The docking poses were scored by the ICM scoring function which is optimized to rank order docking hits according to their binding affinity. A lower ICM score indicates the greater probability of a ligand having a high affinity to the receptor. We also carried out modeling and docking of a published SPR inhibitor, SPRi3, to compare the binding score with those of the commercially available compounds in the LOPAC1280 library.28
ICM software uses Monte Carlo simulations to globally optimize a set of ligand internal coordinates in the space of grid potential maps calculated for the protein (receptor) pocket.85 The grid potential maps of the protein pocket account for hydrogen bonding, van der Waals forces, hydrophobic interactions, and electrostatic potential.85 The low energy conformations of compounds are generated outside the protein binding pocket and these are then used as starting structures for docking. The predicted score is calculated as the weighted (α1 to α5) sum of the ligand–protein van der Waals interactions and internal force field energy of the ligand (ΔEIntFF), free energy changes due to conformational energy loss upon ligand binding (TΔSTor), hydrogen bonding interactions (ΔEHBond), hydrogen bond donor–acceptor desolvation energy (ΔEHBDesol), solvation electrostatic energy upon ligand binding (ΔESolEl), hydrophobic free energy gain (ΔEHPhob), and a size correction term proportional to the number of ligand atoms (Qsize)85
For the initial screening of potential inhibitors of hSPR, the thoroughness value for the Monte Carlo run length was set at three. Multiple docking and rescoring attempts, utilizing varying grid sizes around the sepiapterin binding site, were performed with the compound library. This was carried out to identify potential inhibitors showing consistent scores of less than −35 across docking attempts.
MD Simulations
We carried out 500 ns long MD simulations using the ligand and hSPR complex of four ligands as the starting structures. These included hSPR–sepiapterin, hSPR–SPRi3, hSPR–NDGA, and hSPR–tranilast complexes. The parameters for the ligands were generated in the antechamber module of the AMBER software using the GAFF force field.86 Simulations were carried out using the ff14SB force field in AMBER16.87 One sodium ion was added to neutralize the hSPR–tranilast complex. The other complexes were neutral and did not require any addition of counter ions. Solvation using TIP3P water molecules was performed in the xleap module of the AMBER16 program.87 The system was placed in a periodic box whose boundaries extended to at least 10 Å from any solute atom and the topology and coordinate files were generated in the xleap module of AMBER16.
Standard equilibration protocols were used for initial minimization of the structure. The first round of equilibration with explicit solvent and ions involved 1000 steps of the steepest descent, followed by 1000 steps of conjugate gradient energy minimization. A 300 ps MD equilibration was performed in which the protein–ligand complex was constrained, whereas the solvent and ion (where applicable) were allowed to equilibrate. The system was gently heated from 0 to 300 K with a time constant of 0.5 ps. This was followed by subsequent rounds of MD simulation, at constant pressure and 300 K, for 1 ns. The constraints were gradually relaxed until no constraints were applied to the system. The final MD simulations were carried in AMBER16 for 500 ns. The periodic boundary conditions were defined by the PME algorithm and the nonbonded cut-off was set to 10 Å.88 Hydrogen mass repartitioning was carried out and an integration time step of 4 fs was used.89 Covalent bonds involving hydrogen atoms were constrained using the SHAKE algorithm with a tolerance of 0.0001 Å.90 All the simulations were carried out at a constant pressure of 1 atm and constant temperature of 300 K. The temperature and pressure was maintained using a Berendsen weak coupling thermostat.91 The final production run without restraints was carried out for a continuous 500 ns and the frames were collected every 10 ps. Analyses of the trajectory were performed using the cpptraj92 module of AMBER16 and the program VMD93 was used for visualization.
Cell-Free Direct hSPR Enzyme Activity Assay
Activity of hSPR was determined colorimetrically by measuring the percentage decrease in sepiapterin absorbance at 405 nm. The assays were run on transparent 96-well plates, reaction mixes containing 50 μL of a 5-point dilution series of tranilast (final concentrations 0–375 μM) in H2O, 50 μL of the enzyme mix containing 3 ng/μL hSPR (Genway BioTech, San Diego, US), 2 mM NADPH, 400 μg/mL bovine serum albumin (BSA), 200 mM sodium phosphate buffer (pH 6.5) (all Sigma-Aldrich, Dorset, UK), and 100 μL of 300 μM sepiapterin (Santa Cruz Biotechnology, Dallas, US) diluted in 200 mM sodium phosphate buffer (pH 6.5). Assay controls of NAS as a known hSPR inhibitor, and enzyme mix lacking hSPR were run in parallel to confirm that the observed effects were a result of tranilast activity. Assay mix absorbance was measured at the start of the assay after sepiapterin addition, and after 1 h of incubation at 37 °C, using an Infinite F50 microplate reader (Tecan, Männedorf, Switzerland).
Cellular hSPR Activity Assays
Cultures of human neuroblastoma SH-SY5Y cells were grown in DMEM/F12 media containing 10% fetal bovine serum (FBS, Thermo Scientific Waltham, USA) in 24-well culture plates up to 80% confluency. On the day of transfection, spent media was aspirated and 500 μL of fresh media was added. A diluted DNA transfection mixture was prepared with 500 ng of hSPR DNA in 25 μL of the Opti-MEM medium (Thermo Scientific Waltham, USA) per each well to be transfected and incubated for 5 min at room temperature. This was combined with a transfection reagent mixture containing 1.5 μL of polyethylenimine (PEI) in 25 μL of the Opti-MEM medium per each well to be transfected and incubated for 15 min at room temperature. Fifty microliters of the complete transfection mixture was added to each well and incubated for 48 h at 37 °C.
For extracellular quantification of hSPR activity following cell lysis, the cultures were detached using 200 μL of trypsin, resuspended with 300 μL of PBS, and centrifuged at 1000g for 5 min. The pellet was resuspended in 70 μL of H2O and subjected to four freeze–thaw cycles from dry ice to a heat block at 37 °C. The lysate was centrifuged at 10 000g for 10 min and the supernatant collected. The assays were run on transparent 96-well plates, reaction mixes containing 50 μL of the cell lysate supernatant, 50 μL of enzyme mix containing 2 mM NADPH, 400 μg/mL of BSA, 200 mM sodium phosphate buffer (pH 6.5), and 100 μL of a mixture of 300 μM sepiapterin and 50 μM tranilast diluted in 200 mM sodium phosphate buffer (pH 6.5). Assay well absorbance at 405 nm was measured directly after sepiapterin and tranilast addition, and following 1 h of incubation at 37 °C on a microplate reader.
For quantification of hSPR activity in live cells, the cells were cultured on 48 well plates using DMEM/F12 media containing 10% FBS lacking phenol red. Cultures were transfected using 200 ng of hSPR DNA in 10 μL of Opti-MEM mixed with 0.6 μL of PEI in 10 μL of Opti-MEM per well as stated previously. After 47 h of transfection, appropriate cells were pretreated with 50 μM tranilast for 1 h. The hSPR activity was measured both extracellularly and intracellularly. Briefly, the activity of released extracellular hSPR was determined through the collection of aspirated media from each well. One hundred microliters of collected media was mixed with an equal volume of the assay mix containing 1 mM NADPH, 200 μg/mL of BSA, and 300 μM sepiapterin diluted in 200 mM sodium phosphate buffer (pH 6.5) on a transparent 96-well plate. The absorbance at 405 nm was measured at the start of the assay and after 24 h of incubation at 37 °C. To determine hSPR activity within the cells, intracellular reaction mix containing 500 μL of phenol-red free media with 1.25 mM NADPH, 125 μg/mL of BSA, and 150 μM sepiapterin was added to the transfected cells. Two hundred microlitres of the intracellular reaction mix was transferred on an empty transparent 96-well plate after 24 h incubation at 37 °C and the absorbance was measured at 405 nm. This was run in parallel to assay controls of nontransfected cells and cultures lacking tranilast treatment to determine percentage of enzyme inhibition.
Cell Metabolism and Viability Assays
The CellTiter 96 non-radioactive cell proliferation assay was used to measure the viability of cells, while the CellTiter-Glo luminescent cell viability assay (both Promega, Madison, USA) was utilized to quantify cellular ATP, signaling the presence of metabolically active cells. The cultures of the SH-SY5Y cells were prepared on 96-well transparent assay plates for the proliferation assay or opaque-walled plates for the viability assay at 80% confluency in 100 μL of culture medium. The cultures were subjected to 24 h treatment with a range of tranilast concentrations (0.1 μM–1 mM). The assays were performed following the manufacturer’s guidelines. Control wells containing cell-free media were used to obtain a value for background luminescence and DMSO vehicle controls.
Flow Cytometry of ROS
For cellular quantification of ROS by flow cytometry, the cultures were grown in appropriate media in 24-well culture plates up to 80% confluency. Culture media was aspirated and replaced with 500 μL of stimulation media, containing 40 ng of TNF-α (Invitrogen Thermo, Carlsbad, US), and 100 ng of IFN-γ (Gibco Thermo, Waltham, US) per 1 mL of the appropriate cell medium. Drug treatments were administered and cells were incubated for 24 h at 37 °C; nonstimulated and flow cytometry fluorophore-free assay controls were run in parallel. Stimulation media was aspirated and 300 μL of the appropriate cell medium lacking phenol red and FBS, containing 1.25 μM of 2′,7′-dichlorodihydrofluorescein diacetate (H2DCFDA) (Thermo Scientific Waltham, USA) utilized for the detection and bio-imaging of ROS, was added to each well. The plate was incubated for 45 min at 37 °C, protected from light. The cells were detached using 200 μL of trypsin and resuspended with 300 μL of PBS containing 10% FBS, before centrifugation at 1000g for 5 min. Pellets were resuspended in 500 μL of cold PBS and kept on ice. Cell sample flow cytometry was performed on a Millipore Guava easyCyte flow cytometry system and analyzed using the Guava InCyte software (Merck Millipore, Massachusetts, US), measuring 5000 cells within set gating boundaries to calculate a median fluorescent output.
Western Blot of BH4 Pathway Enzymes & qPCR of Upstream Gene Expressions
For protein quantification, SH-SY5Y cultures treated for 24 h with 100 μM tranilast or vehicle control were collected and counted after detachment using trypsin and spun at 500g for 5 min. One millilitre of radioimmunoprecipitation assay buffer per 2 × 10⁷ cells, containing 0.1% v/v protease inhibitor cocktail (both Sigma-Aldrich, Dorset, UK), was added to the isolated pellet, mixed, and stored at 4 °C for 20 min. This was then centrifuged at 10 000g for 10 min and the supernatant containing soluble protein stored at −80 °C until further use. The protein sample concentration was determined through a Bradford protein assay (Bio-Rad Laboratories, Hercules, US) performed according to the manufacturer’s instructions, using a standard curve generated from series dilution of BSA (Sigma-Aldrich, Dorset, UK) to quantify the samples against relative absorbance values at 595 nm. Western immunoblotting was carried out using standard protocols; 10 μg of the protein samples were loaded onto 12% acrylamide gels with a Precision Plus Protein All Blue prestained protein ladder and run with a PowerPac Universal power supply at 250 V and 35 mA. Polyvinylidene difluoride membranes were activated by soaking in methanol, and membrane transfer was performed using a Trans-Blot Turbo transfer system (all Bio-Rad Laboratories, Hercules, US) at 25 V and 1 A/gel for 30 min. The blots were blocked in 10 mL of a 1:1 solution of Odyssey blocking buffer (OBB; Licor, Cambridge, UK) and TBS for 1 h and incubated overnight at 4 °C with primary antibodies (see Table S2), diluted in a 1:19 solution of OBB and TBS (1:1000 primary antibody dilution). The blots were washed 4 times in TBST for 10 min before the addition of the secondary antibody dilution in a 1:19 solution of OBB in TBS (1:2000 secondary antibody dilution) and left rocking in the dark for 30 min at room temperature before fluorescent visualization on a ChemiDoc MP visualization system according to the secondary antibody specific wavelengths (Bio-Rad Laboratories, Hercules, US).
Total RNA was isolated from cell cultures using the TRI reagent following the supplier’s protocol and stored in RNase-free H2O (both Sigma-Aldrich, Dorset, UK) at −80 °C. RNA sample concentrations and purity were determined using UV spectrophotometric quantification on a Nanodrop 2000 spectrophotometer (Thermo Scientific Waltham, USA), and through electrophoresis on a nondenaturing 1% agarose gel. Reverse transcription of 500 ng of RNA samples was performed with a Verso cDNA synthesis kit (Thermo Scientific Waltham, USA) according to the manufacturer’s instructions, diluting the product to 1:10 in molecular grade RNA/DNA-free H2O and stored at −20 °C for use in qRT-PCR. qRT-PCR was performed on a CFX96 RT instrument (Bio-Rad Laboratories, Hercules, US), using triplicates of the samples in a 10 μL reaction containing 5 μL of diluted cDNA (further 1:5 dilution of the stored cDNA synthesis product), 300 nM of the forward and reverse primers and 3 μL of iTaq Universal SYBR Green supermix (Bio-Rad Laboratories, Hercules, US). The reaction consisted of polymerase activation and DNA denaturing at 95 °C for 2 min, followed by 40 thermal cycles of denaturing for 5 s and annealing and extension at 60 °C for 30 s before fluorescence measurement. Following cycle completion, melt curve analysis was performed and calculation of the threshold cycle (Cq value) was determined using a Bio-Rad CFX Manager (Bio-Rad Laboratories, Hercules, US) to quantify the gene expression, normalized using actin and GAPDH reference gene (geNorm M value = 0.451). Forward and reverse primers (Eurofins Genomics, Wolverhampton, UK) for gene expression are listed in the Table S3.
BH4 Quantification by QQQ-MS
Cultures of SH-SY5Y cells were grown in DMEM/F12 media on 6-well culture plates up to 80% confluency. The cells were pretreated with either 30, 100, or 300 μM tranilast for 1 h to allow for ligand–enzyme interactions. Media was then replaced with DMEM/F12 media containing 100 μM sepiapterin and the corresponding well concentration of tranilast. The plate was incubated for 1 h at 37 °C, with both nontreated and sepiapterin free control wells running in parallel. Media was then aspirated, and the cells were detached using 200 μL of trypsin, mixed with 300 μL PBS, and centrifuged at 1000g for 5 min. The pellet was resuspended in 200 μL of H2O containing 6.5 mM dithioerythritol and subjected to needle homogenization through a 22-gauge needle and four freeze–thaw cycles from dry ice to a heat block at 37 °C. The lysate was centrifuged at 10 000g for 10 min and the supernatant was collected, filtered through 4 mm, 0.45 μm pore syringe filters (Phenomenex, Macclesfield, UK) into amber glass vials for QQQ-MS analysis.
The instrumentation for BH4 quantification included an Agilent 1290 Infinity II Series LC and an Agilent 6470 Triple Quadrupole LC/MS system (Agilent Technologies, Santa Clara, US). High-performance liquid chromatography separation was achieved at 40 °C, using an Agilent Poroshell 120 C18, 2.7 μm, 4.6 × 100 mm column, and a gradient solvent mixture consisting of mobile phase A (H2O + 0.1% formic acid) and mobile phase B (acetonitrile + 0.1% formic acid). The gradient used was 0–2 min 2% B; 12 min 98% B; 14 min 98% B; 14.1 min 2% B; 15 min 2% B. The flow rate was set at 0.6 mL/min, and sample injection volume at 10 μL. QQQ-MS experiment parameters were as followed: gas temperature, 300 °C at a flow of 10 mL/min; nebulizer pressure, 20 psi; sheath gas temperature, 350 °C at a flow of 11 mL/min capillary voltage, 3000 V; nozzle voltage, 500 V; fragmentor voltage, 135 V; cell accelerator voltage, 5 V. The instrument was operated at positive ion electrospray ionization, and the MS was applied in the multiple reaction monitoring mode with precursor ion m/z 242.1 and product ion m/z 166.0 using a collision energy of 20 eV. The BH4 standard used for method development and quantification of limit of detection (Figure S8) was acquired from Schircks Laboratories, Bauma, Switzerland.
Statistical Analysis
All values are expressed as means ± standard error of the mean (SEM) or standard deviation; details of the statistical tests used are stated in figure legends. The student’s t-test was used to compare between two individual groups, and one-way analysis of variance (ANOVA) followed by the Tukey’s post-hoc test was used for analysis for multiple comparisons between multiple groups. In all tests, p ≤ 0.05 was considered significant.
Acknowledgments
PCM would like to acknowledge the funding support from the British Pain Society through the 2013 Mildred B. Clulow Award and the Centre for Biomarker Research.
Supporting Information Available
The Supporting Information is available free of charge on the ACS Publications website at DOI: 10.1021/acsomega.9b01228.
IC50 of other tested compounds, list of antibodies and primer information for qRT-PCR, tetrahydrobiopterin biosynthesis pathways, scores of LOPAC®1280, stability of the hydrogen bonds in the hSPR-drug simulations, distance between the atoms of the tranilast and NADPH rings, effect of tranilast on cell viability and metabolism, expression changes measured by qRT-PCR, western blot images, and QQQ-MS quantification (PDF)
PDB files of hSPR–ligand complexes (ZIP)
The authors declare no competing financial interest.
Supplementary Material
References
- Crofford L. J. Chronic Pain: Where the Body Meets the Brain. Trans. Am. Clin. Climatol. Assoc. 2015, 126, 167–183. [PMC free article] [PubMed] [Google Scholar]
- van Hecke O.; Torrance N.; Smith B. H. Chronic pain epidemiology—where do lifestyle factors fit in?. Br. J. Pain 2013, 7, 209–217. 10.1177/2049463713493264. [DOI] [PMC free article] [PubMed] [Google Scholar]
- Phillips C. J. The Cost and Burden of Chronic Pain. Rev. Pain 2009, 3, 2–5. 10.1177/204946370900300102. [DOI] [PMC free article] [PubMed] [Google Scholar]
- Takura T.; Ushida T.; Kanchiku T.; Ebata N.; Fujii K.; DiBonaventura M. d.; Taguchi T. The societal burden of chronic pain in Japan: an internet survey. J. Orthop. Sci. 2015, 20, 750–760. 10.1007/s00776-015-0730-8. [DOI] [PubMed] [Google Scholar]
- Breivik H.; Eisenberg E.; O’Brien T.; Openminds The individual and societal burden of chronic pain in Europe: the case for strategic prioritisation and action to improve knowledge and availability of appropriate care. BMC Public Health 2013, 13, 1229. 10.1186/1471-2458-13-1229. [DOI] [PMC free article] [PubMed] [Google Scholar]
- Groenewald C. B.; Essner B. S.; Wright D.; Fesinmeyer M. D.; Palermo T. M. The economic costs of chronic pain among a cohort of treatment-seeking adolescents in the United States. J. Pain 2014, 15, 925–933. 10.1016/j.jpain.2014.06.002. [DOI] [PMC free article] [PubMed] [Google Scholar]
- Fayaz A.; Croft P.; Langford R. M.; Donaldson L. J.; Jones G. T. Prevalence of chronic pain in the UK: a systematic review and meta-analysis of population studies. BMJ Open 2016, 6, e010364 10.1136/bmjopen-2015-010364. [DOI] [PMC free article] [PubMed] [Google Scholar]
- de Souza J. B.; Grossmann E.; Perissinotti D. M. N.; de Oliveira Junior J. O.; da Fonseca P. R. B.; Posso I. P. Prevalence of Chronic Pain, Treatments, Perception, and Interference on Life Activities: Brazilian Population-Based Survey. Pain Res. Manage. 2017, 2017, 4643830. 10.1155/2017/4643830. [DOI] [PMC free article] [PubMed] [Google Scholar]
- Cheung C. W.; Choi S. W.; Wong S. S. C.; Lee Y.; Irwin M. G. Changes in Prevalence, Outcomes, and Help-seeking Behavior of Chronic Pain in an Aging Population Over the Last Decade. Pain Pract. 2017, 17, 643–654. 10.1111/papr.12496. [DOI] [PubMed] [Google Scholar]
- Dahlhamer J.; Lucas J.; Zelaya C.; Nahin R.; Mackey S.; DeBar L.; Kerns R.; Von Korff M.; Porter L.; Helmick C. Prevalence of Chronic Pain and High-Impact Chronic Pain Among Adults—United States, 2016. MMWR (Morb. Mortal. Wkly. Rep.) 2018, 67, 1001–1006. 10.15585/mmwr.mm6736a2. [DOI] [PMC free article] [PubMed] [Google Scholar]
- Morrone L.; Scuteri D.; Rombola L.; Mizoguchi H.; Bagetta G. Opioids Resistance in Chronic Pain Management. Curr. Neuropharmacol. 2017, 15, 444–456. 10.2174/1570159x14666161101092822. [DOI] [PMC free article] [PubMed] [Google Scholar]
- Cherubino P.; Sarzi-Puttini P.; Zuccaro S. M.; Labianca R. The management of chronic pain in important patient subgroups. Clin. Drug Invest. 2012, 32, 35–44. 10.2165/11630060-000000000-00000. [DOI] [PubMed] [Google Scholar]
- Volkow N. D.; McLellan A. T. Opioid Abuse in Chronic Pain—Misconceptions and Mitigation Strategies. N. Engl. J. Med. 2016, 374, 1253–1263. 10.1056/nejmra1507771. [DOI] [PubMed] [Google Scholar]
- Tremont-Lukats I. W.; Megeff C.; Backonja M.-M. Anticonvulsants for Neuropathic Pain Syndromes. Drugs 2000, 60, 1029–1052. 10.2165/00003495-200060050-00005. [DOI] [PubMed] [Google Scholar]
- Patetsos E.; Horjales-Araujo E. Treating Chronic Pain with SSRIs: What Do We Know?. Pain Res. Manage. 2016, 2016, 2020915. 10.1155/2016/2020915. [DOI] [PMC free article] [PubMed] [Google Scholar]
- Nicholson B. Responsible prescribing of opioids for the management of chronic pain. Drugs 2003, 63, 17–32. 10.2165/00003495-200363010-00002. [DOI] [PubMed] [Google Scholar]
- Ballantyne J. C. Opioids for the Treatment of Chronic Pain: Mistakes Made, Lessons Learned, and Future Directions. Anesth. Analg. 2017, 125, 1769–1778. 10.1213/ane.0000000000002500. [DOI] [PubMed] [Google Scholar]
- Dahan A.; van Velzen M.; Niesters M. Comorbidities and the complexities of chronic pain. Anesthesiology 2014, 121, 675–677. 10.1097/aln.0000000000000402. [DOI] [PubMed] [Google Scholar]
- Denk F.; McMahon S. B.; Tracey I. Pain vulnerability: a neurobiological perspective. Nat. Neurosci. 2014, 17, 192–200. 10.1038/nn.3628. [DOI] [PubMed] [Google Scholar]
- Taneja A.; Della Pasqua O.; Danhof M. Challenges in translational drug research in neuropathic and inflammatory pain: the prerequisites for a new paradigm. Eur. J. Clin. Pharmacol. 2017, 73, 1219–1236. 10.1007/s00228-017-2301-8. [DOI] [PMC free article] [PubMed] [Google Scholar]
- van Hecke O.; Torrance N.; Smith B. H. Chronic pain epidemiology and its clinical relevance. Br. J. Anaesth. 2013, 111, 13–18. 10.1093/bja/aet123. [DOI] [PubMed] [Google Scholar]
- Hughes J. P.; Chessell I.; Malamut R.; Perkins M.; Bačkonja M.; Baron R.; Farrar J. T.; Field M. J.; Gereau R. W.; Gilron I.; McMahon S. B.; Porreca F.; Rappaport B. A.; Rice F.; Richman L. K.; Segerdahl M.; Seminowicz D. A.; Watkins L. R.; Waxman S. G.; Wiech K.; Woolf C. Understanding chronic inflammatory and neuropathic pain. Ann. N.Y. Acad. Sci. 2012, 1255, 30–44. 10.1111/j.1749-6632.2012.06561.x. [DOI] [PubMed] [Google Scholar]
- Backonja M.; Woolf C. J. Future directions in neuropathic pain therapy: closing the translational loop. Oncologist 2010, 15, 24–29. 10.1634/theoncologist.2009-s502. [DOI] [PubMed] [Google Scholar]
- Simeoli R.; Montague K.; Jones H. R.; Castaldi L.; Chambers D.; Kelleher J. H.; Vacca V.; Pitcher T.; Grist J.; Al-Ahdal H.; Wong L.-F.; Perretti M.; Lai J.; Mouritzen P.; Heppenstall P.; Malcangio M. Exosomal cargo including microRNA regulates sensory neuron to macrophage communication after nerve trauma. Nat. Commun. 2017, 8, 1778. 10.1038/s41467-017-01841-5. [DOI] [PMC free article] [PubMed] [Google Scholar]
- Lau B. K.; Vaughan C. W. Targeting the endogenous cannabinoid system to treat neuropathic pain. Front. Pharmacol. 2014, 5, 28. 10.3389/fphar.2014.00028. [DOI] [PMC free article] [PubMed] [Google Scholar]
- Hanamura K.; Washburn H. R.; Sheffler-Collins S. I.; Xia N. L.; Henderson N.; Tillu D. V.; Hassler S.; Spellman D. S.; Zhang G.; Neubert T. A.; Price T. J.; Dalva M. B. Extracellular phosphorylation of a receptor tyrosine kinase controls synaptic localization of NMDA receptors and regulates pathological pain. PLoS Biol. 2017, 15, e2002457 10.1371/journal.pbio.2002457. [DOI] [PMC free article] [PubMed] [Google Scholar]
- Chang D. S.; Raghavan R.; Christiansen S.; Cohen S. P. Emerging targets in treating pain. Curr. Opin. Anaesthesiol. 2015, 28, 379–397. 10.1097/aco.0000000000000216. [DOI] [PubMed] [Google Scholar]
- Latremoliere A.; Latini A.; Andrews N.; Cronin S. J.; Fujita M.; Gorska K.; Hovius R.; Romero C.; Chuaiphichai S.; Painter M.; Miracca G.; Babaniyi O.; Remor A. P.; Duong K.; Riva P.; Barrett L. B.; Ferreirós N.; Naylor A.; Penninger J. M.; Tegeder I.; Zhong J.; Blagg J.; Channon K. M.; Johnsson K.; Costigan M.; Woolf C. J. Reduction of Neuropathic and Inflammatory Pain through Inhibition of the Tetrahydrobiopterin Pathway. Neuron 2015, 86, 1393–1406. 10.1016/j.neuron.2015.05.033. [DOI] [PMC free article] [PubMed] [Google Scholar]
- Holliday K. L.; Nicholl B. I.; Macfarlane G. J.; Thomson W.; Davies K. A.; McBeth J. Do genetic predictors of pain sensitivity associate with persistent widespread pain?. Mol. Pain 2009, 5, 56. 10.1186/1744-8069-5-56. [DOI] [PMC free article] [PubMed] [Google Scholar]
- Doehring A.; Freynhagen R.; Griessinger N.; Zimmermann M.; Sittl R.; Hentig N. v.; Geisslinger G.; Lötsch J. Cross-sectional assessment of the consequences of a GTP cyclohydrolase 1 haplotype for specialized tertiary outpatient pain care. Clin. J. Pain 2009, 25, 781–785. 10.1097/ajp.0b013e3181b43e12. [DOI] [PubMed] [Google Scholar]
- Lötsch J.; Klepstad P.; Doehring A.; Dale O. A GTP cyclohydrolase 1 genetic variant delays cancer pain. Pain 2010, 148, 103–106. 10.1016/j.pain.2009.10.021. [DOI] [PubMed] [Google Scholar]
- Kim D. H.; Dai F.; Belfer I.; Banco R. J.; Martha J. F.; Tighiouart H.; Tromanhauser S. G.; Jenis L. G.; Hunter D. J.; Schwartz C. E. Polymorphic variation of the guanosine triphosphate cyclohydrolase 1 gene predicts outcome in patients undergoing surgical treatment for lumbar degenerative disc disease. Spine 2010, 35, 1909–1914. 10.1097/brs.0b013e3181eea007. [DOI] [PubMed] [Google Scholar]
- McHugh P. C.; Joyce P. R.; Deng X.; Kennedy M. A. A polymorphism of the GTP-cyclohydrolase I feedback regulator gene alters transcriptional activity and may affect response to SSRI antidepressants. Pharmacogenomics J. 2011, 11, 207–213. 10.1038/tpj.2010.23. [DOI] [PubMed] [Google Scholar]
- Werner E. R.; Blau N.; Thöny B. Tetrahydrobiopterin: biochemistry and pathophysiology. Biochem. J. 2011, 438, 397–414. 10.1042/bj20110293. [DOI] [PubMed] [Google Scholar]
- Vancassel S.; Capuron L.; Castanon N. Brain Kynurenine and BH4 Pathways: Relevance to the Pathophysiology and Treatment of Inflammation-Driven Depressive Symptoms. Front. Neurosci. 2018, 12, 499. 10.3389/fnins.2018.00499. [DOI] [PMC free article] [PubMed] [Google Scholar]
- McHugh P. C.; Joyce P. R.; Kennedy M. A. Polymorphisms of sepiapterin reductase gene alter promoter activity and may influence risk of bipolar disorder. Pharmacogenet. Genomics 2009, 19, 330–337. 10.1097/fpc.0b013e328328f82c. [DOI] [PubMed] [Google Scholar]
- McHugh P. C.; Rogers G. R.; Loudon B.; Glubb D. M.; Joyce P. R.; Kennedy M. A. Proteomic analysis of embryonic stem cell-derived neural cells exposed to the antidepressant paroxetine. J. Neurosci. Res. 2008, 86, 306–316. 10.1002/jnr.21482. [DOI] [PubMed] [Google Scholar]
- Katoh S.; Sueoka T.; Yamada S. Direct inhibition of brain sepiapterin reductase by a catecholamine and an indoleamine. Biochem. Biophys. Res. Commun. 1982, 105, 75–81. 10.1016/s0006-291x(82)80012-0. [DOI] [PubMed] [Google Scholar]
- Yang S.; Jan Y.-H.; Mishin V.; Richardson J. R.; Hossain M. M.; Heindel N. D.; Heck D. E.; Laskin D. L.; Laskin J. D. Sulfa drugs inhibit sepiapterin reduction and chemical redox cycling by sepiapterin reductase. J. Pharmacol. Exp. Ther. 2015, 352, 529–540. 10.1124/jpet.114.221572. [DOI] [PMC free article] [PubMed] [Google Scholar]
- Darakhshan S.; Pour A. B. Tranilast: a review of its therapeutic applications. Pharmacol. Res. 2015, 91, 15–28. 10.1016/j.phrs.2014.10.009. [DOI] [PubMed] [Google Scholar]
- Komatsu H.; Kojima M.; Tsutsumi N.; Hamano S.; Kusama H.; Ujiie A.; Ikeda S.; Nakazawa M. Study of the Mechanism of Inhibitory Action of Tranilast on Chemical Mediator Release. Jpn. J. Pharmacol. 1988, 46, 43–51. 10.1254/jjp.46.43. [DOI] [PubMed] [Google Scholar]
- Koda A.; Nagai H.; Watanabe S.; Yanagihara Y.; Sakamoto K. Inhibition of hypersensitivity reactions by a new drug, N(3′,4′-dimethoxycinnamoyl) anthranilic acid (N-5′). J. Allergy Clin. Immunol. 1976, 57, 396–407. 10.1016/0091-6749(76)90054-3. [DOI] [PubMed] [Google Scholar]
- Rogosnitzky M.; Danks R.; Kardash E. Therapeutic potential of tranilast, an anti-allergy drug, in proliferative disorders. Anticancer Res. 2012, 32, 2471–2478. [PubMed] [Google Scholar]
- Platten M.; Ho P. P.; Youssef S.; Fontoura P.; Garren H.; Hur E. M.; Gupta R.; Lee L. Y.; Kidd B. A.; Robinson W. H.; Sobel R. A.; Selley M. L.; Steinman L. Treatment of autoimmune neuroinflammation with a synthetic tryptophan metabolite. Science 2005, 310, 850–855. 10.1126/science.1117634. [DOI] [PubMed] [Google Scholar]
- Kelly D. J.; Zhang Y.; Connelly K.; Cox A. J.; Martin J.; Krum H.; Gilbert R. E. Tranilast attenuates diastolic dysfunction and structural injury in experimental diabetic cardiomyopathy. Am. J. Physiol.: Heart Circ. Physiol. 2007, 293, H2860–H2869. 10.1152/ajpheart.01167.2006. [DOI] [PubMed] [Google Scholar]
- Shiota N.; Kovanen P.; Eklund K.; Shibata N.; Shimoura K.; Niibayashi T.; Shimbori C.; Okunishi H. The anti-allergic compound tranilast attenuates inflammation and inhibits bone destruction in collagen-induced arthritis in mice. Br. J. Pharmacol. 2010, 159, 626–635. 10.1111/j.1476-5381.2009.00561.x. [DOI] [PMC free article] [PubMed] [Google Scholar]
- Huang Y.; Jiang H.; Chen Y.; Wang X.; Yang Y.; Tao J.; Deng X.; Liang G.; Zhang H.; Jiang W.; Zhou R. Tranilast directly targets NLRP3 to treat inflammasome-driven diseases. EMBO Mol. Med. 2018, 10, e8689 10.15252/emmm.201708689. [DOI] [PMC free article] [PubMed] [Google Scholar]
- Siveen K. S.; Prabhu K. S.; Parray A. S.; Merhi M.; Arredouani A.; Chikri M.; Uddin S.; Dermime S.; Mohammad R. M.; Steinhoff M.; Janahi I. A.; Azizi F. Evaluation of cationic channel TRPV2 as a novel biomarker and therapeutic target in Leukemia-Implications concerning the resolution of pulmonary inflammation. Sci. Rep. 2019, 9, 1554. 10.1038/s41598-018-37469-8. [DOI] [PMC free article] [PubMed] [Google Scholar]
- Yashiro M.; Murahashi K.; Matsuoka T.; Nakazawa K.; Tanaka H.; Osaka H.; Koyama T.; Ohira M.; Chung K. H. Tranilast (N-3,4-dimethoxycinamoyl anthranilic acid): a novel inhibitor of invasion-stimulating interaction between gastric cancer cells and orthotopic fibroblasts. Anticancer Res. 2003, 23, 3899–3904. [PubMed] [Google Scholar]
- Spiecker M.; Lorenz I.; Marx N.; Darius H. Tranilast Inhibits Cytokine-Induced Nuclear Factor kappa B Activation in Vascular Endothelial Cells. Mol. Pharmacol. 2002, 62, 856–863. 10.1124/mol.62.4.856. [DOI] [PubMed] [Google Scholar]
- Inoue H.; Ohshima H.; Kono H.; Yamanaka M.; Kubota T.; Aihara M.; Hiroi T.; Yago N.; Ishida H. Suppressive effects of tranilast on the expression of inducible cyclooxygenase (COX2) in interleukin-1beta-stimulated fibroblasts. Biochem. Pharmacol. 1997, 53, 1941–1944. 10.1016/s0006-2952(97)00187-1. [DOI] [PubMed] [Google Scholar]
- Inglis J. J.; Criado G.; Andrews M.; Feldmann M.; Williams R. O.; Selley M. L. The anti-allergic drug, N-(3′,4′-dimethoxycinnamonyl) anthranilic acid, exhibits potent anti-inflammatory and analgesic properties in arthritis. Rheumatology 2007, 46, 1428–1432. 10.1093/rheumatology/kem160. [DOI] [PubMed] [Google Scholar]
- Honda R.; Honda T.; Tashiro H.; Saya H.; Yoshimura Y.; Katabuchi H. Evaluating the effect of Tranilast for pelvic pain caused by endometriosis. Fertil. Steril. 2013, 100, 372–373. 10.1016/j.fertnstert.2013.07.802. [DOI] [Google Scholar]
- Tegeder I.; Costigan M.; Griffin R. S.; Abele A.; Belfer I.; Schmidt H.; Ehnert C.; Nejim J.; Marian C.; Scholz J.; Wu T.; Allchorne A.; Diatchenko L.; Binshtok A. M.; Goldman D.; Adolph J.; Sama S.; Atlas S. J.; Carlezon W. A.; Parsegian A.; Lötsch J.; Fillingim R. B.; Maixner W.; Geisslinger G.; Max M. B.; Woolf C. J. GTP cyclohydrolase and tetrahydrobiopterin regulate pain sensitivity and persistence. Nat. Med. 2006, 12, 1269–1277. 10.1038/nm1490. [DOI] [PubMed] [Google Scholar]
- Naylor A. M.; Pojasek K. R.; Hopkins A. L.; Blagg J. The tetrahydrobiopterin pathway and pain. Curr. Opin. Invest. Drugs 2010, 11, 19–30. [PubMed] [Google Scholar]
- Crabtree M. J.; Channon K. M. Synthesis and recycling of tetrahydrobiopterin in endothelial function and vascular disease. Nitric Oxide: Biol. Chem. 2011, 25, 81–88. 10.1016/j.niox.2011.04.004. [DOI] [PMC free article] [PubMed] [Google Scholar]
- Crabtree M. J.; Tatham A. L.; Hale A. B.; Alp N. J.; Channon K. M. Critical Role for Tetrahydrobiopterin Recycling by Dihydrofolate Reductase in Regulation of Endothelial Nitric-oxide Synthase Coupling. J. Biol. Chem. 2009, 284, 28128–28136. 10.1074/jbc.m109.041483. [DOI] [PMC free article] [PubMed] [Google Scholar]
- Hoshino K.; Kawasaki A.; Mizushima Y.; Yano S. Effect of antiallergic agents and bronchial hypersensitivity in short-term bronchial asthma. Chest 1991, 100, 57–62. 10.1378/chest.100.1.57. [DOI] [PubMed] [Google Scholar]
- Ueda H.; Kadota K.; Imono M.; Ito T.; Kunita A.; Tozuka Y. Co-amorphous Formation Induced by Combination of Tranilast and Diphenhydramine Hydrochloride. J. Pharm. Sci. 2017, 106, 123–128. 10.1016/j.xphs.2016.07.009. [DOI] [PubMed] [Google Scholar]
- Fujimoto K.; Hara M.; Yamada H.; Sakurai M.; Inaba A.; Tomomura A.; Katoh S. Role of the conserved Ser-Tyr-Lys triad of the SDR family in sepiapterin reductase. Chem.-Biol. Interact. 2001, 130–132, 825–832. 10.1016/s0009-2797(00)00238-6. [DOI] [PubMed] [Google Scholar]
- Lange I.; Geerts D.; Feith D. J.; Mocz G.; Koster J.; Bachmann A. S. Novel interaction of ornithine decarboxylase with sepiapterin reductase regulates neuroblastoma cell proliferation. J. Mol. Biol. 2014, 426, 332–346. 10.1016/j.jmb.2013.09.037. [DOI] [PMC free article] [PubMed] [Google Scholar]
- Kawabata Y.; Yamamoto K.; Debari K.; Onoue S.; Yamada S. Novel crystalline solid dispersion of tranilast with high photostability and improved oral bioavailability. Eur. J. Pharm. Sci. 2010, 39, 256–262. 10.1016/j.ejps.2009.12.009. [DOI] [PubMed] [Google Scholar]
- Cronin S. J. F.; Seehus C.; Weidinger A.; Talbot S.; Reissig S.; Seifert M.; Pierson Y.; McNeill E.; Longhi M. S.; Turnes B. L.; Kreslavsky T.; Kogler M.; Hoffmann D.; Ticevic M.; da Luz Scheffer D.; Tortola L.; Cikes D.; Jais A.; Rangachari M.; Rao S.; Paolino M.; Novatchkova M.; Aichinger M.; Barrett L.; Latremoliere A.; Wirnsberger G.; Lametschwandtner G.; Busslinger M.; Zicha S.; Latini A.; Robson S. C.; Waisman A.; Andrews N.; Costigan M.; Channon K. M.; Weiss G.; Kozlov A. V.; Tebbe M.; Johnsson K.; Woolf C. J.; Penninger J. M. The metabolite BH4 controls T cell proliferation in autoimmunity and cancer. Nature 2018, 563, 564–568. 10.1038/s41586-018-0701-2. [DOI] [PMC free article] [PubMed] [Google Scholar]
- Haruki H.; Hovius R.; Pedersen M. G.; Johnsson K. Tetrahydrobiopterin Biosynthesis as a Potential Target of the Kynurenine Pathway Metabolite Xanthurenic Acid. J. Biol. Chem. 2016, 291, 652–657. 10.1074/jbc.c115.680488. [DOI] [PMC free article] [PubMed] [Google Scholar]
- Mooney M. R.; Geerts D.; Kort E. J.; Bachmann A. S. Anti-tumor effect of sulfasalazine in neuroblastoma. Biochem. Pharmacol. 2019, 162, 237–249. 10.1016/j.bcp.2019.01.007. [DOI] [PubMed] [Google Scholar]
- Chidley C.; Haruki H.; Pedersen M. G.; Muller E.; Johnsson K. A yeast-based screen reveals that sulfasalazine inhibits tetrahydrobiopterin biosynthesis. Nat. Chem. Biol. 2011, 7, 375–383. 10.1038/nchembio.557. [DOI] [PubMed] [Google Scholar]
- Harigai R.; Sakai S.; Nobusue H.; Hirose C.; Sampetrean O.; Minami N.; Hata Y.; Kasama T.; Hirose T.; Takenouchi T.; Kosaki K.; Kishi K.; Saya H.; Arima Y. Tranilast inhibits the expression of genes related to epithelial-mesenchymal transition and angiogenesis in neurofibromin-deficient cells. Sci. Rep. 2018, 8, 6069. 10.1038/s41598-018-24484-y. [DOI] [PMC free article] [PubMed] [Google Scholar]
- Papageorgis P.; Polydorou C.; Mpekris F.; Voutouri C.; Agathokleous E.; Kapnissi-Christodoulou C. P.; Stylianopoulos T. Tranilast-induced stress alleviation in solid tumors improves the efficacy of chemo- and nanotherapeutics in a size-independent manner. Sci. Rep. 2017, 7, 46140. 10.1038/srep46140. [DOI] [PMC free article] [PubMed] [Google Scholar]
- Gao L.; Huang S.; Zhang H.; Hua W.; Xin S.; Cheng L.; Guan W.; Yu Y.; Mao Y.; Pei G. Suppression of glioblastoma by a drug cocktail reprogramming tumor cells into neuronal like cells. Sci. Rep. 2019, 9, 3462. 10.1038/s41598-019-39852-5. [DOI] [PMC free article] [PubMed] [Google Scholar]
- Saito H.; Fushida S.; Harada S.; Miyashita T.; Oyama K.; Yamaguchi T.; Tsukada T.; Kinoshita J.; Tajima H.; Ninomiya I.; Ohta T. Importance of human peritoneal mesothelial cells in the progression, fibrosis, and control of gastric cancer: inhibition of growth and fibrosis by tranilast. Gastric Cancer 2018, 21, 55–67. 10.1007/s10120-017-0726-5. [DOI] [PMC free article] [PubMed] [Google Scholar]
- Darakhshan S.; Ghanbari A. Tranilast enhances the anti-tumor effects of tamoxifen on human breast cancer cells in vitro. J. Biomed. Sci. 2013, 20, 76. 10.1186/1423-0127-20-76. [DOI] [PMC free article] [PubMed] [Google Scholar]
- Izumi K.; Mizokami A.; Li Y. Q.; Narimoto K.; Sugimoto K.; Kadono Y.; Kitagawa Y.; Konaka H.; Koh E.; Keller E. T.; Namiki M. Tranilast inhibits hormone refractory prostate cancer cell proliferation and suppresses transforming growth factor β1-associated osteoblastic changes. Prostate 2009, 69, 1222–1234. 10.1002/pros.20975. [DOI] [PubMed] [Google Scholar]
- Suwa S.; Kasubata A.; Kato M.; Iida M.; Watanabe K.; Miura O.; Fukuda T. The tryptophan derivative, tranilast, and conditioned medium with indoleamine 2,3-dioxygenase-expressing cells inhibit the proliferation of lymphoid malignancies. Int. J. Oncol. 2015, 46, 1369–1376. 10.3892/ijo.2015.2825. [DOI] [PubMed] [Google Scholar]
- Leeson P. D.; Davis A. M. Time-related differences in the physical property profiles of oral drugs. J. Med. Chem. 2004, 47, 6338–6348. 10.1021/jm049717d. [DOI] [PubMed] [Google Scholar]
- van de Waterbeemd H.; Camenisch G.; Folkers G.; Chretien J. R.; Raevsky O. A. Estimation of blood-brain barrier crossing of drugs using molecular size and shape, and H-bonding descriptors. J. Drug Targeting 1998, 6, 151–165. 10.3109/10611869808997889. [DOI] [PubMed] [Google Scholar]
- Yang W.; Sabi-Mouka E. M. B.; Wang L.; Shu C.; Wang Y.; Ding J.; Ding L. Determination of tranilast in bio-samples by LC-MS/MS: Application to a pharmacokinetic and brain tissue distribution study in rats. J. Pharm. Biomed. Anal. 2018, 147, 479–484. 10.1016/j.jpba.2017.06.047. [DOI] [PubMed] [Google Scholar]
- Liu Y.; Beyer A.; Aebersold R. On the Dependency of Cellular Protein Levels on mRNA Abundance. Cell 2016, 165, 535–550. 10.1016/j.cell.2016.03.014. [DOI] [PubMed] [Google Scholar]
- Calò V.; Migliavacca M.; Bazan V.; Macaluso M.; Buscemi M.; Gebbia N.; Russo A. STAT proteins: from normal control of cellular events to tumorigenesis. J. Cell. Physiol. 2003, 197, 157–168. 10.1002/jcp.10364. [DOI] [PubMed] [Google Scholar]
- Zimnik S.; Gaestel M.; Niedenthal R. Mutually exclusive STAT1 modifications identified by Ubc9/substrate dimerization-dependent SUMOylation. Nucleic Acids Res. 2008, 37, e30 10.1093/nar/gkp020. [DOI] [PMC free article] [PubMed] [Google Scholar]
- Freire M. A. M.; Guimaraes J. S.; Leal W. G.; Pereira A. Pain modulation by nitric oxide in the spinal cord. Front. Neurosci. 2009, 3, 175–181. 10.3389/neuro.01.024.2009. [DOI] [PMC free article] [PubMed] [Google Scholar]
- Medina M. G.; Lebovic D. I. Endometriosis-associated nerve fibers and pain. Acta Obstet. Gynecol. Scand. 2009, 88, 968–975. 10.1080/00016340903176826. [DOI] [PMC free article] [PubMed] [Google Scholar]
- Yowtak J.; Lee K. Y.; Kim H. Y.; Wang J.; Kim H. K.; Chung K.; Chung J. M. Reactive oxygen species contribute to neuropathic pain by reducing spinal GABA release. Pain 2011, 152, 844–852. 10.1016/j.pain.2010.12.034. [DOI] [PMC free article] [PubMed] [Google Scholar]
- Haruki H.; Pedersen M. G.; Gorska K. I.; Pojer F.; Johnsson K. Tetrahydrobiopterin biosynthesis as an off-target of sulfa drugs. Science 2013, 340, 987–991. 10.1126/science.1232972. [DOI] [PubMed] [Google Scholar]
- Auerbach G.; Herrmann A.; Gutlich M.; Fischer M.; Jacob U.; Bacher A.; Huber R. The 1.25 A crystal structure of sepiapterin reductase reveals its binding mode to pterins and brain neurotransmitters. EMBO J. 1997, 16, 7219–7230. 10.1093/emboj/16.24.7219. [DOI] [PMC free article] [PubMed] [Google Scholar]
- Neves M. A. C.; Totrov M.; Abagyan R. Docking and scoring with ICM: the benchmarking results and strategies for improvement. J. Comput.-Aided Mol. Des. 2012, 26, 675–686. 10.1007/s10822-012-9547-0. [DOI] [PMC free article] [PubMed] [Google Scholar]
- Wang J.; Wang W.; Kollman P. A.; Case D. A. Automatic atom type and bond type perception in molecular mechanical calculations. J. Mol. Graphics Modell. 2006, 25, 247–260. 10.1016/j.jmgm.2005.12.005. [DOI] [PubMed] [Google Scholar]
- Case D.; Betz R.; Cerutti D. S.; Cheatham T.; Darden T.; Duke R.; Giese T. J.; Gohlke H.; Götz A.; Homeyer N.; Izadi S.; Janowski P.; Kaus J.; Kovalenko A.; Lee T.-S.; LeGrand S.; Li P.; Lin C.; Luchko T.; Kollman P. A.. AMBER16; University of California: San Francisco, 2016.
- Darden T.; York D.; Pedersen L. Particle mesh Ewald: An N·log(N) method for Ewald sums in large systems. J. Chem. Phys. 1993, 98, 10089–10092. 10.1063/1.464397. [DOI] [Google Scholar]
- Hopkins C. W.; Le Grand S.; Walker R. C.; Roitberg A. E. Long-Time-Step Molecular Dynamics through Hydrogen Mass Repartitioning. J. Chem. Theory Comput. 2015, 11, 1864–1874. 10.1021/ct5010406. [DOI] [PubMed] [Google Scholar]
- Ryckaert J.-P.; Ciccotti G.; Berendsen H. J. C. Numerical integration of the cartesian equations of motion of a system with constraints: molecular dynamics of n-alkanes. J. Comput. Phys. 1977, 23, 327–341. 10.1016/0021-9991(77)90098-5. [DOI] [Google Scholar]
- Berendsen H. J. C.; Postma J. P. M.; van Gunsteren W. F.; DiNola A.; Haak J. R. Molecular dynamics with coupling to an external bath. J. Chem. Phys. 1984, 81, 3684–3690. 10.1063/1.448118. [DOI] [Google Scholar]
- Roe D. R.; Cheatham T. E. 3rd PTRAJ and CPPTRAJ: Software for Processing and Analysis of Molecular Dynamics Trajectory Data. J. Chem. Theory Comput. 2013, 9, 3084–3095. 10.1021/ct400341p. [DOI] [PubMed] [Google Scholar]
- Humphrey W.; Dalke A.; Schulten K. VMD: Visual molecular dynamics. J. Mol. Graphics 1996, 14, 33–38. 10.1016/0263-7855(96)00018-5. [DOI] [PubMed] [Google Scholar]
Associated Data
This section collects any data citations, data availability statements, or supplementary materials included in this article.


