Abstract
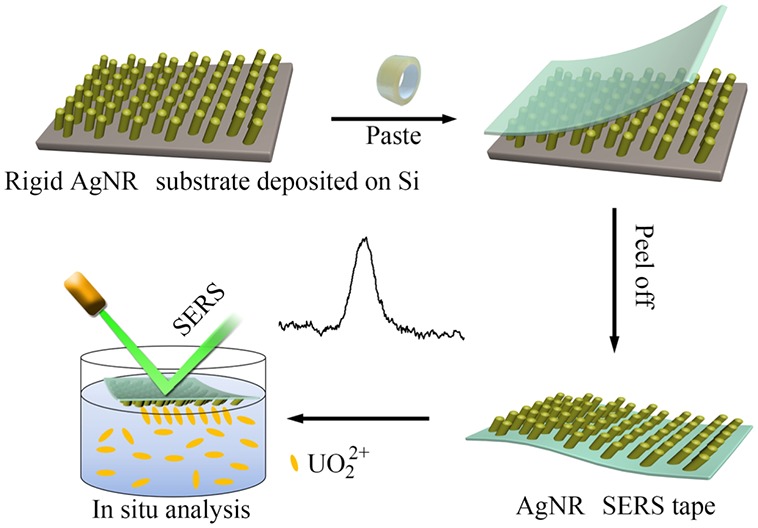
Surface-enhanced Raman spectroscopy (SERS) has been utilized for rapid analysis of uranyl ions (UO22+) on account of its fast response and high sensitivity. However, the difficulty of fabricating a suitable SERS substrate for in situ analysis of uranyl ions severely restricts its practical application. Hence, we proposed flexible and adhesive SERS tape decorated with silver nanorod (AgNR) arrays for in situ detection of UO22+. The SERS tape was fabricated through a simple “paste & peel off” procedure by transferring the slanted AgNR arrays from silicon to the transparent tape surface. UO22+ can be easily in situ detected by placing the AgNR SERS tape into an aqueous solution or pasting it onto the solid matrix surface due to the excellent transparent feature of the tape. The proposed SERS tape with well-distributed AgNRs effectively improved the reproducibility and sensitivity for UO22+ analysis. UO22+ with concentration as low as 100 nM was easily detected. Besides, UO22+ adsorbed on an iron disc and rock surface also can be rapidly in situ detected. With its simplicity and convenience, the AgNR SERS tape-based SERS technique offers a promising approach for environmental monitoring and nuclear accident emergency detection.
Introduction
Uranium (19.2 g/cm3), as one of the key components in nuclear resources, exhibits essential employments in the nuclear industry and weapons.1 Operation of nuclear power stations, nuclear tests, nuclear accidents, and uranium mining have caused considerable uranium-related pollutions upon its release into the environment, which brings long-term health threats to human beings.2,3 The uranyl ion (UO22+) is the most common and thermodynamically stable form of uranium in the natural water environment. It is highly toxic, migratory, and may very easily harm body organs. Thus, rapid analysis of trace UO22+ in the environment has become an attractive issue, especially for nuclear emergency detection when nuclear accidents happen.
Many analytical methods have been developed for UO22+ detection such as electrochemical methods,4 fluorescence spectroscopy,5 UV–vis adsorption spectrometry,6 ICP mass spectrometry (ICP-MS),7 inductively coupled plasma atomic emission spectroscopy (ICP-AES),8 and so on. Despite providing concentration information, those methods lack the capability of enforcing in situ analysis or require time-consuming sample preparation, sophisticated equipment, expert operators, and high cost, limiting their practical applications. Particularly, the sample transportation with radioactivity from the on-site to the laboratory may create security risks and change the sample status where the analytical results cannot truly reflect the sample features. Therefore, it is of great urgency to develop a simple analytic technique available for in situ and real-time monitoring of UO22+.
Surface-enhanced Raman spectroscopy (SERS) is able to detect chemical components with single-molecule sensitivity through their characteristic vibrational fingerprint spectra.9 The high sensitivity mainly originates from electromagnetic enhancement (EM) produced by the noble metallic nanoparticles due to their localized surface plasmonic resonance effect.10,11 The SERS technique has unique core competence for rapid and trace analysis of chemicals on account of its high sensitivity, fast signal response, and no sample pretreatment. In SERS experiments, SERS substrates are the key and indispensable component.12−14 An excellent SERS substrate should have the features of good stability, sensitivity, selectivity, reproducibility, and molecular generality.15 Many efforts have been made for SERS detection of UO22+ by fabricating various SERS-active nanostructures, such as silver nanoparticles,16−18 modified silver nanoparticles,19,20 silver-doped sol–gel films,21 silver nanorods22 or coated silver nanorods,23 gold nanoparticles,24 and so on. Bhandari et al.25 fabricated silver nanoparticles by vapor deposition on polypropylene filters for UO22+ analysis with an LOD of 58 nM. Leverette et al.22 even detected 10 nM uranyl ions by utilizing aligned Ag nanorod SERS substrates. Although some achievements have been made for SERS analysis of UO22+, it is difficult to detect uranyl ions adsorbed on solid surfaces. Most importantly, the in situ detection is still quite deficient. The reason is that the SERS substrates developed for UO22+ detection are rigid and opaque to light. Thus, developing a transparent, flexible, adhesive, and homogeneous SERS substrate with high density of SERS “hot spots” may be the key to solving the above problem.
In this study, flexible and adhesive SERS tape decorated with silver nanorod (AgNR) arrays was utilized as the SERS substrate for in situ detection of UO22+. The SERS tape was fabricated by transferring the slanted AgNR arrays from silicon to the transparent tape surface through a simple “paste & peel off” procedure. Compared with those flexible SERS substrates reported recently, such as polydimethylsiloxane (PDMS),26 adhesive tape,27 and paper28 decorated with gold/silver nanoparticles where the morphology of SERS-active nanostructures is usually hardly controlled, the SERS tape proposed here has homogeneous nanostructures with high density. What is more, the excellent transparency of the tape used here and 2D nanostructures arrays make nondestructive in situ detection possible. UO22+ was in situ analyzed by placing the AgNR SERS tape into an aqueous solution or pasting it onto solid matrixes such as an iron disc or a rock surface. The whole fabrication, storage, and utilization process of the SERS tape is very simple and convenient. The results demonstrate that the AgNR SERS tape-based SERS technique plays a crucial part in the nuclear accident emergency response process.
Results and Discussions
Fabrication of the AgNR SERS Tape and Feasibility for in Situ Detection of UO22+
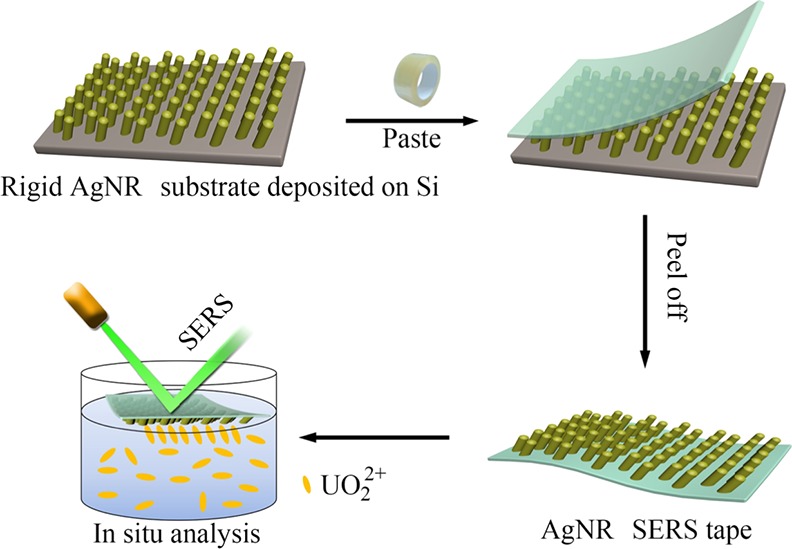
The fabrication and analysis process of the AgNR SERS tape is illustrated in Scheme 1. Adhesive tape is widely used in our daily life, such as encapsulating boxes, fastening daily goods, and removing wrong characters from paper by the “paste & peel off” procedure. Here, we used the transparent adhesive tape to transfer the AgNR arrays deposited on the silicon substrate through the analogous “paste & peel off” process. Then, we placed the AgNR SERS tape on the analyzed solution where UO22+ would be absorbed on the AgNRs due to their strong interaction.25 Thus, UO22+ can be rapidly in situ detected by this simple method.
Scheme 1. Schematic Illustration of the AgNR SERS Tape Fabrication and in Situ Detection of Uranyl Ions in Aqueous Solution.
To investigate the feasibility of the proposed strategy for UO22+ detection, the SERS signal was collected by placing the SERS tape onto a 10–3 M uranyl nitrate aqueous solution, and the results are shown in Figure 1. There is no SERS signal for water. However, a strong, relatively broad, and asymmetric band was obtained centered at 730–790 cm–1 for the uranyl solution, which is attributed to the υ1 symmetric stretch of the uranyl ion. As we can see, the normal O=U=O Raman band of the uranyl nitrate is located at 870 cm–1. The very large shift of the uranyl peak can be explained by the strong charge transfer from the silver to the equatorial plane of the absorbed UO22+, weakening the axial U=O bond intensity, which were also reported in the literature.16,19,25,29 The broad SERS peak of UO22+ with uncertain peak values implies that the interaction between UO22+ and silver is complicated, and there may be several hydrolyzed uranyl complexes absorbed on the silver surface, several interaction modes between them, or both simultaneously. The charge transfer mechanism between them needs further study. Interestingly, Wang et al.30 reported a photoinduced charge transfer enhancement mechanism in the uranyl–Ag2O complex system where the peak centered at 715 cm–1 is assigned to the UO2+ band produced by the reduction of UO22+ through accepting one e–. All in all, the result demonstrated the feasibility of the proposed method for in situ detection of uranyl ions in aqueous solution.
Figure 1.
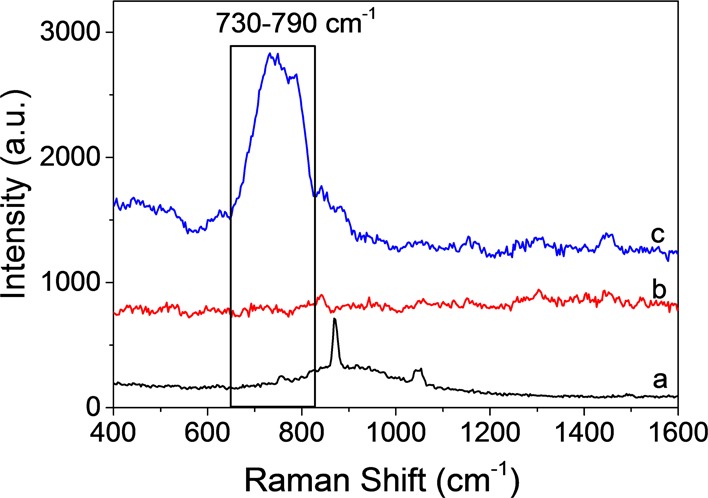
Feasibility of the AgNR SERS tape for in situ detection of uranyl ions in aqueous solution: (a) normal Raman spectrum of solid uranyl nitrate, (b) SERS of the water showing no signal, and (c) SERS of the 10–3 M uranyl nitrate aqueous solution showing a strong signal at 730–790 cm–1.
Morphology Characterization of the AgNR SERS Tape
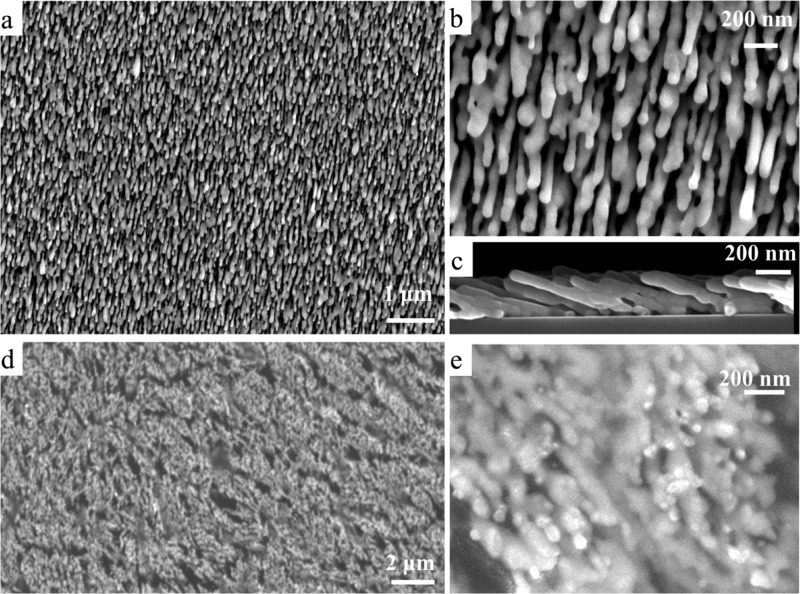
Figure 2 shows the typical SEM images of the AgNR substrate and AgNR SERS tape. It is difficult to deposit homogeneous SERS-active nanostructures with high density of “hot spots” on the flexible substrates, while it is rather easier to do on the rigid silicon surface. The slanted nanorods are well separated and homogeneously distributed on the silicon by the oblique angle deposition method (Figure 2a–c). The thickness of the nanostructures is ∼245 nm with the length of a single nanorod approximately 600 nm. This AgNR array substrate exhibits excellent SERS performance.23,31−33 After being transferred by the transparent adhesive tape through the “paste & peel off” method, the nanorod structure of the SERS tape is still maintained and is dense (Figure 2d,e), which results in the high density of “hot spots”. Thus, the flexible AgNR SERS tape with homogeneous SERS-active nanostructures is easily constructed by this method. The ultrathin 2D nanostructures and the excellent transparency of the tape material make the in situ analysis of the AgNR SERS tape possible. We know that the AgNRs are easy to oxidize or easily adsorb some impure molecules when placed in air,34,35 increasing the storage cost of the rigid AgNR substrate. However, the transparent tape can isolate the AgNRs to prevent them from making direct contact with air for more than 1 month as long as we do not peel off the AgNR SERS tape from the silicon when it is not used (see Figure S1), greatly improving the convenience of storage.
Figure 2.
(a) Top-view SEM image of the AgNR substrate, (b) high-resolution SEM image of (a), (c) side-view SEM image of (a), (d) top-view SEM image of AgNR SERS tape, and (e) high-resolution SEM image of (d).
Analytical Performance of the AgNR SERS Tape for UO22+
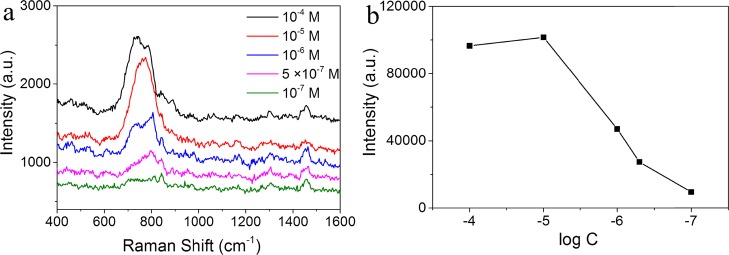
To investigate the performance of the AgNR SERS tape for UO22+ analysis, we measured the uranyl nitrate solutions with different concentrations, as shown in Figure 3. The band intensity for the symmetric stretching band of UO22+ remained the same as the concentration was above 10–5 M, demonstrating the saturated adsorption of UO22+ on the SERS tape. Also, the peak intensity varies with respect to the logarithm of the concentration of aqueous uranyl solution from 10–5 M to 10–7 M (Figure 3b). The detection limit (LOD) for uranyl ions is 100 nM. Table S1 lists the comprehensive comparison results of the proposed SERS tape-based method with others reported in the literature.22,25,36−38 The LOD of our proposed SERS method is better than those of photometry (500 nM)36 and SERS based on modified gold nanoparticles (800 nM),37 showing good sensitivity. The sensitivity is lower than those obtained based on DNAzyme (2 pM)38 or rigid silver nanorod substrates (10 nM),22 while the advantages such as simplicity, rapidness, and in situ function make it a forceful competitor in nuclear emergence detection.
Figure 3.
(a) Concentration-dependent SERS spectra of uranyl ions by AgNR SERS tape. (b) Intensity variation of the uranyl ion symmetric stretching band (centered at 730–780 cm–1, subtracted with the blank signal) with respect to the logarithm value of its concentration.
The apparent enhancement factor (EF) of the AgNR SERS tape for uranyl ions was also calculated from the difference of the UO22+ peak intensity between the SERS and the normal Raman spectra of the uranyl ion solution. The background signal intensity of the AgNR SERS tape was subtracted. The intensity was obtained according to the peak area by using the self-contained calculation programs of the Raman software. The EF value was obtained as the following formula39
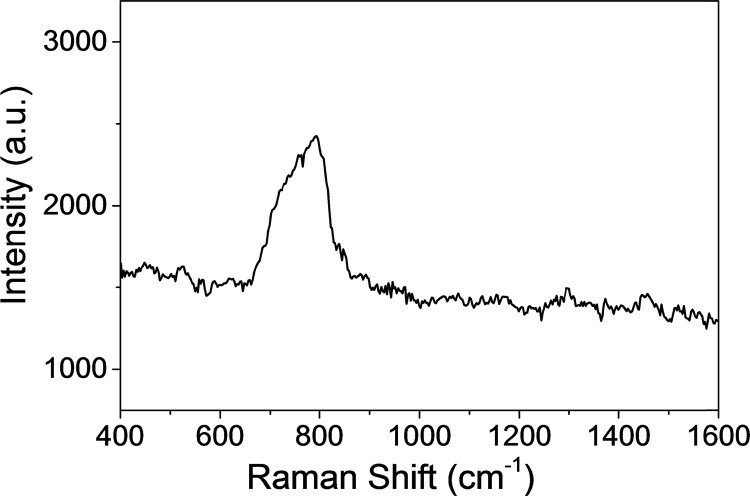
where I, N, T, and P represent the band intensity, the number of absorbed analytes, the exposure time, and the laser power, respectively. Here, we used their concentration to take the place of the number of UO22+ by making the experimental condition the same, that is, 0.05 M uranyl nitrate solution for Raman and 10–6 M for SERS measurements, as shown in Figure 4. The calculated EF for the SERS analysis of uranyl nitrate reaches up to 1.3 × 10⁶. The EF value is comparable with those of previously reported ex situ methods (10–5 for Ag2O aggregates,30 3 × 10⁵ for silver nanoparticle@rGO composites,19 and 1.02 × 10⁶ for AgNR@HfO2 substrates34).
Figure 4.
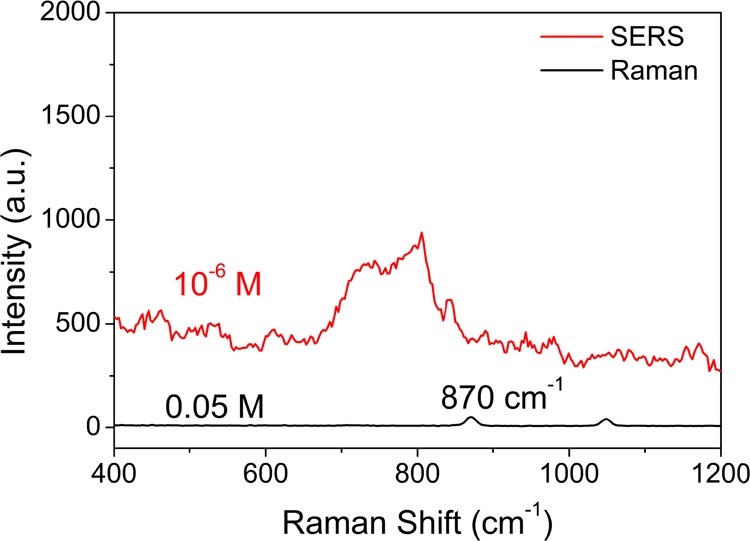
Comparative normal Raman and SERS spectra of uranyl nitrate solution. The exposure time is 10 s for Raman and 1 s for SERS.
To further evaluate the selectivity of the proposed AgNR SERS tape-based SERS strategy for UO22+ analysis, a series of contrast experiments were performed including metals such as Na+, Zn2+, Ca2+, Cu2+, Fe2+, Ni2+, and Cd2+, and the results are shown in Figure 5. These metal ion impurities did not cause the signal enhancement, indicating good selectivity. To test the reproducibility of the proposed strategy for uranyl detection, SERS measurements were performed for five different samples at five different positions on each sample. The relative standard deviations (RSDs) are 7.2 and 6.4%, respectively, showing good reproducibility.
Figure 5.
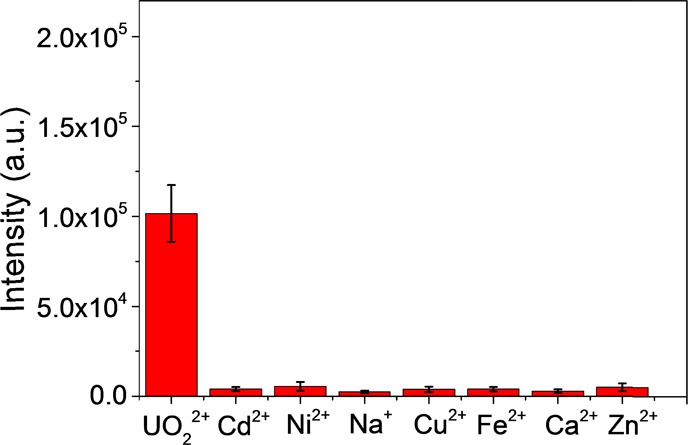
Selectivity of the AgNR SERS tape for UO22+: 10 μM UO22+; 100 μM Cd2+, Na+, Ca2+, Cu2+, Fe2+, Ni2+, and Zn2+.
Analysis of UO22+ in Tap Water
To investigate the validity of the proposed AgNR SERS tape-based SERS strategy to environmental samples, a solution of 10–5 M uranyl ions was added into the tap water sample. The measurement result is shown in Figure 6. The strong SERS signal for the symmetric stretching band of UO22+ was observed. This result indicates that our proposed approach has great potential for rapid in situ analysis of uranyl ions in the environmental samples.
Figure 6.
SERS spectrum of 10–5 M uranyl ions in tap water by the AgNR SERS tape technique.
Analysis of UO22+ Absorbed on the Solid Matrix Surfaces
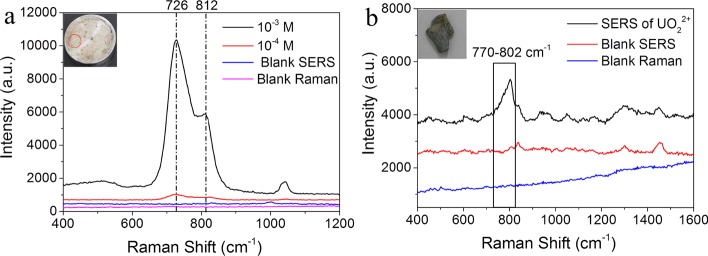
Uranyl ions are distributed not only in the solution but also on the solid matrix surface under certain conditions.40,41 For example, the instruments or mechanical equipment running in radioactive working places will inevitably adsorb uranyl compounds when they are engage in nuclear-related works or nuclear accidents happen, causing health hazard to the workers. Thus, in situ monitoring of the uranyl ion absorbed on these surfaces is significant and meaningful. Solvent extraction- or solid collection-based SERS methods cannot meet the practical need of rapid and real-time monitoring. Hence, we evaluated the application possibility of the AgNR SERS tape for in situ detection of UO22+ from the iron discs. The as-prepared uranyl nitrate solution (10 μL) was spread on the iron disc and dried naturally in air. The SERS spectra were collected by pasting the AgNR tape onto the iron disc surface and pressing the SERS tape with a certain pressure for 4 s, as shown in Figure 7a. The iron disc shows no normal Raman signal and neither in SERS. However, a strong main band centered at 726 cm–1 for the 1 mM uranyl nitrate spread on the iron disc was observed, which is assigned to the symmetric stretching of UO22+ bonding on silver. This very large shift indicates that a plasmon-mediated chemical reaction process may happen, resulting in the reduction of UO22+ to UO2+ with the catalysis of plasmonic silver nanorods.30 Since uranyl species adsorbed on the iron disc have multilayers, there are only electromagnetic enhancements for those UO22+ without direct contact with silver nanorods. Thus, the shoulder peak at 812 cm–1 might be assigned to the UO22+ peak of the EM mechanism. This shift of wavenumbers may be mainly attributed to the contribution of hydrolyzed uranyl complexes.42 The concentration of UO22+ down to 0.1 mM on the iron disc can easily be in situ detected using the AgNR SERS tape. What is more, radioactive nuclides migrate with the water and are adsorbed on the soil and rock surface when nuclear accidents happen. To show the surface generality, the SERS spectra of UO22+ from different surfaces, such as the rocks, were also collected using the SERS tape. The Raman bands of 1 mM UO22+ are clear and can be easily identified (Figure 7b), demonstrating that the proposed AgNR tape-based SERS strategy can be utilized for the qualitative detection of uranyl ions from various actual surfaces.
Figure 7.
In situ SERS spectra of uranyl ions adsorbed on the (a) iron disc and (b) rock surface.
Conclusions
We have demonstrated the AgNR arrays SERS tape-based SERS strategy for the rapid in situ analysis of uranyl ions from actual environments. The adhesive SERS tape decorated with AgNR arrays was fabricated via a simple “paste & peel off” procedure. The uranyl ion in aqueous solution was detected with the LOD of 100 nM. The uranyl ion adsorbed on the iron disc and rock surface is easily detected by pasting the SERS tape on the surfaces. Given the availability of portable Raman spectrometers, uranyl ions can be rapidly and timely analyzed on site with this simple way. It is expected that the AgNR SERS tape-based SERS technique will play the key role in nuclear accident emergency response and environmental monitoring.
Experimental Section
Chemicals and Materials
Uranyl nitrate hexahydrate (UO2(NO3)2·6H2O) was bought from the China National Nuclear Corp. (Lanzhou, China). It was dissolved in ultrapure water to make a 10–2 M stock solution and then diluted to the final concentration before use. The adhesive transparent biaxially oriented polypropylene (BOPP) tape was purchased from the local supermarket. The iron discs were obtained from the laboratory, and the rocks were from the local environment; they were washed three times with ultrapure water before use. All reagents were used without further purification. Milli-Q-grade water (conductivity >18.0 MΩ cm) was used throughout the experiments.
Fabrication of AgNR SERS Tape
Slanted AgNR arrays were fabricated on the silicon substrate via the oblique angle deposition (OAD) method.31 The electron-beam system (GLAD, Thermionics Inc.) was used as the reaction cavity. The background vacuum level was approximately 10–5 Pa. The incident angle of the vapor flux was set at ∼86° off the Si, and the deposition rate was set at 0.75 nm/s. When the thickness of nanostructures reached 1000 nm as read using a quartz crystal microbalance, the deposition process was stopped. To prevent the AgNR substrate from oxidizing and adsorbing other impurities, the transparent adhesive tape was pasted on the AgNRs as soon as it was prepared. The AgNR SERS tape was fabricated by peeling off the tape carefully from the AgNR substrate via using the strong adhesive force of the tape. Raman measurements were conducted by placing or pasting the SERS tape onto the appointed positions.
In Situ SERS Detection of UO22+ by the AgNR SERS Tape
For detection of UO22+ in aqueous solutions, the AgNR SERS tape was peeled off from the Si surface, cut into an area of ∼0.3 × 0.3 cm2, and placed onto the solution immediately. The Raman signal was collected using a Raman spectrometer. For detection of UO22+ adsorbed on the solid iron disc and rock surface, 5 μL of the uranyl nitrate solution was dispersed onto the solid surface, and the AgNR SERS tape was pasted on the surface for Raman measurements. Due to the adhesion feature of the AgNR SERS tape, it will tightly touch the surface, producing excellent sensitivity.
Characterization and Raman Measurements
A field emission scanning electron microscope (ZEISS, MERLIN Compact) was used to obtain the scanning electron microscopy (SEM) images. All the SERS measurements were done on a LabRam Xplora confocal Raman spectrometer (Horiba Jobin Yvon). The laser excitation used in the experiment was 532 nm. The laser powers are approximately 12.5 mW for in situ SERS analysis of UO22+ in the aqueous solution with a collection time of 1 s and 0.25 mW on the iron disc and rock surface with a collection time of 10 s. The Raman scattering signal was collected with a numerical aperture (NA) microscope objective from Olympus (50×, NA = 0.5).
Acknowledgments
This study was financially supported by the China Academy of Engineering Physics for the sponsored research (TCSQ2016203), the Radiochemical Discipline 909 Funds by the China Academy of Engineering Physics (no. XK909-2), the Project of Environmental Protection and Occupational Health by the China Academy of Engineering Physics, and the Natural Science Foundation of China (no. 61805216).
Supporting Information Available
The Supporting Information is available free of charge on the ACS Publications website at DOI: 10.1021/acsomega.9b01574.
Air stability study of the AgNR SERS tape and an overview of the methods for uranyl ion detection (PDF)
The authors declare no competing financial interest.
Supplementary Material
References
- Faa A.; Gerosa C.; Fanni D.; Floris G.; Eyken P. V.; Lachowicz J. I.; Nurchi V. M. Depleted uranium and human health. Curr. Med. Chem. 2018, 25, 49–64. 10.2174/0929867324666170426102343. [DOI] [PubMed] [Google Scholar]
- Biswas B.; Mougel V.; Pécaut J.; Mazzanti M. Base-driven assembly of large uranium oxo/hydroxo clusters. Angew. Chem. Int. Ed. Engl. 2011, 50, 5745–5748. 10.1002/anie.201101327. [DOI] [PubMed] [Google Scholar]
- Maher K.; Bargar J. R.; Brown G. E. Jr. Environmental speciation of actinides. Inorg. Chem. 2012, 52, 3510–32. 10.1021/ic301686d. [DOI] [PubMed] [Google Scholar]
- Yun W.; Jiang J.; Cai D.; Wang X.; Sang G.; Liao J.; Lu T.; Yan K. Ultrasensitive electrochemical detection of UO22+ based on DNAzyme and isothermal enzyme-free amplification. RSC Adv. 2016, 6, 3960–3966. 10.1039/c5ra22773a. [DOI] [Google Scholar]
- Yun W.; Wu H.; Liu X.; Zhong H.; Fu M.; Yang L.; Huang Y. Ultra-sensitive fluorescent and colorimetric detection of UO22+ based on dual enzyme-free amplification strategies. Sens. Actuators, B 2018, 255, 1920–1926. 10.1016/j.snb.2017.08.205. [DOI] [Google Scholar]
- Hosseini-Bandegharaei A.; Sarwghadi M.; Heydarbeigi A.; Hosseini S. H.; Nedaie M. Solid-phase extraction of trace amounts of uranium (VI) in environmental water samples using an extractant-impregnated resin followed by detection with UV-Vis spectrophotometry. J. Chem. 2013, 2013, 671564. 10.1155/2013/671564. [DOI] [Google Scholar]
- Xu M.; Frelon S.; Simon O.; Lobinski R.; Mounicou S. Development of a non-denaturing 2D gel electrophoresis protocol for screening in vivo uranium-protein targets in Procambarus clarkii with laser ablation ICP MS followed by protein identification by HPLC–Orbitrap MS. Talanta 2014, 128, 187–195. 10.1016/j.talanta.2014.04.065. [DOI] [PubMed] [Google Scholar]
- Déjeant A.; Bourva L.; Sia R.; Galoisy L.; Calas G.; Phrommavanh V.; Descostes M. Field analyses of 238 U and 226 Ra in two uranium mill tailings piles from Niger using portable HPGe detector. J. Environ. Radioact. 2014, 137, 105–112. 10.1016/j.jenvrad.2014.06.012. [DOI] [PubMed] [Google Scholar]
- Chang T.-W.; Wang X.; Mahigir A.; Veronis G.; Liu G. L.; Gartia M. R. Marangoni convection assisted single molecule detection with nanojet surface enhanced Raman spectroscopy. ACS sensors 2017, 2, 1133–1138. 10.1021/acssensors.7b00427. [DOI] [PubMed] [Google Scholar]
- Schlücker S. Surface-enhanced Raman spectroscopy: concepts and chemical applications. Angew. Chem. Int. Ed. Engl. 2014, 53, 4756–4795. 10.1002/anie.201205748. [DOI] [PubMed] [Google Scholar]
- Zong C.; Xu M.; Xu L.-J.; Wei T.; Ma X.; Zheng X.-S.; Hu R.; Ren B. Surface-enhanced Raman spectroscopy for bioanalysis: reliability and challenges. Chem. Rev. 2018, 118, 4946–4980. 10.1021/acs.chemrev.7b00668. [DOI] [PubMed] [Google Scholar]
- Liu Z.; Cheng L.; Zhang L.; Jing C.; Shi X.; Yang Z.; Long Y.; Fang J. Large-area fabrication of highly reproducible surface enhanced Raman substrate via a facile double sided tape-assisted transfer approach using hollow Au–Ag alloy nanourchins. Nanoscale 2014, 6, 2567–2572. 10.1039/C3NR05840A. [DOI] [PubMed] [Google Scholar]
- Qu L.-L.; Li D.-W.; Xue J.-Q.; Zhai W.-L.; Fossey J. S.; Long Y.-T. Batch fabrication of disposable screen printed SERS arrays. Lab Chip 2012, 12, 876–881. 10.1039/C2LC20926H. [DOI] [PubMed] [Google Scholar]
- Qu L.; Wang N.; Xu H.; Wang W.; Liu Y.; Kuo L.; Yadav T. P.; Wu J.; Joyner J.; Song Y.; Li H.; Lou J.; Vajtai R.; Ajayan P. M. Gold Nanoparticles and g-C3N4-Intercalated Graphene Oxide Membrane for Recyclable Surface Enhanced Raman Scattering. Adv. Funct. Mater. 2017, 27, 1701714. 10.1002/adfm.201701714. [DOI] [Google Scholar]
- Panneerselvam R.; Liu G.-K.; Wang Y.-H.; Liu J.-Y.; Ding S.-Y.; Li J.-F.; Wu D.-Y.; Tian Z.-Q. Surface-enhanced Raman spectroscopy: bottlenecks and future directions. Chem. Commun. 2018, 54, 10–25. 10.1039/C7CC05979E. [DOI] [PubMed] [Google Scholar]
- Dai S.; Lee Y.-H.; Yong J. P. Observation of the Surface-Enhanced Raman Scattering Spectrum of Uranyl Ion. Appl. Spectrosc. 1996, 50, 536–537. 10.1366/0003702963906122. [DOI] [Google Scholar]
- Burneau A.; Teiten B. Surface-enhanced raman spectra of both uranyl VI and 2-(5-bromo-2-pyridylazo)-5-diethylaminophenol in silver colloids. Vib. Spectrosc. 1999, 21, 97–109. 10.1016/S0924-2031(99)00048-X. [DOI] [Google Scholar]
- Tsushima S.; Nagasaki S.; Tanaka S.; Suzuki A. A Raman spectroscopic study of uranyl species adsorbed onto colloidal particles. J. Phys. Chem. B 1998, 102, 9029–9032. 10.1021/jp9823650. [DOI] [Google Scholar]
- Dutta S.; Ray C.; Sarkar S.; Pradhan M.; Negishi Y.; Pal T. Silver nanoparticle decorated reduced graphene oxide (rGO) nanosheet: a platform for SERS based low-level detection of uranyl ion. ACS Appl. Mater. Interfaces 2013, 5, 8724–32. 10.1021/am4025017. [DOI] [PubMed] [Google Scholar]
- Jiang J.; Wang S.; Deng H.; Wu H.; Chen J.; Liao J. Rapid and sensitive detection of uranyl ion with citrate-stabilized silver nanoparticles by the surface-enhanced Raman scattering technique. R. Soc. Open Sci. 2018, 5, 181099. 10.1098/rsos.181099. [DOI] [PMC free article] [PubMed] [Google Scholar]
- Bao L.; Mahurin S. M.; Haire R. G.; Dai S. Silver-doped sol– gel film as a surface-enhanced Raman scattering substrate for detection of uranyl and neptunyl ions. Anal. Chem. 2003, 75, 6614–6620. 10.1021/ac034791+. [DOI] [PubMed] [Google Scholar]
- Leverette C. L.; Villa-Aleman E.; Jokela S.; Zhang Z.; Liu Y.; Zhao Y.; Smith S. A. Trace detection and differentiation of uranyl(VI) ion cast films utilizing aligned Ag nanorod SERS substrates. Vib. Spectrosc. 2009, 50, 143–151. 10.1016/j.vibspec.2008.10.006. [DOI] [Google Scholar]
- Jiang J.; Ma L.; Chen J.; Zhang P.; Wu H.; Zhang Z.; Wang S.; Yun W.; Li Y.; Jia J.; Liao J. SERS detection and characterization of uranyl ion sorption on silver nanorods wrapped with Al2O3 layers. Microchim. Acta 2017, 184, 2775–2782. 10.1007/s00604-017-2286-0. [DOI] [Google Scholar]
- Ruan C.; Wang W.; Gu B. Surface-enhanced Raman scattering for perchlorate detection using cystamine-modified gold nanoparticles. Anal. Chim. Acta 2006, 567, 114–120. 10.1016/j.aca.2006.01.097. [DOI] [PubMed] [Google Scholar]
- Bhandari D.; Wells S. M.; Retterer S. T.; Sepaniak M. J. Characterization and detection of uranyl ion sorption on silver surfaces using surface enhanced Raman spectroscopy. Anal. Chem. 2009, 81, 8061–8067. 10.1021/ac901266f. [DOI] [PubMed] [Google Scholar]
- Kumar S.; Goel P.; Singh J. P. Flexible and robust SERS active substrates for conformal rapid detection of pesticide residues from fruits. Sens. Actuators, B 2017, 241, 577–583. 10.1016/j.snb.2016.10.106. [DOI] [Google Scholar]
- Chen J.; Huang Y.; Kannan P.; Zhang L.; Lin Z.; Zhang J.; Chen T.; Guo L. Flexible and adhesive surface Enhance Raman scattering active tape for rapid detection of pesticide residues in fruits and vegetables. Anal. Chem. 2016, 88, 2149–2155. 10.1021/acs.analchem.5b03735. [DOI] [PubMed] [Google Scholar]
- Lee M.; Oh K.; Choi H.-K.; Lee S. G.; Youn H. J.; Lee H. L.; Jeong D. H. Subnanomolar sensitivity of filter paper-based SERS sensor for pesticide detection by hydrophobicity change of paper surface. ACS sensors 2018, 3, 151–159. 10.1021/acssensors.7b00782. [DOI] [PubMed] [Google Scholar]
- Wang S.; Jiang J.; Wu H.; Jia J.; Shao L.; Tang H.; Ren Y.; Chu M.; Wang X. Self-assembly of silver nanoparticles as high active surface-enhanced Raman scattering substrate for rapid and trace analysis of uranyl (VI) ions. Spectrochim. Acta, Part A 2017, 180, 23–28. 10.1016/j.saa.2017.02.042. [DOI] [PubMed] [Google Scholar]
- Wang S.; Yang S.; Wu H.; Jiang J.; Shao L.; Ren Y.; Li Y.; Liang C.; Chu M.; Wang X. The contribution of photoinduced charge-transfer enhancement to the SERS of uranyl (VI) in a uranyl-Ag2O complex. Sci. Bull. 2019, 64, 315–320. 10.1016/j.scib.2019.01.025. [DOI] [PubMed] [Google Scholar]
- Ma L.; Huang Y.; Hou M.; Xie Z.; Zhang Z. Silver Nanorods Wrapped with Ultrathin Al2O3 Layers Exhibiting Excellent SERS Sensitivity and Outstanding SERS Stability. Sci. Rep. 2015, 5, 12890. 10.1038/srep12890. [DOI] [PMC free article] [PubMed] [Google Scholar]
- Zhou Q.; Li Z.; Yang Y.; Zhang Z. Arrays of aligned, single crystalline silver nanorods for trace amount detection. J. Phys. D: Appl. Phys. 2008, 41, 152007. 10.1088/0022-3727/41/15/152007. [DOI] [Google Scholar]
- Ma L.; Zhang Z.; Li X. Effects of Ti transition layers and thermal annealing on the adhesive property of Ag nanorods-based SERS sensors. Appl. Surf. Sci. 2019, 476, 363–368. 10.1016/j.apsusc.2019.01.129. [DOI] [Google Scholar]
- Wang S.; Zou S.; Yang S.; Wu H.; Jia J.; Li Y.; Zhang Z.; Jiang J.; Chu M.; Wang X. HfO2-wrapped slanted Ag nanorods array as a reusable and sensitive SERS substrate for trace analysis of uranyl compounds. Sens. Actuators, B 2018, 265, 539–546. 10.1016/j.snb.2018.03.062. [DOI] [Google Scholar]
- Ma L.; Wu H.; Huang Y.; Zou S.; Li J.; Zhang Z. High-performance real-time SERS detection with recyclable Ag Nanorods@HfO2 Substrates. ACS Appl. Mater. Interfaces 2016, 8, 27162–27168. 10.1021/acsami.6b10818. [DOI] [PubMed] [Google Scholar]
- Liang Y.; He Y. Arsenazo III-functionalized gold nanoparticles for photometric determination of uranyl ion. Microchim. Acta 2016, 183, 407–413. 10.1007/s00604-015-1659-5. [DOI] [Google Scholar]
- Ruan C.; Luo W.; Wang W.; Gu B. Surface-enhanced Raman spectroscopy for uranium detection and analysis in environmental samples. Anal. Chim. Acta 2007, 605, 80–86. 10.1016/j.aca.2007.10.024. [DOI] [PubMed] [Google Scholar]
- Yun W.; Cai D.; Jiang J.; Wang X.; Liao J.; Zhang P.; Sang G. An ultrasensitive electrochemical biosensor for uranyl detection based on DNAzyme and target-catalyzed hairpin assembly. Microchim. Acta 2016, 183, 1425–1432. 10.1007/s00604-016-1778-7. [DOI] [Google Scholar]
- Van Duyne R. P.; Hulteen J. C.; Treichel D. A. Atomic force microscopy and surface-enhanced Raman spectroscopy. I. Ag island films and Ag film over polymer nanosphere surfaces supported on glass. J. Chem. Phys. 1993, 99, 2101–2115. 10.1063/1.465276. [DOI] [Google Scholar]
- Farzin L.; Shamsipur M.; Sheibani S.; Samandari L.; Hatami Z. A review on nanomaterial-based electrochemical, optical, photoacoustic and magnetoelastic methods for determination of uranyl cation. Microchim. Acta 2019, 186, 289. 10.1007/s00604-019-3426-5. [DOI] [PubMed] [Google Scholar]
- Jo Y.; Lee J.-Y.; Yun J.-I. Adsorption of uranyl tricarbonate and calcium uranyl carbonate onto γ-alumina. Appl. Geochem. 2018, 94, 28–34. 10.1016/j.apgeochem.2018.05.004. [DOI] [Google Scholar]
- Nguyen Trung C.; Begun G. M.; Palmer D. A. Aqueous uranium complexes. 2. Raman spectroscopic study of the complex formation of the dioxouranium(VI) ion with a variety of inorganic and organic ligands. Inorg. Chem. 1992, 31, 5280–5287. 10.1021/ic00051a021. [DOI] [Google Scholar]
Associated Data
This section collects any data citations, data availability statements, or supplementary materials included in this article.


