Abstract
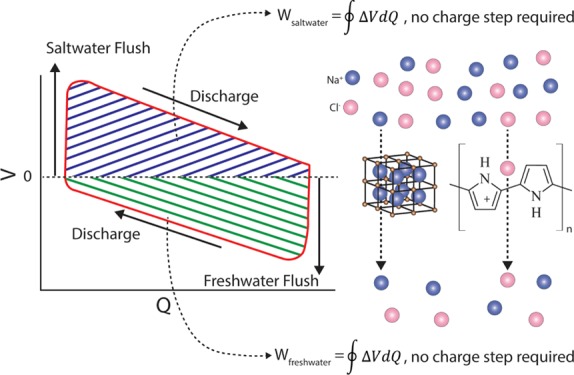
Salinity gradients are a vast and untapped energy resource. For every cubic meter of freshwater that mixes with seawater, approximately 0.65 kW h of theoretically recoverable energy is lost. For coastal wastewater treatment plants that discharge to the ocean, this energy, if recovered, could power the plant. The mixing entropy battery (MEB) uses battery electrodes to convert salinity gradient energy into electricity in a four-step process: (1) freshwater exchange; (2) charging in freshwater; (3) seawater exchange; and (4) discharging in seawater. Previously, we demonstrated a proof of concept, but with electrode materials that required an energy investment during the charging step. Here, we introduce a charge-free MEB with low-cost electrodes: Prussian Blue (PB) and polypyrrole (PPy). Importantly, this MEB requires no energy investment, and the electrode materials are stable with repeated cycling. The MEB equipped with PB and PPy achieved high voltage ratios (actual voltages obtained divided by the theoretical voltages) of 89.5% in wastewater effluent and 97.6% in seawater, with over 93% capacity retention after 50 cycles of operation and 97–99% over 150 cycles with a polyvinyl alcohol/sulfosuccinic acid (PVA/SSA) coating on the PB electrode.
Introduction
Salinity gradient energy, also referred to as “blue energy”, exists in estuaries when freshwater and seawater mix. Globally, the potential blue energy from mixing river water with seawater is estimated as 2 TW.1 Tapping these sources of blue energy would be challenging. A feasible starting point would be wastewater treatment plants that already discharge to saline environments. Current wastewater treatment is energy-intensive, accounting for 3% of the nation’s electrical energy load.2 For coastal treatment plants, a significant untapped source of energy is the salinity difference between treated wastewater (∼30 mM NaCl) and the ocean (∼600 mM NaCl). This salinity gradient creates a theoretically recoverable energy of 0.65 kW h per m3 of freshwater.3 Globally, the theoretically recoverable energy from wastewater treatment plants is estimated at 18 GW.1 Using a small mixing entropy battery (MEB), we recovered 0.44 kW h/m3 (68% efficiency) by alternately flushing a series of MEBs with treated wastewater effluent with seawater.3 If a similar efficiency can be achieved at full-scale, the energy produced would be sufficient to meet much or even all of the electrical energy demands for conventional wastewater treatment of 0.4–0.65 kW h/m3 (ref (4)).
Previous researchers have sought to recover salt gradient energy through a range of means. The most tested are pressure retarded osmosis (PRO)1,4−12 and reverse electrodialysis (RED).bib11,10−23 Neither has yet achieved commercial viability. Membrane-free methods include vapor compression,24 technology based on swelling and shrinking of hydrogels,25 and the capacitive mixing (CAPMIX) family of technologies,26−30 including a device based on capacitive double layer expansion (CDLE),31,32 devices based on the capacitive Donnan potential (CDP),33−37 and the MEB.3,38,39
In the MEB, electrodes are alternately flushed with seawater and freshwater. In these exchanges, Na+ and Cl– ions migrate into and out of the electrodes, driving redox changes within the electrodes and transfer of electrons through an external circuit from one electrode to the other. In a proof-of-concept study, we tested the MEB with real wastewater effluent and real seawater, using a sodium manganese oxide (NMO) cationic electrode and Ag/AgCl anionic electrode.3 Although energy recovery efficiency was high (68%), there were several drawbacks: (1) the Ag/AgCl electrode was costly and soluble in seawater; (2) the NMO electrode was also costly and had a low specific capacity; and (3) operation of the MEB required a charging step with an upfront energy investment, increasing the complexity of operation.
In this study, we introduce a charge-free MEB enabled by low-cost electrode materials. Prussian Blue (PB) is used as the cationic electrode material. PB and its analogues have an open-framework structure with a general formula of AxPR(CN)6·nH2O, in which R(CN)6 is a hexacyanometallate group forming the cubic structure; P is a transition metal cation; and A is the interstitial site, which can be occupied by alkali cations. The open-framework structure allows fast insertion/extraction of alkali cations into/from the interstitial sites. Using PB and its analogues as electrode materials, researchers have achieved >1000 cycles of stable operation in aqueous electrolyte batteries,40−42 and PB is widely used as a pigment and medicine at a cost of <$1/kg. For the anionic electrode material, we selected polypyrrole (PPy). Researchers have explored the use of PPy with p-type doping as an electrode material in batteries,43,44 chloride ion sensors,45 and deionization devices,46 at a bulk industrial cost of <$3/kg. These applications have demonstrated capacity for reversible redox reactions with Cl– and changes in the PPy potential that correlate with Cl– concentration.45 By matching potentials of the PPy electrode with those of the PB electrode, we were able to eliminate energy investment in the charge step. The result is a charge-free MEB with inexpensive electrode materials.
Results and Discussion
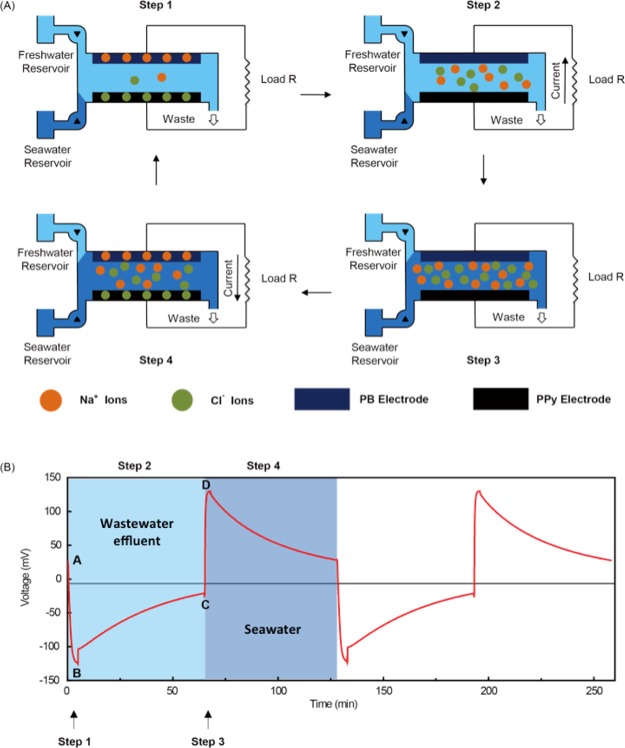
The MEB recovers energy through a four-step cycle (Figure 1A). Step 1 is a rapid exchange of seawater by wastewater effluent. During Step 2, Na+ and Cl– are released from the electrodes into the solution, and the current flows from the anionic electrode to the cationic electrode. Step 3 is a rapid exchange of wastewater effluent by seawater. During Step 4, Na+ and Cl– are reincorporated into the electrodes, and the current flow reverses. In all prior studies of the MEB, the potential of the cationic electrode was greater than the potential of the anionic electrode, resulting in positive MEB voltage throughout the cycle. Step 2 was thermodynamically unfavorable in previous work3,38 and thus required an energy input because the current flows from the electrode with lower potential to the one with higher potential. Step 4 was thermodynamically favorable, allowing energy recovery. Overall, net energy recovery results because the energy invested in Step 2 is less than the energy recovered in Step 4.3 However, the upfront energy investment requires an additional power supply and charge controller and makes the system more expensive and complex.
Figure 1.
(A) Schematic of the MEB and the four-step energy recovery cycle; (B) energy recovery cycle of the charge-free MEB equipped with a PB cationic electrode and a PPy anionic electrode flushed with real seawater and wastewater effluent.
The energy investment in Step 2 can be avoided by matching electrode materials in such a way that the battery voltage is positive during the seawater flush and becomes negative during the freshwater flush (Figure 1B). When flushed with freshwater (Step 1), the voltage becomes negative. In Step 2, ions are released with no energy investment, and current flows spontaneously from the anionic electrode to the cationic electrode. In Step 3, seawater displaces the freshwater, and the voltage becomes positive. In Step 4, ions spontaneously leave the solution phase and enter the electrodes. Current reverses direction, spontaneously flowing from the cationic electrode to the anionic electrode (Step 4). Energy is thus recovered during both the freshwater flush (43.6% of the total energy recovered) and the seawater flush (56.4% of the total energy recovered), with no upfront energy investment. The discrepancy between the energy capture between the freshwater and seawater are a result of a reduced electrolyte resistance in seawater, leading to lower ohmic resistance and greater net energy capture. To enable charge-free MEB operation, the potential of the cationic electrode and anionic electrode should be chosen to enable reversible discharge to a final voltage of zero.
Cationic Electrode
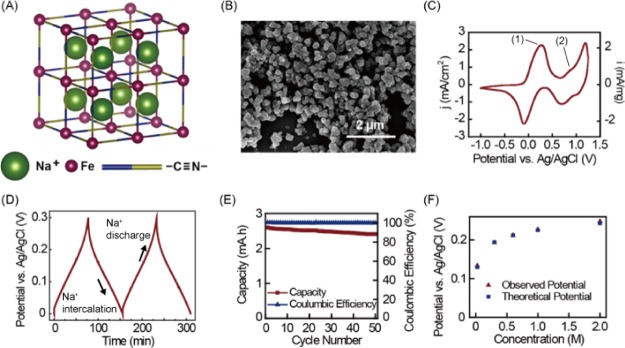
In this study, we chose PB as the cationic electrode material, in which R(CN)6 is Fe2+(CN)6, and P is Fe3+ (Figure 2A). PB was synthesized by a solution-based reaction by mixing a 0.5 M FeCl3 solution with a 0.5 M Na3Fe(CN)6 solution at pH = 2 (see the Supporting Information for the detailed process). This reaction yields PB in its oxidized state (also called Berlin Green). We chose to synthesize Prussian Blue in its oxidized state because this state is easier to synthesize in a crystalline form. The synthesized PB sample was then coated onto a carbon cloth current collector with a slurry coating method (see the Supporting Information for the detailed process). Because PB can become unstable and solubilize at neutral pH, a Na+-permeable polyvinyl alcohol/sulfosuccinic acid (PVA/SSA) coating was also used to prevent particle loss (see the Supporting Information for the coating procedure). Figure 2B shows the SEM image of a carbon cloth electrode coated with the synthesized PB particles. The particle size is around 500 nm. Figure 2C shows the cyclic voltammetry of the PB electrode in a 0.6 M NaCl solution. We observed two redox couple peaks (Peak 1 at 0.22 V and Peak 2 at 0.9 V on Figure 2C) during both the oxidation sweep and reduction sweep. Peak 1 indicates the reaction between the more reduced Na2FeII[FeII(CN)6] (to the left of Peak 1) and NaFeIII[FeII(CN)6] (to the right of Peak 1). Peak 2 indicates the reaction between NaFeIII[FeII(CN)6] (to the left of Peak 2) and FeIII[FeIII(CN)6] (to the right of Peak 2). At higher potentials, the oxidation peak and reduction peak are not symmetric, indicating irreversible oxidation to FeIII[FeIII(CN)6] and dissolution of PB. To avoid this irreversible reaction, the PB electrode must be cycled at a potential less than 0.3 V versus Ag/AgCl.
Figure 2.
(A) Crystal structure of PB showing the open-framework structure, allowing insertion and extraction of Na+; (B) scanning electron microscopy image of the PB electrode; (C) cyclic voltammetry of the PB electrode in a 0.6 M NaCl solution; (D) galvanostatic cycle of the PB electrode in a 0.6 M NaCl solution; (E) cycling performance of the PB electrode, showing the coulombic efficiency and discharge capacity over 50 cycles; (F) PB electrode potential changed with different NaCl concentrations (0.024, 0.3, 0.6, 1, and 2 M).
Figure 2D illustrates the reproducible galvanostatic cycle of the PB electrode between 0 and 0.3 V. The fixed slope is evidence of a single-phase reaction. Figure 2E shows the cycling performance of the PB electrode in a 0.6 M NaCl solution. During this test, the PB electrode was charged and discharged between 0 and 0.3 V at a constant current of 2 mA for 50 times. The coulombic efficiency was close to 100% (ranging from 99.9 to 100.6%) with 93% capacity retention after 50 cycles. We also tested the sensitivity of PB electrode potential to NaCl concentration change. As shown in Figure 2F, the PB electrode potential increased from 0.133 to 0.248 V when the NaCl concentration increased from 0.024 to 2 M, close to the theoretical values calculated from the Nernst equation (see the Supporting Information for calculation details). The response is quick, with the potential stabilizing within 10 s or less after the solution exchange at all NaCl concentrations tested. To prevent attrition of PB with long-term use, a PVA/SSA coating on the PB electrode showed improved capacity retention over 150 cycles (approximately 15 days of continuous cycling), seen in Figure S1. The columbic efficiency remained at ∼100%, while the capacity retention was 96% for the initial 50 cycles, 97% from 50th to 150th cycle and 99% from 100th to 150th cycle. A PVA concentration of at least 10% was required in the coating, otherwise an adverse effect on coulombic efficiency was observed (Figure S2).
Anionic Electrode
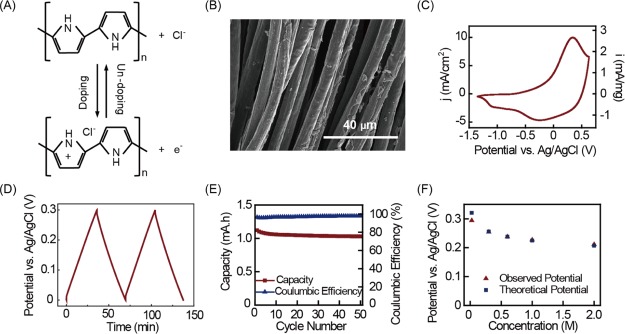
The PPy electrode was synthesized by electrochemically polymerizing pyrrole onto a carbon cloth current collector, using a supporting solution with 0.1 M pyrrole and 1 M NaCl (see the Supporting Information for the detailed process). Figure 3A shows the doping/undoping process of PPy by Cl–. Figure 3B shows the SEM image of the PPy electrode with the polymer coated uniformly around the carbon cloth fibers. Figure 3C shows the cyclic voltammetry of the PPy electrode. One peak occurred during oxidation (0.4 V) and two peaks occurred during reduction (−0.25 and −1.1 V). This is consistent with the findings of Yongfang et al. that PPy has two doping sites.47 The oxidation peak (0.4 V) and reduction peak (−0.25 V) indicate the reversible deinsertion and reinsertion of anions (Cl– in this case) at the traditional doping site with positively charged conjugated chains. The reduction peak at lower potential corresponds to doping at the second site with the protonated pyrrole unit. The second reduction disrupts the conjugated chain and thus decreased the conductivity of PPy.
Figure 3.
(A) Cl– doping and undoping on PPy; (B) scanning electron microscopy image of a carbon cloth electrode coated with PPy by electrochemical polymerization; (C) cyclic voltammetry of the PPy electrode in a 0.6 M NaCl solution; (D) galvanostatic cycle of the PPy electrode in a 0.6 M NaCl solution; (E) cycling performance of the PPy electrode: showing the coulombic efficiency and discharge capacity over 50 cycles; and (F) PPy electrode potential changed with different NaCl concentrations (0.024, 0.3, 0.6, 1, and 2 M).
As an anionic electrode in a charge-free MEB, the potential of the PPy electrode should match that of the PB cationic electrode. When cycled within the same range (0–0.3 V) as the PB electrode, doping at the second site is avoided. Figure 3D shows the galvanostatic potential profile of the PPy electrode in a 0.6 M NaCl solution. In the potential range between 0 and 0.3 V, the only reaction at the PPy electrode is doping/undoping of Cl– at the first site, so no change in slope is observed. The PPy electrode also showed excellent cycling performance in this potential range with close to 100% coulombic efficiency (ranging from 95.7 to 97.8%) and 92% capacity retention through 50 cycles (Figure 3E). We also tested the sensitivity of PPy electrode potential to NaCl concentration: as the NaCl concentration increased from 0.024 to 2 M, the PPy electrode potential decreased from 0.294 to 0.211 V (Figure 3F). This change was close to the theoretical value calculated from the Nernst equation, and the response was quick, stabilizing within 10 s after the solution exchange.
Full Cell
Both the PB electrode and PPy electrode exhibited excellent electrochemical properties within an overlapping potential range. To test the feasibility of the charge-free concept, we constructed a plate-shaped MEB with the PB electrode as the cationic electrode and the PPy electrode as the anionic electrode (see Figure S3 for photographs and the Supporting Information for the detailed process). The battery was connected to a 300 Ω resistor. A potentiostat (Bio-logic SP-50) was used to monitor energy production. During MEB operation, we flushed the cell with alternating hourly exchanges of wastewater effluent and seawater. The freshwater was treated wastewater effluent from the Palo Alto Regional Water Quality Control Plant (0.032 M salinity), and the seawater was collected from the Pacific Ocean at Half Moon Bay, CA (0.6 M salinity). Both the PB electrode and the PPy electrode were precycled to the same potential (0.15 V) in seawater as the starting point. A full-cell energy recovery cycle of the charge-free MEB is shown in Figure 1B. The cycle begins at Point A where the potentials of the PB electrode and the PPy electrode are the same in seawater, giving a full-cell voltage close to 0 V. In Step 1, we replace the electrolyte with wastewater effluent. Because the salinity decreases, the MEB voltage decreases to −130 mV (Point B). In Step 2, the MEB discharges in wastewater effluent until the potentials of the two electrodes become approximately equal (Point C). In Step 3, we replace the electrolyte with seawater, and the MEB voltage increases to +130 mV (Point D). In Step 4, the MEB discharges in seawater until the potentials of the two electrodes again become approximately equal. For each complete cycle, we recover 107 mJ (calculated from the integration of voltage–charge plot), corresponding to 7.4 kJ per mol of intercalated ion. This value is lower than the 16.8 kJ mol–1 reported previously,48 although we utilize a lower concentration of saline water (0.6 M vs 3.0 M NaCl). Our study also shows 4–5 orders of magnitude more energy captured per cycle normalized to electrode surface area (80–100 mJ per cycle with 9 cm2 electrodes in our study, compared to 0.1–0.7 mJ with 1 cm2 electrodes48). The voltage ratios in our study were 89.5% in wastewater effluent and 97.6% in seawater, similar to those obtained previously using a MEB equipped with NMO and Ag/AgCl electrodes.3 For single-cycle experiments, net energy recovery efficiency varied from 5 to 11% per cycle, depending on cycle duration (Figure S4). If these cells were connected in series, as in our previous study3 with NMO-Ag/AgCl, we would expect a similar maximum energy recovery efficiency (68%). The PVA/SSA coating did not impact overall energy recovery, with 72–151 mJ recovered per cycle, depending on the wastewater salinity (Figure S5).
The maximum power output of 63 mW/m2 occurs immediately after solution exchange from freshwater to seawater. The average power output during the four-step cycle was 16 mW/m2. This power output is lower than membrane-dependent technologies (PRO and RED), or MEB/membrane hybrid-technologies,37,39,49 but comparable to other technologies in the CAPMIX family: the maximum power in a CDLE based device is 18 mW/m2 immediately after the start of discharge;32 the maximum power in a CDP based device is 60–200 mW/m2.33,36 The power output was not optimized in this study and could be improved by taking measures to minimize the internal resistance, such as use of a more conductive current collector and improved reactor design or by matching the resistance of the external circuit with the internal resistance (we used a 300 Ω external resistor, whereas other studies have used external resistance < 10 Ω). While power output is still low per electrode area, process footprint and scale-up are more feasible with the charge-free device because of the simplicity of the process: energy is produced in both Step 2 and Step 4 with no requirements for membranes, charge controllers, or a potentiostat.
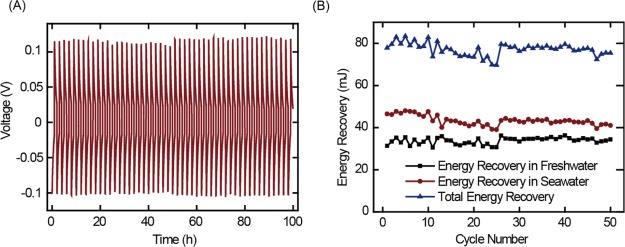
Finally, we evaluated long-term performance of the charge-free MEB with PB and PPy electrodes (Figure 4A). Both the PB and PPy electrodes were operated within the stability window. The MEB was stable for 50 cycles (Figure 4B) with less than 7% decrease in energy recovery. This capacity loss was mainly due to detachment of active materials because both PB and PPy were cycled within the stability potential window. The PVA/SSA coating significantly improved capacity retention by preventing attrition of active materials; capacity retention was greater than 97% over 180 cycles with the coating (Figure S6).
Figure 4.
Cycling performance of the charge-free MEB: (A) voltage profile of the MEB operated for 50 cycles; (B) energy recovery of the MEB over 50 cycles.
We conclude that a MEB device is feasible without the requirement of a charging step, greatly simplifying the process, with better feasibility of scale-up. PB and PPy are ideal candidates as cationic and anionic electrode materials for the charge-free MEB. Both have low cost, an overlapping potential range, sensitivity to NaCl concentration change, and excellent cycling performance and stability in aqueous solution.
Acknowledgments
The support for this research was provided by the Woods Institute for the Environment and the TomKat Center for Sustainable Energy at Stanford University and by the U.S. NSF Engineering Research Center Re-inventing the Nation’s Urban Water Infrastructure award no. 1028968. The support for X.X. was provided by a Stanford Interdisciplinary Graduate Fellowship. The support for M.P. was provided by the Oronzio and Niccolò de Nora Foundation. The support for K.D. was provided by the Canada Natural Sciences and Engineering Research Council Postdoctoral Fellowship Award.
Supporting Information Available
The Supporting Information is available free of charge on the ACS Publications website at DOI: 10.1021/acsomega.9b00863.
Experimental methods of electrode preparation; methods of cell assembly; theoretical voltage calculations; and supplementary figures, including full-cell cycling performance; impact of PVA/SSA protective coating; and net energy recovery efficiency (PDF)
Author Present Address
⊥ Department of Materials, University of Oxford, Parks Road, Oxford OX1 3PH, United Kingdom.
Author Present Address
# School of Civil and Environmental Engineering, Georgia Institute of Technology, Atlanta, GA 30332, United States.
Author Present Address
¶ Institute for Molecular Engineering, University of Chicago, Chicago, IL 60637, United States.
The authors declare no competing financial interest.
Supplementary Material
References
- Ramon G. Z.; Feinberg B. J.; Hoek E. M. V. Membrane-Based Production of Salinity-Gradient Power. Energy Environ. Sci. 2011, 4, 4423–4434. 10.1039/c1ee01913a. [DOI] [Google Scholar]
- McCarty P. L.; Bae J.; Kim J. Domestic Wastewater Treatment as a Net Energy Producer-Can This Be Achieved?. Environ. Sci. Technol. 2011, 45, 7100–7106. 10.1021/es2014264. [DOI] [PubMed] [Google Scholar]
- Ye M.; Pasta M.; Xie X.; Cui Y.; Criddle C. S. Performance of a Mixing Entropy Battery Alternately Flushed with Wastewater Effluent and Seawater for Recovery of Salinity-Gradient Energy. Energy Environ. Sci. 2014, 7, 2295–2300. 10.1039/c4ee01034e. [DOI] [Google Scholar]
- Levenspiel O.; de Nevers N. The Osmotic Pump: In principle, but probably not in practice, fresh water can be extracted from our oceans for no expenditure of energy. Science 1974, 183, 157–160. 10.1126/science.183.4121.157. [DOI] [PubMed] [Google Scholar]
- Norman R. S. Water Salination: A Source of Energy. Science 1974, 186, 350–352. 10.1126/science.186.4161.350. [DOI] [PubMed] [Google Scholar]
- Loeb S.; van Hessen F.; Shahaf D. Production of Energy from Concentrated Brines by Pressure-Retarded Osmosis. J. Membr. Sci. 1976, 1, 249–269. 10.1016/s0376-7388(00)82271-1. [DOI] [Google Scholar]
- Skilhagen S. E.; Dugstad J. E.; Aaberg R. J. Osmotic Power - Power Production Based on the Osmotic Pressure Difference between Waters with Varying Salt Gradients. Desalination 2008, 220, 476–482. 10.1016/j.desal.2007.02.045. [DOI] [Google Scholar]
- Thorsen T.; Holt T. The Potential for Power Production from Salinity Gradients by Pressure Retarded Osmosis. J. Membr. Sci. 2009, 335, 103–110. 10.1016/j.memsci.2009.03.003. [DOI] [Google Scholar]
- Lin S.; Straub A. P.; Elimelech M. Thermodynamic Limits of Extractable Energy by Pressure Retarded Osmosis. Energy Environ. Sci. 2014, 7, 2706–2714. 10.1039/c4ee01020e. [DOI] [Google Scholar]
- Post J. W.; Veerman J.; Hamelers H. V. M.; Euverink G. J. W.; Metz S. J.; Nymeijer K.; Buisman C. J. N. Salinity-Gradient Power: Evaluation of Pressure-Retarded Osmosis and Reverse Electrodialysis. J. Membr. Sci. 2007, 288, 218–230. 10.1016/j.memsci.2006.11.018. [DOI] [Google Scholar]
- Logan B. E.; Elimelech M. Membrane-Based Processes for Sustainable Power Generation Using Water. Nature 2012, 488, 313–319. 10.1038/nature11477. [DOI] [PubMed] [Google Scholar]
- Yip N. Y.; Elimelech M. Comparison of Energy Efficiency and Power Density in Pressure Retarded Osmosis and Reverse Electrodialysis. Environ. Sci. Technol. 2014, 48, 11002–11012. 10.1021/es5029316. [DOI] [PubMed] [Google Scholar]
- Pattle R. E. Production of Electric Power by Mixing Fresh and Salt Water in the Hydroelectric Pile. Nature 1954, 174, 660. 10.1038/174660a0. [DOI] [Google Scholar]
- Weinstein J. N.; Leitz F. B. Electric Power from Differences in Salinity: The Dialytic Battery. Science 1976, 191, 557–559. 10.1126/science.191.4227.557. [DOI] [PubMed] [Google Scholar]
- Lacey R. E. Energy by Reverse Electrodialysis. Ocean Eng. 1980, 7, 1–47. 10.1016/0029-8018(80)90030-x. [DOI] [Google Scholar]
- Turek M.; Bandura B. Renewable Energy by Reverse Electrodialysis. Desalination 2007, 205, 67–74. 10.1016/j.desal.2006.04.041. [DOI] [Google Scholar]
- Post J. W.; Hamelers H. V. M.; Buisman C. J. N. Energy Recovery from Controlled Mixing Salt and Fresh Water with a Reverse Electrodialysis System. Environ. Sci. Technol. 2008, 42, 5785–5790. 10.1021/es8004317. [DOI] [PubMed] [Google Scholar]
- Post J. W.Blue Energy: Electricity Production from Salinity Gradients by Reverse Electrodialysis; Wageningen University, 2009. [Google Scholar]
- Veerman J.; Saakes M.; Metz S. J.; Harmsen G. J. Reverse Electrodialysis: Performance of a Stack with 50 Cells on the Mixing of Sea and River Water. J. Membr. Sci. 2009, 327, 136–144. 10.1016/j.memsci.2008.11.015. [DOI] [Google Scholar]
- Vermaas D. A.; Guler E.; Saakes M.; Nijmeijer K. Theoretical Power Density from Salinity Gradients Using Reverse Electrodialysis. Energy Procedia 2012, 20, 170–184. 10.1016/j.egypro.2012.03.018. [DOI] [Google Scholar]
- Vermaas D. A.; Veerman J.; Yip N. Y.; Elimelech M.; Saakes M.; Nijmeijer K. High Efficiency in Energy Generation from Salinity Gradients with Reverse Electrodialysis. ACS Sustainable Chem. Eng. 2013, 1, 1295–1302. 10.1021/sc400150w. [DOI] [Google Scholar]
- Vermaas D. A.; Veerman J.; Saakes M.; Nijmeijer K. Influence of Multivalent Ions on Renewable Energy Generation in Reverse Electrodialysis. Energy Environ. Sci. 2014, 7, 1434–1445. 10.1039/c3ee43501f. [DOI] [Google Scholar]
- Yip N. Y.; Vermaas D. A.; Nijmeijer K.; Elimelech M. Thermodynamic, Energy Efficiency, and Power Density Analysis of Reverse Electrodialysis Power Generation with Natural Salinity Gradients. Environ. Sci. Technol. 2014, 48, 4925–4936. 10.1021/es5005413. [DOI] [PubMed] [Google Scholar]
- Olsson M.; Wick G. L.; Isaacs J. D. Salinity Gradient Power: Utilizing Vapor Pressure Differences. Science 1979, 206, 452–454. 10.1126/science.206.4417.452. [DOI] [PubMed] [Google Scholar]
- Zhu X.; Yang W.; Hatzell M. C.; Logan B. E. Energy Recovery from Solutions with Different Salinities Based on Swelling and Shrinking of Hydrogels. Environ. Sci. Technol. 2014, 48, 7157–7163. 10.1021/es500909q. [DOI] [PubMed] [Google Scholar]
- Rica R.; Ziano R.; Salerno D.; Mantegazza F.; van Roij R.; Brogioli D. Capacitive Mixing for Harvesting the Free Energy of Solutions at Different Concentrations. Entropy 2013, 15, 1388–1407. 10.3390/e15041388. [DOI] [Google Scholar]
- Brogioli D.; Ziano R.; Rica R. A.; Salerno O.; Hamelers H. V. M.; Mantegazza F. Exploiting the spontaneous potential of the electrodes used in the capacitive mixing technique for the extraction of energy from salinity difference. Energy Environ. Sci. 2012, 5, 9870–9880. 10.1039/c2ee23036d. [DOI] [Google Scholar]
- Brogioli D.; Ziano R.; Rica R. A.; Salerno D.; Mantegazza F. Capacitive Mixing for the Extraction of Energy from Salinity Differences: Survey of Experimental Results and Electrochemical Models. J. Colloid Interface Sci. 2013, 407, 457–466. 10.1016/j.jcis.2013.06.050. [DOI] [PubMed] [Google Scholar]
- Bijmans M. F. M.; Burheim O. S.; Bryjak M.; Delgado A.; Hack P.; Mantegazza F.; Tenisson S.; Hamelers H. V. M. CAPMIX - Deploying Capacitors for Salt Gradient Power Extraction. Energy Procedia 2012, 20, 108–115. 10.1016/j.egypro.2012.03.013. [DOI] [Google Scholar]
- Marino M.; Kozynchenko O.; Tennison S.; Brogioli D. Capacitive Mixing with Electrodes of the Same Kind for Energy Production from Salinity Differences. J. Phys.: Condens. Matter 2016, 28, 114004. 10.1088/0953-8984/28/11/114004. [DOI] [PubMed] [Google Scholar]
- Brogioli D. Extracting Renewable Energy from a Salinity Difference Using a Capacitor. Phys. Rev. Lett. 2009, 103, 058501. 10.1103/physrevlett.103.058501. [DOI] [PubMed] [Google Scholar]
- Brogioli D.; Zhao R.; Biesheuvel P. M. A Prototype Cell for Extracting Energy from a Water Salinity Difference by Means of Double Layer Expansion in Nanoporous Carbon Electrodes. Energy Environ. Sci. 2011, 4, 772–777. 10.1039/c0ee00524j. [DOI] [Google Scholar]
- Sales B. B.; Saakes M.; Post J. W.; Buisman C. J. N.; Biesheuvel P. M.; Hamelers H. V. M. Direct Power Production from a Water Salinity Difference in a Membrane-Modified Supercapacitor Flow Cell.. Environ. Sci. Technol. 2010, 44, 5661–5665. 10.1021/es100852a. [DOI] [PubMed] [Google Scholar]
- Sales B. B.; Burheim O. S.; Liu F.; Schaetzle O.; Buisman C. J. N.; Hamelers H. V. M. Impact of Wire Geometry in Energy Extraction from Salinity Differences Using Capacitive Technology. Environ. Sci. Technol. 2012, 46, 12203–12208. 10.1021/es302169c. [DOI] [PubMed] [Google Scholar]
- Sales B. B.; Liu F.; Schaetzle O.; Buisman C. J. N.; Hamelers H. V. M. Electrochemical Characterization of a Supercapacitor Flow Cell for Power Production from Salinity Gradients. Electrochim. Acta 2012, 86, 298–304. 10.1016/j.electacta.2012.05.069. [DOI] [Google Scholar]
- Liu F.; Schaetzle O.; Sales B. B.; Saakes M.; Buisman C. J. N.; Hamelers H. V. M. Effect of Additional Charging and Current Density on the Performance of Capacitive Energy Extraction Based on Donnan Potential. Energy Environ. Sci. 2012, 5, 8642–8650. 10.1039/c2ee21548a. [DOI] [Google Scholar]
- Kim T.; Logan B. E.; Gorski C. A. High Power Densities Created from Salinity Differences by Combining Electrode and Donnan Potentials in a Concentration Flow Cell.. Energy Environ. Sci. 2017, 10, 1003–1012. 10.1039/c7ee00188f. [DOI] [Google Scholar]
- La Mantia F.; Pasta M.; Deshazer H. D.; Logan B. E.; Cui Y. Batteries for Efficient Energy Extraction from a Water Salinity Difference. Nano Lett. 2011, 11, 1810–1813. 10.1021/nl200500s. [DOI] [PubMed] [Google Scholar]
- Kim T.; Rahimi M.; Logan B. E.; Gorski C. A. Harvesting Energy from Salinity Differences Using Battery Electrodes in a Concentration Flow Cell.. Environ. Sci. Technol. 2016, 50, 9791–9797. 10.1021/acs.est.6b02554. [DOI] [PubMed] [Google Scholar]
- Wessells C. D.; Huggins R. A.; Cui Y. Copper Hexacyanoferrate Battery Electrodes with Long Cycle Life and High Power. Nat. Commun. 2011, 2, 550. 10.1038/ncomms1563. [DOI] [PubMed] [Google Scholar]
- Pasta M.; Wessells C. D.; Huggins R. A.; Cui Y. A High-Rate and Long Cycle Life Aqueous Electrolyte Battery for Grid-Scale Energy Storage. Nat. Commun. 2012, 3, 1149. 10.1038/ncomms2139. [DOI] [PubMed] [Google Scholar]
- Pasta M.; Wessells C. D.; Liu N.; Nelson J.; McDowell M. T.; Huggins R. A.; Toney M. F.; Cui Y. Full Open-Framework Batteries for Stationary Energy Storage. Nat. Commun. 2014, 5, 3007. 10.1038/ncomms4007. [DOI] [PubMed] [Google Scholar]
- Osaka T.; Naoi K.; Ogano S. Effect of Polymerization Anion on Electrochemical Properties of Polypyrrole and on Li/LiClO4/Poplypyrrole Battery Performance. J. Electrochem. Soc. 1988, 135, 1071–1077. 10.1149/1.2095877. [DOI] [Google Scholar]
- Novák P.; Müller K.; Santhanam K. S. V.; Haas O. Electrochemically Active Polymers for Rechargeable Batteries. Chem. Rev. 1997, 97, 207–282. 10.1021/cr941181o. [DOI] [PubMed] [Google Scholar]
- Dong S.; Sun Z.; Lu Z. Chloride Chemical Sensor Based on an Organic Conducting Polypyrrole Polymer. Analyst 1988, 113, 1525–1528. 10.1039/an9881301525. [DOI] [Google Scholar]
- Shimidzu T.; Ohtani A.; Honda K. Charge-Controllable Poly Pyrrole/Poly Electrolyte Composite Membranes: Part III. Electrochemical Deionization System Constructed by Anion-Exchangeable and Cation-Exchangeable Polypyrrole Electrodes. J. Electroanal. Chem. 1988, 251, 323–337. 10.1016/0022-0728(88)85193-3. [DOI] [Google Scholar]
- Yongfang L.; Renyuan Q. On the Nature of Redox Processes in the Cyclic Voltammetry of Polypyrrole Nitrate in Aqueous Solutions. J. Electroanal. Chem. 1993, 362, 267–272. 10.1016/0022-0728(93)80029-h. [DOI] [Google Scholar]
- Gomes W. J. A. S.; de Oliveira C.; Huguenin F. Energy Harvesting by Nickel Prussian Blue Analogue Electrode in Neutralization and Mixing Entropy Batteries. Langmuir 2015, 31, 8710–8717. 10.1021/acs.langmuir.5b01419. [DOI] [PubMed] [Google Scholar]
- Lee J.; Kim S.; Yoon J. Rocking Chair Desalination Battery Based on Prussian Blue Electrodes. ACS Omega 2017, 2, 1653–1659. 10.1021/acsomega.6b00526. [DOI] [PMC free article] [PubMed] [Google Scholar]
Associated Data
This section collects any data citations, data availability statements, or supplementary materials included in this article.


